Abstract.
Fluence field modulated (FFM) CT allows for improvements in image quality and dose reduction. To date, only one-dimensional modulators have been proposed, as the extension to two-dimensional (2-D) modulation is difficult with solid-metal attenuation-based fluence field modulated designs. This work proposes to use liquid and gas to attenuate the x-ray beam, as unlike solids, these materials can be arranged allowing for 2-D fluence modulation. The thickness of liquid and the pressure for a given path length of gas were determined that provided the same attenuation as 30 cm of soft tissue at 80, 100, 120, and 140 kV. Liquid iodine, zinc chloride, cerium chloride, erbium oxide, iron oxide, and gadolinium chloride were studied. Gaseous xenon, uranium hexafluoride, tungsten hexafluoride, and nickel tetracarbonyl were also studied. Additionally, we performed a proof-of-concept experiment using a 96 cell array in which the liquid thickness in each cell was adjusted manually. Liquid thickness varied as a function of kV and chemical composition, with erbium oxide allowing for the smallest thickness. For the gases, tungsten hexaflouride required the smallest pressure to compensate for 30 cm of soft tissue. The 96 cell iodine attenuator allowed for a reduction in both dynamic range to the detector and scatter-to-primary ratio. For both liquids and gases, when k-edges were located within the diagnostic energy range used for imaging, the mean beam energy exhibited the smallest change with compensation amount. The thickness of liquids and the gas pressure seem logistically implementable within the space constraints of C-arm-based cone beam CT (CBCT) and diagnostic CT systems. The gas pressures also seem logistically implementable within the space and tube loading constraints of CBCT and diagnostic CT systems.
Keywords: computed tomography, fluence field modulated computed tomography, dynamic bowtie filter
1. Description of Purpose
The purpose of this work is to propose the use of fluid digital beam attenuators (DBA) to perform fluence field modulated computed tomography (FFMCT). The use of FFMCT would replace the conventional bowtie filter with a dynamic filter allowing the imaging dose to be tailored to individual patients. There are two predominant applications of FFMCT. First, FFMCT can better implement the idea behind the use of a bowtie filter, enabling a uniform flux distribution to the entire patient, resulting in a uniform dose and detector signal. Second, FFMCT can be used to perform volume of interest (VOI) imaging. VOI imaging allows one to prescribe a regionally varying level of image quality within a tomographic CT slice. The DBA allows modulation of the dose, making it possible to lower the dose to the patient in regions where high image quality is not necessary while still achieving the same or better image quality in the VOI. Previous work has simulated dynamic bowtie filters for both types of FFMCT.1–6 As current solid-metal attenuator solutions may be difficult to extend to 2-D modulation, we propose to use liquid- and gas-based attenuators which can be arrayed in a 2-D pattern to implement FFMCT. This idea is not entirely new to x-ray imaging; it was actually proposed in the early 1980s for chest radiography.7 In radiation therapy, the idea of using mercury-based attenuators to obtain fluence modulation of treatment beams was considered by Carol et al.8 The use of a heavy liquid and a weakly attenuating bowtie to produce 2-D modulation of the beam has been investigated by Liu et al.9 The use of highly attenuating liquids has also been proposed for one-dimensional (1-D) bowtie filters by Shunhavanich et al.10 Most recently the uses of a 2-D array of fluid modulators was proposed by Szczykutowicz and Hermus;11 this work is an extension of that earlier report.
Motivating the move from 1-D modulators to 2-D modulation is the increase in -axis coverage (i.e., cone angle) found in interventional, radiation therapy, and diagnostic CT scanning systems. Previously, large -axis coverages on the order of 20 cm were only found on interventional C-arm-based cone beam CT (CBCT) scanners. These large -axis coverages were also common in the radiation therapy environment using flat panel detectors attached to linacs and positioned orthogonal to the treatment head. Large -axis coverages have recently been introduced in diagnostic CT with the introduction of Toshiba’s Aquilion One (Toshiba Medical Systems, Tokyo, Japan) and the GE Revolution (GE HealthCare, Waukesha, Wisconsin) with -axis coverages of 16 cm. As the cone angle increases, there is an increasing need for fluence modulation within the -direction, assuming patient attenuation changes in the -direction. Patient attenuation, in general, changes more as a function of fan angle for patients positioned such that their long axis aligns with the scanner’s -axis than for the cone angle. However, it is still possible for large changes to occur. This is especially true for regions such as the diaphragm and the neck. A 2-D DBA would simultaneously allow for compensation in the fan and cone angle directions.
Previously, our group has reported experimental results using a solid attenuator capable of modulating the fluence incident to a patient during a CT exam along the fan angle.1,3 Extending this solid-based approach to 2-D is possible. One could align two 1-D filter arrays orthogonal to each other. The fluence profile resulting from such a setup, however, would not allow for any arbitrary fluence profile to be created. The fluence would always be mathematically limited to nonseparable distributions as a function of the filter thickness in each orthogonal direction. For example, it would be impossible to create a “bull’s eye” pattern. This limitation can be avoided if fluid is used as the attenuator. When a fluid is used, individual regions of the attenuator can be independently controlled as will be shown in this paper, allowing for separable fluence distributions.
2. Methods
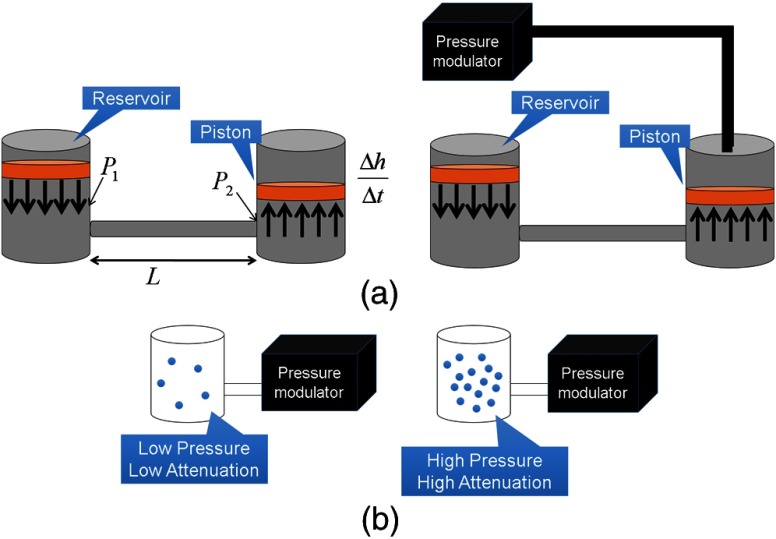
The liquid- and gas-based 2-D modulators proposed in this paper consist of individual cells laid out in a 2-D array. Both the liquid- and gas-based modulators would be fed using feed channels such that no actuating mechanisms would be within the x-ray beam path. Figure 1 shows how a liquid- and a gas-based modulator design would function. In Sec. 3, several realizations of this general concept will be presented for a liquid-based modulator design.
Fig. 1.
(a) Depiction of the proposed method for modulating the thickness of an attenuating fluid. The arrangement shown on the right in (a) allows for additional pressure, over the ambient room pressure, to increase the speed at which the liquid height can be changed. (b) Depiction of the proposed method for modulating the pressure of an attenuating gas.
To select potential fluids for the attenuator, simulations were performed to calculate approximate liquid thicknesses or gas pressures required to compensate for 30 cm of soft tissue. In other words, we solved for the thickness or pressure of an attenuating material required to equal the attenuation from 30 cm of soft tissue. We assumed an energy integrating detector with a perfect energy response. The amount of beam hardening due to these materials was also calculated.
The spectra used in all simulations were generated using the Specktr toolkit12 with an additional 2.5 mm of aluminum inherent filtration added to the beam.
2.1. Solving for Liquid Thickness
Using the Beer–Lambert law, and integrating over energy, we can calculate the detector signal as a function of soft tissue thickness and attenuator thickness for a given incident energy spectrum as
| (1) |
In order to determine the thickness of attenuating liquid required to provide the same detector signal as 30 cm of soft tissue, we minimized the following function using the Nelder–Mead simplex method.13 An initial guess for attenuator thickness equal to one hundredth of the thickness of soft tissue was used:
| (2) |
Introducing an attenuating material into the beam path that differs in atomic number and electron density from materials common to patients will cause a change in the mean beam energy. To understand the magnitude of this change in beam energy relative to the beam hardening present solely due to soft tissue, the mean beam energy of the spectrum incident onto the detector as a function of soft tissue compensation amount was calculated. The thickness of attenuator and mean beam energy were plotted as a function of soft tissue. The soft tissue thickness ranged from 0 to 30 cm.
The mean beam energy was calculated using
| (3) |
where is the mean beam energy and the value used in Eq. (3) is the one that minimizes Eq. (2) for a given soft tissue thickness . In Sec. 3, the mean beam energy as a function of soft tissue thickness with no compensation will also be shown. Without compensation, the mean beam energy will increase as the soft tissue thickness increases. With compensation, in general, the mean beam energy decreases as the soft tissue thickness increases and the amount of modulating material decreases. This is because most modulator filter materials harden the beam more than soft tissue.
2.2. Solving for Gas Attenuator Pressure
Equation (2) can easily be modified from representing a change in attenuation due to the thickness of a liquid to the pressure of a gas. In gas attenuator simulations, we assume a chamber of a fixed volume and a 15-cm length with a pressure that can vary as shown in Fig. 1. By varying the pressure via pumping in or out gas molecules, we can vary the density and therefore the attenuation of the gas.
The ideal gas law relates the pressure , volume , number of moles , universal gas constant , and temperature as . Given the definition of density , with mass and molar mass of and inserting this into the ideal gas law, one obtains as the relationship between pressure and the density of a gas-based attenuator.
Substituting the mass attenuation coefficient into Eq. (2) and using the relationship for density, as given above, allows one to solve for the pressure of the attenuator as a function of soft tissue compensation thickness. In the liquid cases, we assumed the liquid could be set to zero thickness. The analog of this for the gas-based attenuator would be setting the pressure to zero. This, however, is not a valid assumption for a gas-based attenuator, as it is impractical to completely evacuate a gas chamber every time the minimum attenuation is required. For this reason, we have set the minimum gas pressure to 0.1693 MPa.
Equation (2) can then be rewritten for a gas-based attenuator as
| (4) |
where is the pressure of the gas and is the length of the gas-based attenuator chamber. Similarly, the equation for the mean beam energy can be rewritten as
| (5) |
where is the mean beam energy and the value used in Eq. (5) is the one that minimizes Eq. (4) for the given soft tissue thickness. The Nelder–Mead simplex method13 was used to minimize Eq. (4) with an initial guess for attenuator thickness equal to 3 MPa.
2.3. Clinical Implementation
Clinically, a real-time optimization1 or an atlas of positions14,15 would be used to determine compensator thickness/pressure in place of the more time-consuming procedure outlined in Secs. 2.1 and 2.2. The calculations shown in Secs. 2.1 and 2.2 also assume a priori information is available of the soft tissue thickness for each projection. These calculations are needed to identify the clinically required attenuator thickness without concern for how one would actually adjust filter thickness during a clinical scan. The real-time optimization and atlas approaches our group has previously published use projection data from a previous view angle to determine the attenuation of subsequent view angles.
2.4. Selection of Attenuators
The ideal fluid for a liquid DBA must have a high enough attenuation value that the attenuator path length could be made to fit within current CBCT and diagnostic CT collimator housings, have a low viscosity allowing a rapid cycle time during a CT acquisition, and have a similar beam-hardening profile to that of soft tissue. For diagnostic CT, cycle times less than a quarter of a second would be required, and for cone beam CT, cycle times of 1 to 5 s are required.2,16 A more detailed analysis of some of the factors influencing cycle time for liquids is given in Sec. 2.5. For this reason, liquid DBAs may be impractical for diagnostic CT. As gases can be modulated up to the speed of sound, they have more potential to be used for diagnostic CT.
2.4.1. Liquid attenuators
Iodine contrast agents are commonly used in CT and were easily accessible for our proof-of-concept prototyping work. Our simulations were based on the iodine ISOVUE-370™ solution (Bracco, Milan, Italy) with a density of iodine of . In our simulation, we only considered attenuation due to the iodine, not the other elements/molecules present in this contrast agent. Of course, for iodine contrast imaging, the use of an iodine attenuator would not be a good choice as the K-edge in the attenuator would mitigate the contrast benefits of the iodine present in the patient. Iodine was simulated here for comparison with some of our experimental results which used iodine as an attenuating liquid.
Zinc chloride () was investigated as it has zinc, which is highly attenuating relative to soft tissue, and because it also contains chlorine, which has an attenuation value similar to that of soft tissue. Also, zinc chloride is highly soluble in water, at 25°C according to the CRC Handbook of Chemistry and Physics.17 For this reason, when simulating the zinc chloride solution a density of was used.
Cerium (III) chloride () was used by Peppler et al.7 for construction of compensation filters for chest radiography. We simulated cerium (III) chloride with a density of . Cerium (III) chloride was chosen for its high solubility and relatively high attenuation relative to soft tissue.
Erbium oxide () and iron (II,III) oxide () were also investigated. Both compounds are not soluble in water but are soluble in acids. Iron (II,III) oxide is ferromagnetic and could potentially be controlled by magnets in a different actuation scheme than that shown in Fig. 1. Both are highly attenuating relative to soft tissue and were simulated at a density of . Since density is linearly proportional to attenuation, any reported thickness at a given kV can be scaled by a density change when interpreting our results.
Gadolinium (III) chloride () is a water soluble compound investigated as it is often used in MRI as a contrast agent. Gadolinium chloride possesses a lower attenuation relative to the other liquid attenuators investigated in this work. A density of was simulated.
The densities chosen for each material were set according to those used in the literature previously (e.g., ), those commercially available (e.g., I), those listed in chemistry reference manuals (e.g., ), or set to (e.g., , , and ).
A realistic modulator length for the cone beam collimator is 20 cm or less. This thickness would already fit within most collimator housings used clinically today. Since the use of a 2-D liquid-based collimator would likely make wedge filters redundant, the wedge filters employed on most c-arm cone beam systems could be removed, freeing space for the 2-D liquid DBA. In practice, this work addresses a single facet of a future clinically implementable 2-D modulator design, material selection, and overall feasibility. Final size constraints would likely be device specific.
2.4.2. Gas attenuators
Xenon (Xe) was proposed as xenon gas detectors were used in early CT.18 Xenon also possesses beneficial properties: it is highly attenuating, nontoxic, noncorrosive, and has a high critical point.
Uranium hexaflouride () and tungsten hexafluoride () were both investigated due to their high attenuation. Tungsten hexafluoride is one of the heaviest known gases under the standard conditions. Being hexafluoride compounds, they are corrosive and toxic, making them potentially difficult to work with.
Nickel tetracarbonyl () is also a relatively highly attenuating gas with a high density. However, similar to the hexaflourides, nickel tetracarbonyl is also highly toxic.
When comparing all of the gases, the same minimum pressure was used. The minimum pressure was the pressure simulated to be present when the DBA was set to minimum attenuation. This minimum pressure would contribute to tube loading if it could not be incorporated into the standard beam prefiltration as described in our earlier work.2,3
Potentially high pressures would be required to modulate the gas density to limits corresponding to meaningful tissue compensation amounts. Therefore, the wall thickness of the 2-D array must be made thick enough to support these high pressures without warping or bursting. Additionally, the wall thickness must be made thin enough that tube loading would not be an issue. Given a maximum pressure of 5.84 MPa (the critical point for xenon),19 the yield strength of high strength stainless steel20 AISI 302 of 410 MPa, the longitudinal stress, and a radius of 3.33 mm, determines the required wall thickness to contain the gas is equal to . This calculation assumes a tubular gas chamber. If stainless steel is used to contain gases, the long axis of the chamber walls would be parallel to the x-ray beam, resulting in a 15-cm portion of stainless steel attenuation. This would produce segments of the projection that would essentially receive no detector signal. These portions of the sinogram could be corrected using redundant data or interpolation schemes.21 The long axis of the metal containers holding the gas would cause similar problem to one encountered using a metal-based DBA in our earlier work. In the metal DBA, the interfaces between individual wedge filters making up the DBA created small regions of unusable data in the sinogram. These unusable sections of the sinogram were interpolated using redundant rays as described in Ref. 1, and in doing so, artifact creation was mitigated.
2.5. Considerations for Cycle Time in Fluid Height
For the liquid-based 2-D attenuator, the cycle time is dependent on the fill rate to increase fluid thickness. To decrease fluid thickness, the force applied to lower the piston is due to the ambient air pressure. This pressure could be increased by enclosing the top of each cylinder and modulating the air pressure above the piston to increase the cycle time. An embodiment of this concept is shown in Fig. 1. If the burst pressure of the feed lines from the liquid reservoir to the cylinder/piston attenuating element is known, the maximum speed at which the liquid thickness changes can be calculated using a modified form of the Hagen–Poiseulli equation,
| (6) |
where is the change in pressure over the feed line, is the viscosity of the attenuating liquid, is the length of the feed line, is the radius of the feed line, and is the radius of the cylinder. The pressure drop is highly dependent on the feed tube radius; this function varies by , so doubling the radius of the tubing will decrease the cycle time to the original cycle time. Since the pressure drop is also related to the force required to modulate the fluids, which is then related to the cycle time, a small change in feed tube radius has a large impact on cycle time.
2.6. “Toy-Model” Validation
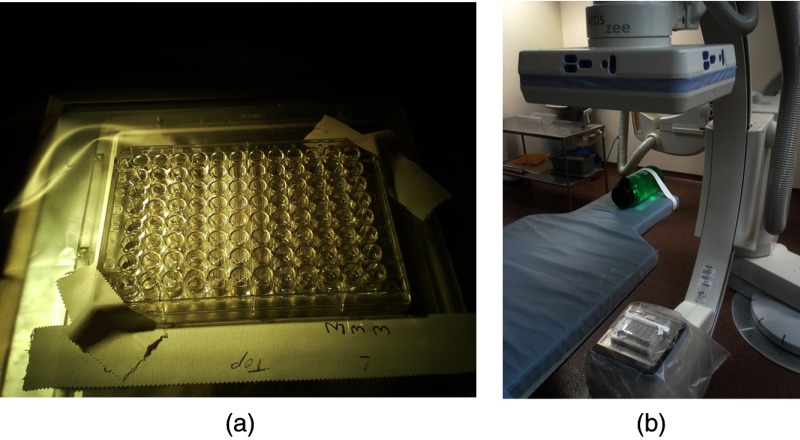
A proof-of-concept experiment was performed, creating a liquid 2-D DBA. The liquid used was iodine (ISOVUE-370, Bracco, Milan, Italy). A well plate with cylindrical chambers was used to hold the liquid. The thicknesses of I were adjusted using a pipette such that the detector signal was made as uniform as possible when a cylindrical 7-cm diameter water phantom was scanned. Each cylinder of the well plate had a height of 10.7 mm and a diameter of 6.5 mm. Experimental scans were performed on a Siemens Artis Zee Biplane System (Siemens AG, Forchheim, Germany) at 73 kV, 100 mA, and 5-ms pulse. The experimental setup can be seen in Fig. 2. Scans with and without the 2-D liquid DBA were acquired. The mean detector signal and the scatter-to-primary ratio (SPR) were measured with and without the attenuator. The SPR was measured along a cone angle of 0 deg. The scatter signal was estimated by acquiring a series of images at smaller and smaller cone beam angles and then extrapolating the detector signal for each detector row down to a cone beam angle size of zero. The cone beam angle was changed using the x-ray collimator.22 For the scatter signal determination, raw detector access was provided by Siemens (Siemens AG, Healthcare Sector, Erlangen, Germany).
Fig. 2.
(a) The modulator and (b) its position within the CBCT system.
3. Results and Discussion
3.1. Liquid and Gas Thickness and Pressure Requirements
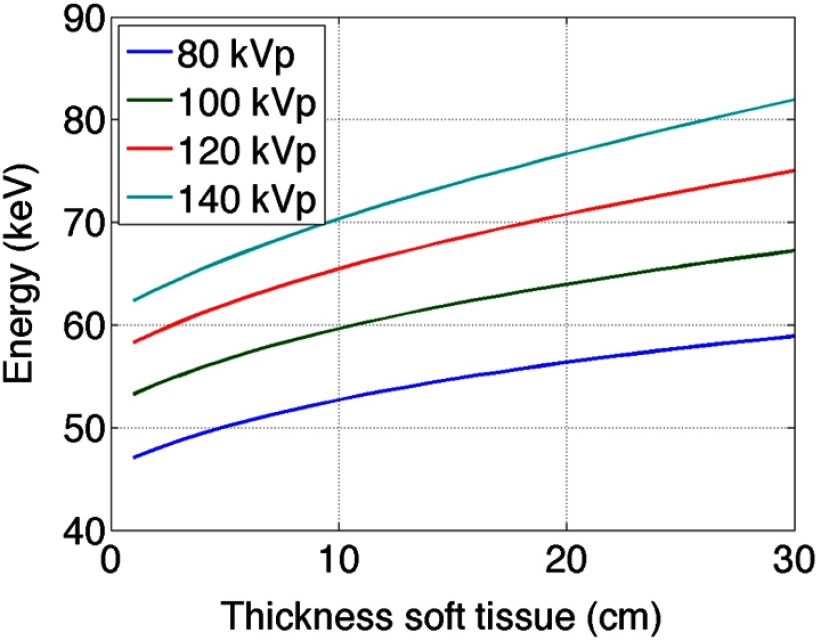
Figure 3 shows the change in beam energy solely due to soft tissue as a function of soft tissue thickness. This was provided to allow for a comparison of the mean beam energy of the various attenuators relative to the unmodulated case. As expected, for each kV, as the thickness of soft tissue in the beam increases the mean beam energy also increases.
Fig. 3.
The mean beam energy of soft tissue with increasing thickness at 80, 100, 120, and 140 kV. Here, the detector signal varies as a function of soft tissue thickness, unlike the plots shown in Figs. 4 and 5, in which the detector signal is kept constant by varying the amount of liquid or gas attenuator.
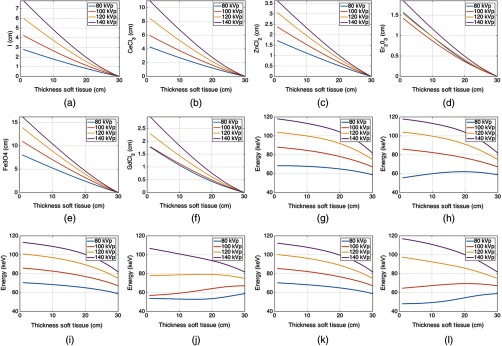
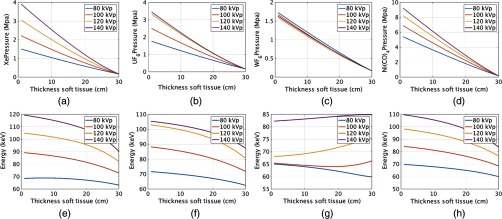
Figures 4(a) and 4(g) show the liquid iodine contrast thickness as a function of soft tissue compensation amount (i.e., how much iodine contrast agent is required to compensate for various thicknesses of soft tissue) and the change in spectra mean energy post iodine attenuator and patient. Figures 4(b)–4(f) and 4(h)–4(l) show similar plots for , , , , and , respectively. Of the liquids shown in Fig. 4, required the smallest amount of fluid thickness to compensate for 30 cm of soft tissue. All of the liquids required fluid compensation amounts that could realistically fit inside a c-arm collimator housing (i.e., of modulator thickness was required for all liquids). For diagnostic CT, the 11 cm required by and the 15 cm required by may be too large. However, these thicknesses will scale proportionally with density, and it is possible a higher density could be used than the densities assumed in our simulations. The mean beam energy showed the least change for the case of . Interestingly, the change in beam energy for is actually not monotonic but shows a peak near 20 cm of soft tissue due to the interplay between k-edges, material thickness, and the detector response (see Fig. 6). Similar behavior was observed for . Similar plots are displayed for the gases as shown for the liquids. The difference in the attenuation is with respect to pressure, not thickness. Gaseous plots of pressure and beam hardening are shown in Fig. 5 for Xe, , , and .
Fig. 4.
Liquid attenuators: (a)–(f) plots of thickness of attenuator material versus thickness of soft tissue for iodine, cerium (III) chloride, zinc chloride, erbium oxide, iron (II,III) oxide, and gadolinium (III) chloride, respectively. The detector signal is kept constant for all soft tissue thicknesses and is set equal to the detector signal corresponding to 30 cm of only soft tissue. (g)–(l) Plots of the mean beam energy with respect to the thickness of soft tissue assuming the beam is additionally filtered by the thickness of the attenuator as shown in (a)–(f), respectively.
Fig. 6.
Plots of the linear attenuation coefficients for all of the (a) liquids and (b) gases used in the simulation. (c) Also shown are the four different spectra. These were the spectra incident onto the modulators and therefore not filtered by any amount of soft tissue or modulator material.
Fig. 5.
Gas attenuators: (a)–(d) plots of pressure of attenuator material versus thickness of soft tissue for xenon, uranium hexafluoride, tungsten hexafluoride, and nickel tetracarbonyl, respectively. The detector signal is kept constant for all soft tissue thicknesses and is set equal to the detector signal corresponding to 30 cm of only soft tissue plus the attenuation due to the minimum pressure of the gas. (e)–(h) Plots of the mean beam energy with respect to the thickness of soft tissue assuming the beam is additionally filtered by the thickness of the attenuator as shown in (a)–(d), respectively.
The required liquid path thicknesses are linearly proportional to the density used in the simulation as previously described. It is likely a final implementation would require consideration of how viscosity changes with density and how this would influence cycle time. For the gases, the exhibits the flattest mean beam energy change, as would be expected due to the k-edge of W located at 69.52 keV. This k-edge location acts to mitigate the beam hardening effects of the modulator material. required a much higher pressure for the same amount of soft tissue compensation as the other gases and, due to the wall thickness requirements mentioned in Sec. 2, would likely not be an ideal candidate based on the negative effects of having thick gas chamber walls within the imaging beam.
An uncompensated beam increases in mean beam energy as the thickness of soft tissue increases, as shown in Fig. 3. For most of the beam energies shown in Figs. 4 and 5, the mean beam energy decreases with soft tissue thickness. More important than the actual trend, however, is the magnitude of mean energy change. The uncompensated beam, as shown in Fig. 3, exhibits a change in energy of about 20 keV for a 140 kV spectrum and about 13 keV for the 80 kV spectrum. For the liquids, the smallest mean energy change was for exhibiting a 25 keV change at 140 kV and less than 10 keV change at 80 keV. For the gases, the smallest change was observed for , which displayed an interesting mean beam energy change as a function of energy due to the large k-edge of W and the shape of the 80, 100, 120, and 140 kVp spectrum used in the simulation. The linear attenuation curves for the liquids, gases, and the spectra incident onto the modulators are shown in Fig. 6. Figure 6 allows one to understand why some of the mean beam energy plots for different imaging spectra are nonmonotonic. The relative locations of the k-edges for the various attenuators and the shapes of the spectra can be observed. For example, the k-edge of the compound is higher than most of the 80 kV spectra, which explains why more attenuator is needed at 80 kV than at higher beam energies to compensate for the same amount of soft tissue. As performed in Szczykutowicz and Mistretta,1 the presence and amount of attenuator should be incorporated into the beam hardening correction algorithm to mitigate additional beam hardening artifacts caused by the presence of the modulating material. The mean beam energy in Figs. 5(e)–5(h), at 30 cm of soft tissue, is larger than in the liquid case. This is because the gas chambers were simulated to have a minimum pressure; some amount of gas attenuator is always present in the beam. The liquid was simulated to allow for total evacuation of all attenuating material from the beam path. The mean beam energy for the gases at 30 cm of soft tissue, therefore, is a function of gas type and differs from the liquids.
3.2. Experimental Iodine-Based Liquid Digital Beam Attenuators and Working “Toy-Model”
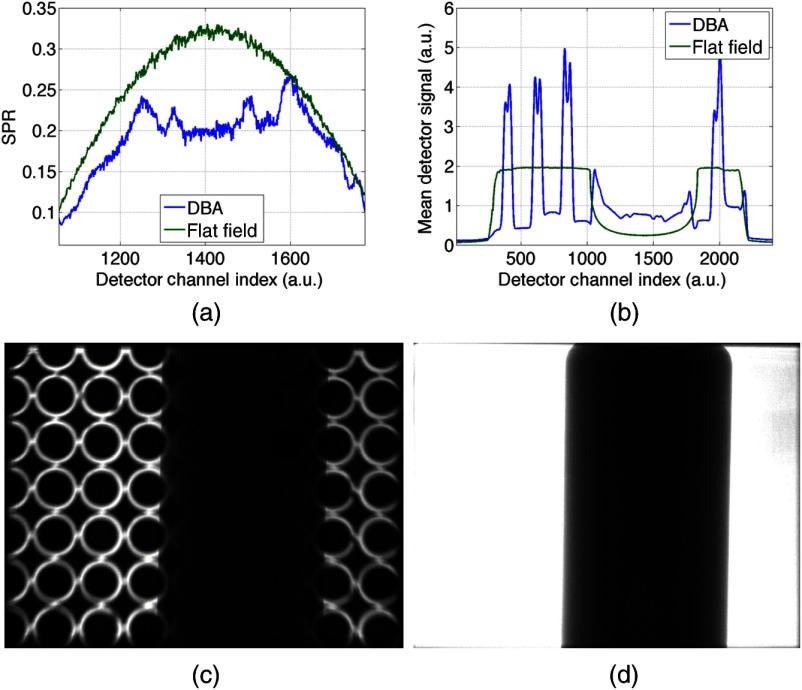
Figure 7 shows results from a simple liquid 2-D DBA prototype. The cell array shown in Fig. 7(c) was used to image a cylindrical water phantom and reduced both the SPR and the dynamic range presented to the detector, as can be observed in Figs. 7(a) and 7(b), respectively. The spaces between the cell arrays cannot be modulated in this design, and therefore these spaces cannot be compensated for, as is evident in Fig. 7(c), where the structure of the cell array is clearly visible in the projection image.
Fig. 7.
(a) SPR ratio plot comparing a liquid DBA prototype to a non-modulated acquisition. (b) Comparison of mean detector signal between the DBA and non-modulated projection. (c) Projection image from the DBA acquisition and (d) projection image from the non-modulated acquisition.
As expected, the detector signal is flatter when the DBA is used, as seen quantitatively in Fig. 7(b) and qualitatively by comparing Figs. 7(c) and 7(d). In general, for most imaging conditions, the flatter the signal is at the detector, the less scatter radiation is generated needlessly through low-attenuation regions of the phantom. This is reflected in the decreased SPR when the 2-D DBA “toy-model” is used as observed in Fig. 7(c).
3.3. Future Prototype Designs
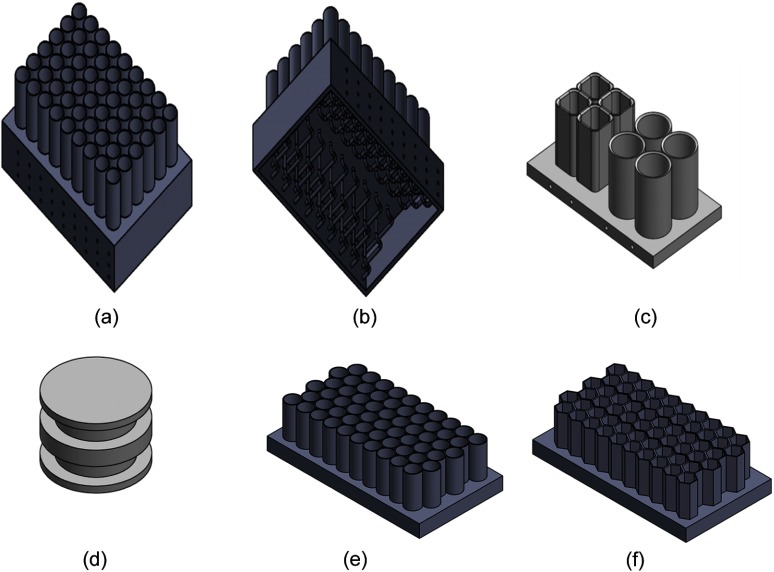
Figure 8 shows what an unfocused 2-D liquid DBA could look like. Each cell can be fed by a separate feed line, as shown in Fig. 8(b). Two different types of cells are being tested in our lab currently, as shown in Figs. 8(c) and 9. Focusing a gas-based 2-D attenuator to the geometry of a CT system would be easier than with a liquid-based 2-D attenuator. This is because the piston that is currently required in the liquid case cannot change shape as a function of liquid thickness. One could, however, curve the base of the prototype realization shown in Fig. 8(a) to match the geometry of a CT system, but this would increase the space between attenuating cells. More work remains to be done in designing a focused 2-D liquid array. Denser packed patterns which minimize air gaps could be constructed and still used for the piston or gas cases. To do this, offsetting circular cells would decrease air gaps while a hexagonal piston shape that is offset eliminates air gaps entirely [see Figs. 8(e) and 8(f)].
Fig. 8.
(a) Depiction of an unfocused 2-D liquid prototype. (b) Depiction of how each cell within the prototype in (a) would be fed liquid. (c) An example of a “square” and circular packing arrangement for 2-D fluid modulation. (d) An example piston suitable for a circular cylinder. Similar pistons have been made and tested by our group for the “square” design shown in (c). (e) and (f) Depiction of packing approaches which could minimize the portions of the attenuator that cannot be modulated.
Fig. 9.
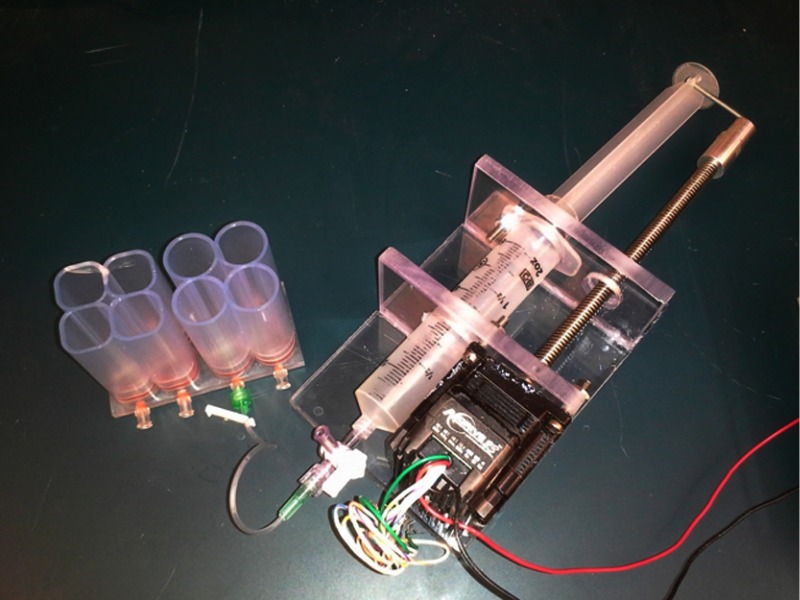
An actuator and reservoir connected to one of our current prototype’s cells are shown.
To construct a 2-D array of fluid attenuators there would have to be an individual feed line to each attenuator compartment. Feed lines are shown in Fig. 8(b). Each of these feed lines would be connected to a reservoir piston or gas regulator system for liquids and gases, respectively, as idealized in Fig. 1 and realized in Fig. 9.
4. Conclusions
This work is the first time the use of liquid or gas modulators has been proposed and investigated for 2-D FFMCT to our knowledge. We have shown that the use of both liquid and gas is feasible based on our simple “toy-model” of a working liquid modulation device and our numerical results, which show that liquids and gases can provide the needed compensation with feasible thicknesses and pressures. 2-D modulators are advantageous to 1-D modulators for large cone angle scanning, which is present in CBCT and is becoming more widely used in diagnostic CT. The techniques and analysis shown in this work are also directly applicable to 1-D FFMCT.10
Acknowledgments
We acknowledge support from Siemens Medical Systems (AX Division, USA) for assistance in obtaining experimental data, specifically, Dr. Kevin Royalty and Dr. Sebastian Schafer.
Biographies
James R. Hermus is an undergraduate biomedical engineering student at the University of Wisconsin–Madison, working in the Department of Medical Physics. He is a member of SPIE.
Timothy P. Szczykutowicz is an assistant professor of radiology with affiliate appointments in medical physics and biomedical engineering at the University of Wisconsin–Madison. His research interests include clinical CT protocol management and optimization in addition to fluence field modulated CT. He is a member of SPIE.
References
- 1.Szczykutowicz T. P., Mistretta C. A., “Experimental realization of fluence field modulated CT using digital beam attenuation,” Phys. Med. Biol. 59, 1305 (2014). 10.1088/0031-9155/59/5/1305 [DOI] [PMC free article] [PubMed] [Google Scholar]
- 2.Szczykutowicz T. P., Mistretta C. A., “Design of a digital beam attenuation system for computed tomography: Part I. System design and simulation framework,” Med. Phys. 40(2), 021905 (2013). 10.1118/1.4773879 [DOI] [PMC free article] [PubMed] [Google Scholar]
- 3.Szczykutowicz T. P., Mistretta C. A., “Design of a digital beam attenuation system for computed tomography: Part II. Performance study and initial results,” Med. Phys. 40, 021906 (2013). 10.1118/1.4773880 [DOI] [PMC free article] [PubMed] [Google Scholar]
- 4.Hsieh S. S., Pelc N. J., “The feasibility of a piecewise-linear dynamic bowtie filter,” Med. Phys. 40, 031910 (2013). 10.1118/1.4789630 [DOI] [PMC free article] [PubMed] [Google Scholar]
- 5.Bartolac S., et al. , “Fluence field optimization for noise and dose objectives in CT,” Med. Phys. 38, S2 (2011). 10.1118/1.3574885 [DOI] [PubMed] [Google Scholar]
- 6.Cho S., et al. , “Region-of-interest image reconstruction with intensity weighting in circular cone-beam ct for image-guided radiation therapy,” Med. Phys. 36(4), 1184–1192 (2009). 10.1118/1.3085825 [DOI] [PMC free article] [PubMed] [Google Scholar]
- 7.Peppler W. W., et al. , “Digitally controlled beam attenuator,” Proc. SPIE 0347, 106 (1982). 10.1117/12.933815 [DOI] [Google Scholar]
- 8.Carol M. P., “Method and apparatus for conformal radiation therapy,” U.S. Patent 5,596,619 (1997).
- 9.Liu F., et al. , “Dynamic bowtie filter for cone-beam/multi-slice CT,” PLoS One 9, e103054 (2014). 10.1371/journal.pone.0103054 [DOI] [PMC free article] [PubMed] [Google Scholar]
- 10.Shunhavanich P., Hsieh S. S., Pelc N. J., “Fluid-filled dynamic bowtie filter: a feasibility study,” Proc. SPIE 9412, 94121L (2015). 10.1117/12.2081673 [DOI] [Google Scholar]
- 11.Szczykutowicz T. P., Hermus J., “Fluid dynamic bowtie attenuators,” Proc. SPIE 9412, 94120X (2015). 10.1117/12.2077618 [DOI] [Google Scholar]
- 12.Siewerdsen J., et al. , “Specktr: a computational tool for x-ray spectral analysis and imaging system optimization,” Med. Phys. 31, 3057–3067 (2004). 10.1118/1.1758350 [DOI] [PubMed] [Google Scholar]
- 13.Lagarias J., et al. , “Convergence properties of the Nelder–Mead simplex method in low dimensions,” SIAM J. Optim. 9(1), 112–147 (1998). 10.1137/S1052623496303470 [DOI] [Google Scholar]
- 14.Szczykutowicz T., Mistretta C., “Construction of an atlas of filter configuration for fluence field modulated CT,” in The Third Int. Conf. on Image Formation in X-ray Computed Tomography, pp. 48–51 (2014). [Google Scholar]
- 15.Szczykutowicz T. P., Hermus J., “Creation of an atlas of filter positions for fluence field modulated CT,” Med. Phys. 42(4), 1779–1786 (2015). 10.1118/1.4915123 [DOI] [PubMed] [Google Scholar]
- 16.Heuscher D., Noo F., “CT dose reduction using dynamic collimation,” in Nuclear Science Symp. and Medical Imaging Conf. (NSS/MIC), 2011 IEEE, pp. 3470–3473, IEEE; (2011). [Google Scholar]
- 17.Haynes W. M., Ed., Handbook of Chemistry and Physics, 95th ed., CRC Press, Boca Raton, Florida: (2014). [Google Scholar]
- 18.Yaffe M., Fenster A., Johns H. E., “Xenon ionization detectors for fan beam computed tomography scanners,” J. Comput. Assisted Tomogr. 1(4), 419–428 (1977). 10.1097/00004728-197710000-00007 [DOI] [PubMed] [Google Scholar]
- 19.Sifner O., Klomfar J., “Thermodynamic properties of xenon from the triple point to 800 K with pressures up to 350 MPa,” J. Phys. Chem. 23(1), 63–152 (1994). 10.1063/1.555956 [DOI] [Google Scholar]
- 20.Beer F., et al. , Mechanics of Materials, McGraw-Hill Education, New York: (2011). [Google Scholar]
- 21.Hsieh J., Computed Tomography: Principles, Design, Artifacts, and Recent Advances, Vol. PM114, SPIE Press, Bellingham, WA: (2003). [Google Scholar]
- 22.Graham S., et al. , “Compensators for dose and scatter management in cone-beam computed tomography,” Med. Phys. 34, 2691 (2007). 10.1118/1.2740466 [DOI] [PubMed] [Google Scholar]


