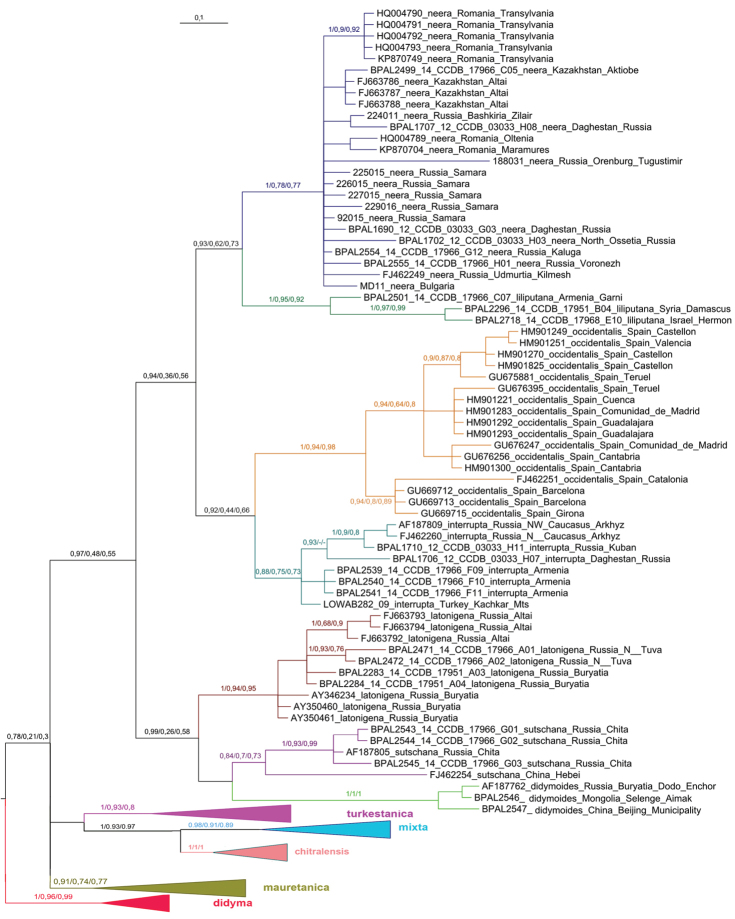
Figure 2.
Fragment of the Bayesian tree of Melitaea didyma complex (haplogroups neera, liliputana, occidentalis, interrupta, latonigena, sutschana and didymoides) based on analysis of the (COI) gene. Numbers at nodes indicate Bayesian posterior probability/ML bootstrap/MP bootstrap values, with nonmatching clades using different analyses indicated by ‘-’. Scale bar = 0.1 substitutions per position.

