Abstract
Determining the survival rate of avian embryos during incubation is essential for cost-saving in the poultry industry. A multi-channel diffuse speckle contrast analysis (DSCA) system, comprising four optical fiber channels, is proposed to achieve noninvasive in vivo measurements of deep tissue flow. The system was able to monitor chick embryo vital signs over the entire incubation period. Moreover, it proved useful in distinguishing between chick embryos in healthy and weakened conditions.
OCIS codes: (000.1430) Biology and medicine, (110.6150) Speckle imaging
1. Introduction
Stable blood circulation plays an important role in preserving the physical health of animals [1,2]. It is related to blood pressure, among other vital signs used to assess basic body functions. Blood flow is critical in the development of avian embryos as it transports nutrients, preserves body temperature, and maintains cell-level metabolism. Fast and accurate measurements of vital signs, such as blood flow, could contribute to financial savings in the poultry industry.
Several imaging modalities, including particle image velocimetry [3], photoacoustic tomography, and optical coherence tomography [4,5] have been developed to measure blood flow in the hearts of chick embryos. The invasiveness of these techniques limits their application in poultry farming. However, various non-invasive techniques used to measure the fertility of avian embryos have been proposed. Candling is often used on poultry farms, because the measurement of vital signs is simple [6]. Inspectors monitor the daily development of blood vessels and the movement of an embryo in the early incubation stages by illuminating the egg with a flashlight in a dark room. However, vital signs in the later stages of incubation cannot be precisely and quantitatively measured due to the high absorption of light. Micro-magnetic resonance imaging has been used to establish three-dimensional images of chick embryos, but it is not a practical solution for poultry farms due to the high cost and low image acquisition speed [7]. Laser speckle systems analyze speckle variations caused by the cardiac contraction of avian embryos under laser light illumination. However, the technique requires highly sensitive detectors and complicated hardware implementation, and it cannot detect vital signs in the early incubation stages [8]. The Buddy digital egg monitor measures embryo heart rates after six days of incubation [9], and the laser speckle imaging (LSI) system has been used to detect vital signs of chick embryos in the first six days of incubation [10]. The LSI system generates a blood flow map based on speckle intensity fluctuations from embryonic vasculatures and can determine embryonic fertilization in the early incubation stage; however, it does not show vital signs after six days of incubation.
Recently, diffuse speckle contrast analysis (DSCA) has been validated as a novel deep tissue flowmeter system with the advantages of a low cost, easy analysis, fast image acquisition time, and a simple experimental setup [11,12]. The instrumentation used in a DSCA system resembles that of diffuse correlation spectroscopy (DCS) [13–15], and data analysis is simple and similar to a LSI system [16–18]. DCS is a powerful tool for deep blood flow measurements; however, it requires complicated data processing and a highly sensitive photodetector. LSI can be used for full-field imaging of superficial layers. DSCA is capable of assessing deep tissue flow, based on the configuration of the DCS and simple data analysis of the LSI. Here, we present a multi-channel DSCA (mDSCA) system that estimates the blood flow index (BFI) from the speckle pattern. Chick embryo vital sign measurements are obtained noninvasively by monitoring the blood flow over the entire incubation period.
2. Materials and methods
2.1 Experimental setup
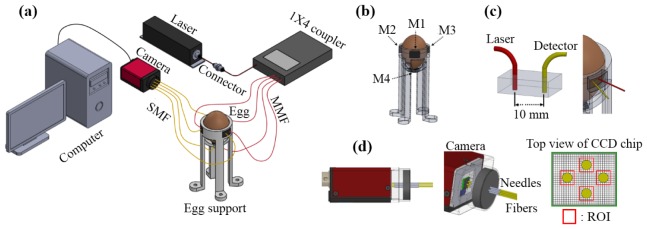
Figure 1(a) shows a schematic diagram of the mDSCA system for measurement of chick embryo vital signs. An optical fiber extending from a laser source (DL-785-100S, CrystaLaser, 785 nm, 100 mW) is connected with a 1 × 4 coupler to divide the fiber into four multi-mode fiber (MMF) outputs. Four single-mode fibers (SMF, core size: 7 μm) are closely packed and fixed to a camera’s charge coupled device (CCD) detector chip (F-033B, Stingray, cell size: 9.9 μm) without physical contact between them, as shown in Fig. 1(d). The region of interest (ROI) of the CCD chip is 7 × 7 pixels, which allows the intensity measured by each detection fiber to be processed in its entirety. The distance between the four detection channels is maintained far enough to avoid cross-talk. A CCD detector is used instead of a photon detector to simplify the configuration of the detection channels; this allows simultaneous multi-channel detection and reduces the cost. The egg support is designed to hold the egg and to allow contact with each detection probe via a small square hole. Four detection probes are located in flexible polydimethylsiloxane (PDMS) to selectively change the inter-optode distance between the illumination and detection fibers. In the DSCA setup, the CCD chip is mounted with four optical fibers. Although lens-based CCD cameras can measure fluctuated speckle patterns without optical fibers, it is difficult to maintain focus over the entire measurement period. Also, fiber-less systems offer limited coverage of the egg surface, while fiber-based DSCA systems can use many probes on the surface.
Fig. 1.
Multi-channel diffuse speckle contrast analysis (mDSCA) system. (a) Schmatic diagram of the mDSCA system. (b) Four measurement positions on the egg support. (c) Implementation of the probe. (d) Detection channels.
The laser power was adjusted to 6.9 ± 1.3 mW cm−2 at each measurement position to prevent harm to the embryos [10,19]. The egg shell was illuminated by the laser for 200 s during each monitoring cycle. The optical energy was 1.38 ± 0.26 J cm−2. Although biological effects from light illumination have been reported, no significant difference was observed between laser illuminated and non-illuminated eggs in the artificial incubator.
2.2 Experimental protocol
The measurement positions M1–M4 were marked to analyze the blood flow at the same positions every day, as shown in Fig. 1(b). The large end of the egg is excluded from measurement due to the air cell. Experimental measurements were used to gather a more accurate value for the 200 raw BFI over a 200 s period and were simultaneously performed for all positions each day. From now on, we use the term ‘BFI’ to represent the temporal mean of raw BFIs for 200 seconds. The inter-optode distance for best contrast during all incubation periods was 10 mm, as shown in Fig. 1(c).
2.3 Signal processing of the DSCA
In the processing data from the LSI system, speckle contrast () is calculated as the ratio between the standard deviation and the mean speckle intensity at the image pixels with equal dimensions, as given in Eq. (1) [16–18]:
| (1) |
The speckle contrast is defined from the normalized electric field autocorrelation for a given exposure time on the CCD camera as in following expression:
| (2) |
where means exposure time, is the normalized variance, represents a delay time, and is the constant dependent on the ratio of CCD chip size to a speckle size.
In the DCS system, the BFI is determined by an unnormalized electric field autocorrelation , as follows:
| (3) |
where , , , are the reduced scattering coefficient, absorption coefficient, the fraction of dynamic photon scattering events in medium, respectively. For definitions of ,,,, and , please refer to the literature [13]. Then, the BFI of the DCS system is accepted as for Brownian motion model. is the effective diffuse coefficient.
The BFI of the DSCA system can be expressed as the relationship between (for the LSI) and (for the DCS) by combining Eqs. (2) and (3). It is shown that and are linearly proportional to the physiological blood flow range. Therefore, the BFI of the DSCA is given by the following [11,12]:
| (4) |
where t represents temporal domain analysis. In the temporal domain, is calculated by the correlation of pixels over time at the same positions of specific images. However, in spatial domain analysis, the speckle contrast is calculated from the correlation of neighboring pixels in an image. Spatial domain analysis offers improved temporal resolution; however, to acquire better spatial resolution, BFI monitoring is used in the temporal domain rather than the spatial domain. For better contrast, the exposure time and frame rate of the CCD camera were set to 50.027 ms and 20 fps, respectively. The speckle contrast calculated from 20 images can produce the BFI with a refresh rate of ~1 Hz. Each data point is calculated by summing the elements of a 7 × 7 pixel array.
2.4 Sample preparation
Fourteen eggs were incubated in an artificial incubator at 38 ± 0.1°C and 75% humidity for 20 days. To induce a weakened embryo condition, three incubated eggs were cooled in a refrigerator at 5°C for 300 min on the 10th day of incubation.
3. Results
3.1 Change of spatially averaged BFI over the entire incubation period
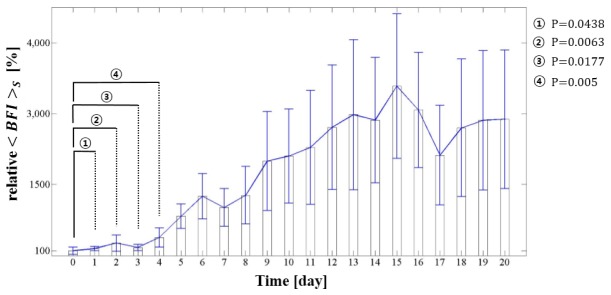
Figure 2 shows the relative change in the, the spatial average over all measurement positions according to the incubation day. The error bar for each day indicates the discrepancy in BFI among eleven eggs. The Day 0 in incubation period is before the eggs are put into the incubator. Theincreased due to embryonic development. These results are similar to those of a study that measured the mean heart rate of a chick embryo between three and twenty days of incubation [9]. Although the increase of heart rate may well be correlated to the BFI increase [20], the BFI change during incubation is mainly due to the increase of the number of blood vessels that leads to the increase of blood volume. As embryo heart and blood vessels begin to beat and grow in the first quarter of the incubation period, the is relatively low. To analyze the BFI change in early incubation stage, student’s t-test is performed by comparing the between Day 0 and each day. Although a distinct increase from Day 0 to Day 4 could not be shown, the results indicated a difference of at least P < 0.05. In the second and third quarter of the incubation period, the increased development of embryo vessels and organs increased the further. The is proportional to the amount of blood in the vessel. During the final quarter, as feathers begin to cover the body, and the yolk sac draws into the abdomen, the reflected light measured from the detection fibers is reduced; this corresponded to a decrease in the from Day 15 to Day 17 in our measurements. The subsequent increase in the was attributed to the increased movement of the embryos.
Fig. 2.
Change in the blood flow index () of eleven incubated eggs during the incubation period (20 days).
3.2 Mean BFI on the measurement positions
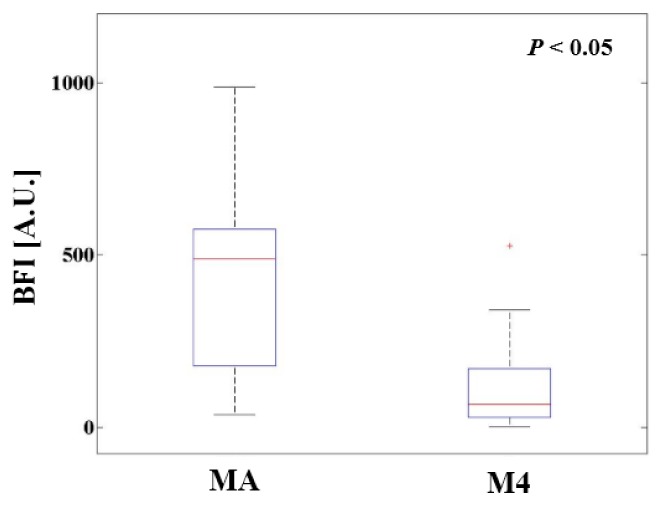
The BFI difference across the measurement positions during all incubation periods is shown in Fig. 3. Three measurement positions (M1, M2, and M3) were indistinguishable, due to the differing embryo’s morphology and posture. Therefore, the average result of M1, M2, and M3 was computed as MA. M4 is the position in which the volume of the albumen is relatively larger than the volume of the yolk [7]. The BFI of MA was larger than that of M4, because the blood volume in the embryo and yolk sac was greater.
Fig. 3.

Comparison of MA and M4 mean BFIs. Note that MA represents the average result of measurement positions M1, M2, and M3.
3.3 Comparison of spatially averaged BFI between healthy and weakened conditions
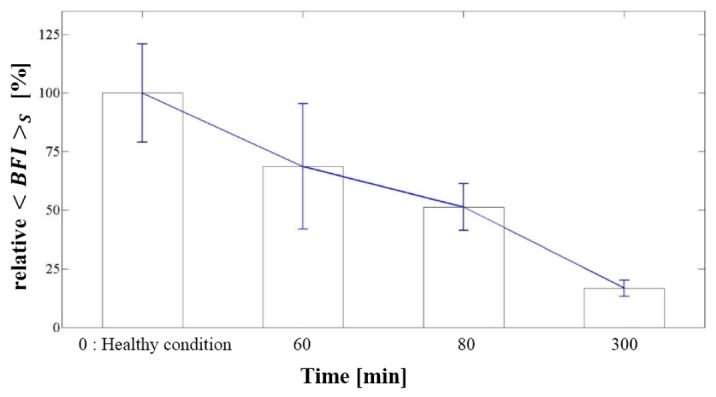
To demonstrate the detection of chick embryo vital signs, the from all measurement positions (M1 to M4) of healthy embryos was compared to that of three weakened embryos after ten days of incubation, as shown in Fig. 4. The initial BFI corresponds to a healthy condition, before being placed in a refrigerator. After 60 min, the decreased, suggesting that the embryo’s condition had been weakened by the cooling. This is similar to the results of previous studies that showed a decrease in heart rate during the cooling process [9,10]. Thus, these results indicate that the mDSCA system can be used to monitor the vital signs of chick embryos. Also, we see about 5 fold difference between healthy and weakened condition. This observation supports the hypothesis that most of the BFI changes we observed during incubation is due to the real blood flow increase, as the only difference between the two cases is mostly the blood flow, not absorption or scattering.
Fig. 4.

Change of in low-temperature environments.
4. Discussion and conclusion
One of the limitations of this study is that we have used the autocorrelation function of diffuse regime throughout the incubation stages, whereas it is clear that diffuse approximation does not hold during the early incubation stage. But the egg evolves from clear to diffuse regime quite fast, and we decided to use diffuse approximation for simpler analysis. Further studies regarding accurate simulation of this transition is underway.
In summary, we propose a multi-channel DSCA system that can noninvasively monitor chick embryo vital signs during the incubation period by analyzing the diffuse speckle contrast of the eggshell. This system can distinguish the vital signs of embryos by monitoring changes in the BFI during incubation. This is related to the internal flow of egg tissues in accordance with embryo development. Automatic, accurate, and high-speed blood flow monitoring of many eggs simultaneously will be achieved in the near future.
Acknowledgments
This work was supported by the DGIST R&D Program (15-BD-0401) and DGIST MIREBraiN Program (2015010026) of Ministry of Science, ICT and Future Planning.
References and links
- 1.Pickering T. G., Hall J. E., Appel L. J., Falkner B. E., Graves J., Hill M. N., Jones D. W., Kurtz T., Sheps S. G., Roccella E. J., “Recommendations for blood pressure measurement in humans and experimental animals: part 1: blood pressure measurement in humans: a statement for professionals from the Subcommittee of Professional and Public Education of the American Heart Association Council on High Blood Pressure Research,” Circulation 111(5), 697–716 (2005). 10.1161/01.CIR.0000154900.76284.F6 [DOI] [PubMed] [Google Scholar]
- 2.Schmitz B., Böttiger B. W., Hossmann K. A., “Functional activation of cerebral blood flow after cardiac arrest in rat,” J. Cereb. Blood Flow Metab. 17(11), 1202–1209 (1997). 10.1097/00004647-199711000-00009 [DOI] [PubMed] [Google Scholar]
- 3.Vennemann P., Kiger K. T., Lindken R., Groenendijk B. C., Stekelenburg-de Vos S., ten Hagen T. L., Ursem N. T., Poelmann R. E., Westerweel J., Hierck B. P., “In vivo micro particle image velocimetry measurements of blood-plasma in the embryonic avian heart,” J. Biomech. 39(7), 1191–1200 (2006). 10.1016/j.jbiomech.2005.03.015 [DOI] [PubMed] [Google Scholar]
- 4.Rugonyi S., Shaut C., Liu A., Thornburg K., Wang R. K., “Changes in wall motion and blood flow in the outflow tract of chick embryonic hearts observed with optical coherence tomography after outflow tract banding and vitelline-vein ligation,” Phys. Med. Biol. 53(18), 5077–5091 (2008). 10.1088/0031-9155/53/18/015 [DOI] [PubMed] [Google Scholar]
- 5.Liu M., Maurer B., Hermann B., Zabihian B., Sandrian M. G., Unterhuber A., Baumann B., Zhang E. Z., Beard P. C., Weninger W. J., Drexler W., “Dual modality optical coherence and whole-body photoacoustic tomography imaging of chick embryos in multiple development stages,” Biomed. Opt. Express 5(9), 3150–3159 (2014). 10.1364/BOE.5.003150 [DOI] [PMC free article] [PubMed] [Google Scholar]
- 6.Andersson C., Gripenland J., Johansson J., “Using the chicken embryo to assess virulence of Listeria monocytogenes and to model other microbial infections,” Nat. Protoc. 10(8), 1155–1164 (2015). 10.1038/nprot.2015.073 [DOI] [PubMed] [Google Scholar]
- 7.Li X., Liu J., Davey M., Duce S., Jaberi N., Liu G., Davidson G., Tenent S., Mahood R., Brown P., Cunningham C., Bain A., Beattie K., McDonald L., Schmidt K., Towers M., Tickle C., Chudek S., “Micro-magnetic resonance imaging of avian embryos,” J. Anat. 211(6), 798–809 (2007). 10.1111/j.1469-7580.2007.00825.x [DOI] [PMC free article] [PubMed] [Google Scholar]
- 8.Tazawa H., Hiraguchi T., Asakura T., Fujii H., Whittow G. C., “Noncontact measurements of avian embryo heart rate by means of the laser speckle: comparison with contact measurements,” Med. Biol. Eng. Comput. 27(6), 580–586 (1989). 10.1007/BF02441639 [DOI] [Google Scholar]
- 9.Lierz M., Gooss O., Hafez M., “Noninvasive heart rate measurement using a digital Egg monitor in chicken and turkey embryos,” J. Avian Med. Surg. 20(3), 141–146 (2006). 10.1647/2005-017R.1 [DOI] [Google Scholar]
- 10.Yang L., You S., Zhang L., Yang T., Li P., Lu J., “Noninvasive vasculature detection using laser speckle imaging in avian embryos through intact egg in early incubation stage,” Biomed. Opt. Express 4(1), 32–37 (2013). 10.1364/BOE.4.000032 [DOI] [PMC free article] [PubMed] [Google Scholar]
- 11.Bi R., Dong J., Lee K., “Deep tissue flowmetry based on diffuse speckle contrast analysis,” Opt. Lett. 38(9), 1401–1403 (2013). 10.1364/OL.38.001401 [DOI] [PubMed] [Google Scholar]
- 12.Dong J., Lee K., Grant P. M., “Multi-channel deep tissue flowmetry based on temporal diffuse speckle contrast analysis,” Opt. Express 21(19), 22854–22861 (2013). 10.1364/OE.21.022854 [DOI] [PubMed] [Google Scholar]
- 13.Durduran T., Choe R., Baker W. B., Yodh A. G., “Diffuse optics for tissue monitoring and tomography,” Rep. Prog. Phys. 73(7), 076701 (2010). 10.1088/0034-4885/73/7/076701 [DOI] [PMC free article] [PubMed] [Google Scholar]
- 14.Carp S. A., Dai G. P., Boas D. A., Franceschini M. A., Kim Y. R., “Validation of diffuse correlation spectroscopy measurements of rodent cerebral blood flow with simultaneous arterial spin labeling MRI; towards MRI-optical continuous cerebral metabolic monitoring,” Biomed. Opt. Express 1(2), 553–565 (2010). 10.1364/BOE.1.000553 [DOI] [PMC free article] [PubMed] [Google Scholar]
- 15.Huang C., Radabaugh J. P., Aouad R. K., Lin Y., Gal T. J., Patel A. B., Valentino J., Shang Y., Yu G., “Noncontact diffuse optical assessment of blood flow changes in head and neck free tissue transfer flaps,” J. Biomed. Opt. 20(7), 075008 (2015). 10.1117/1.JBO.20.7.075008 [DOI] [PMC free article] [PubMed] [Google Scholar]
- 16.Bandyopadhyay R., Gitting A. S., Suh S. S., Dixon P. K., Durian D. J., “Speckle-visibility spectroscopy: A tool to study time-varying dynamics,” Rev. Sci. Instrum. 76(9), 093110 (2005). 10.1063/1.2037987 [DOI] [Google Scholar]
- 17.Briers J. D., Webster S., “Laser speckle contrast analysis (LASCA): a nonscanning, full-field technique for monitoring capillary blood flow,” J. Biomed. Opt. 1(2), 174–179 (1996). 10.1117/12.231359 [DOI] [PubMed] [Google Scholar]
- 18.Boas D. A., Dunn A. K., “Laser speckle contrast imaging in biomedical optics,” J. Biomed. Opt. 15(1), 011109 (2010). 10.1117/1.3285504 [DOI] [PMC free article] [PubMed] [Google Scholar]
- 19.Yeager R. L., Franzosa J. A., Millsap D. S., Angell-Yeager J. L., Heise S. S., Wakhungu P., Lim J., Whelan H. T., Eells J. T., Henshel D. S., “Effects of 670-nm phototherapy on development,” Photomed. Laser Surg. 23(3), 268–272 (2005). 10.1089/pho.2005.23.268 [DOI] [PubMed] [Google Scholar]
- 20.Brown R., Kemp U., Macefield V., “Increases in muscle sympathetic nerve activity, heart rate, respiration, and skin blood flow during passive viewing of exercise,” Front. Neurosci. 7(7), 102 (2013). [DOI] [PMC free article] [PubMed] [Google Scholar]


