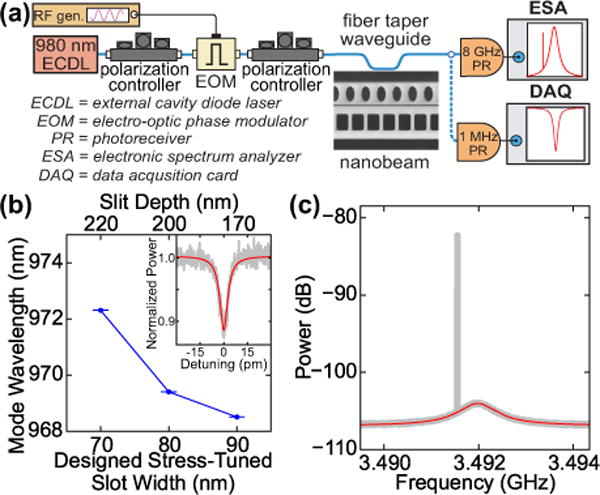
FIG. 3.

(a) Optical modes are detected by swept-wavelength spectroscopy, while mechanical modes are measured when the laser is on the blue-detuned shoulder of the optical mode. For g0 calibration, the laser is phase-modulated. (b) Optical resonant wavelength of three devices with different stress-tuned slot widths. (inset) Optical spectrum and fit of highest measured Qo among these devices, having designed gap of 50 nm and Qo = (1.65 ± 0.09) × 105 [25] (c) Example mechanical spectrum, including phase modulator calibration peak. This power spectral density plot is referenced to a power of 1 mW = 0 dB. Lorentzian fit of thermal noise spectrum is in red.
