

Abstract
Objective
Vascular permeability and inflammatory demyelination are intimately linked in the brain, but what is their temporal relationship? We aimed to determine the radiological correlates of the earliest tissue changes accompanying demyelination in a primate model of multiple sclerosis (MS), experimental autoimmune encephalomyelitis (EAE) in the common marmoset.
Methods
At 7 tesla MRI, T1 maps, proton density and T2-weighted images were acquired before and after EAE induction in 5 marmosets (every other week before lesions appeared, weekly thereafter). From scans before and after intravenous injection of contrast material, we measured the evolution of lesional blood-brain-barrier (BBB) permeability, comparing in vivo MRI to postmortem tissue examination.
Results
On average, BBB permeability increased 3.5 fold (p<0.0001) over the 4 weeks prior to lesion appearance. Permeability gradually decreased after lesion appearance, with attendant changes in the distribution of inflammatory cells (predominantly macrophages and microglia) and demyelination. On tissue analysis, we also identified small perivascular foci of microglia and T cells without blood-derived macrophages or demyelination. These foci had no visible MRI correlates, though permeability within the foci, but not outside, increased in the weeks before the animals died (p<0.0001).
Interpretation
This study provides compelling evidence that in marmoset EAE, which forms lesions strongly resembling those of MS, early changes in vascular permeability are associated with perivascular inflammatory cuffing and parenchymal microglial activation but precede the arrival of blood-derived monocytes that accompany demyelination. Prospective detection of transient permeability changes could afford an opportunity for early intervention to forestall tissue damage in newly forming lesions.
Introduction
MS is pathologically characterized by focal inflammatory and demyelinated lesions in the brain and spinal cord.1 Longitudinal, serial MRI can follow in vivo the development of new brain lesions over time. MRI techniques can detect pathological changes in white matter areas of subsequent lesion formation up to several weeks before lesions appear on conventional MRI,2–8 possibly before the onset of demyelination. BBB permeability in cerebral inflammatory demyelination allows serum proteins and inflammatory cells to enter the parenchyma,9 but whether this heralds or lags demyelination remains unknown. In vivo, this process can be visualized through MRI signal changes associated with leakage of paramagnetic, gadolinium-based contrast agents injected intravenously.10 The presence of contrast enhancement within an MS lesion usually indicates that the lesion has developed recently – typically within the past 1–2 months.
In human studies, the pathological correlates of developing MS lesions are exceedingly difficult to elucidate, as lesions are rarely fatal, and areas of future lesion development are not likely to be included or recognized in biopsy samples. Autopsy studies describe areas of possible (but not proven) future lesion formation as small foci of inflammatory cells, mostly activated microglia, without established demyelination.11–13 Microglial activation in these areas has been associated with fibrinogen leakage related to BBB disruption.14,15 However, due to their small size, relatively little inflammation, and lack of demyelination, these inflammatory foci are not directly visible on in vivo conventional MRI.
With this background, we aimed to test whether prelesional inflammatory changes can be detected by serial 7-tesla (7T) MRI in an animal model of MS that bears strong immunological and pathological similarities with the human disease: relapsing-remitting (RR) EAE in the common marmoset.16 The experimental paradigm included imaging at baseline and frequently after disease induction and focused on detecting lesions as well as local BBB permeability changes over time. By comparing imaging data with postmortem histopathology, we determined the immunopathological underpinnings of altered BBB permeability as a function of lesion age. Similarly, we correlated pathological areas resembling putative areas of future lesion development in human MS with in vivo MRI findings.
Methods
EAE induction
Five adult common marmosets (Callithrix jacchus) (2.6–5 years old, mean age 4 years; 4 males) were used for EAE experiments. Data from healthy animals derive from the baseline studies of these animals. All marmosets were housed at NIH Intramural Research Program (PHS Assurance #A4149-01) facilities as previously described,17 in accordance with the standards of the American Association for Accreditation of Laboratory Animal Care and the NINDS’s Animal Care and Use Committee, which approved our experimental protocol. Marmosets were immunized with 0.2 mg of fresh-frozen human white matter homogenate (WMH) as previously described.17
Clinical evaluation
A scoring scale gauged the severity of clinical disease:18 0=no clinical signs, 0.5=apathy, altered walking pattern without ataxia, 1=lethargy, anorexia, weight loss, 2=ataxia, sensory loss, 2.25=monoparesis, 2.5=paraparesis, 3=paraplegia or hemiplegia, 4=quadriplegia, 5=spontaneous death due to EAE. Animals were assessed three times weekly by a trained observer and once weekly by a physician. The experiment was terminated, following local ethical guidelines, at disease score 3.
In vivo MRI measurements and contrast administration
Animal preparation for in vivo MRI experiments was conducted as previously described.17 In vivo imaging was performed in a 7T/30 cm Avance AVIII MRI scanner (Bruker BioSpin, Billerica, MA, USA) equipped with a 15 cm gradient set (Resonance Research, Billerica, MA, USA). A custom-built birdcage volume coil (inner diameter 10.2 cm) was used for radiofrequency (RF) excitation. MRI signal collection was performed using a custom-made 5-channel surface coil array anatomically conforming to the marmoset head. Animals were scanned at baseline, every other week after immunization, and weekly after discrete lesions were observed. All scans were acquired with data covering the whole brain.
We used, in the same session, data from four MRI sequences: 2D coronal “high-resolution” T1-weighted MDEFT (modified driven equilibrium Fourier transform; nominal in-plane resolution=0.15×0.15 mm; slice thickness [ST]=0.3 mm; inversion time [TI]=1200 ms; repetition time [TR]=10.5 ms; echo time [TE]=3.4 ms; flip angle [FA]=12 deg; acquisition time [AT]=25 min); 2D coronal proton density (PD)-weighted spin-echo (nominal in-plane resolution=0.15×0.15 mm; ST=0.6 mm; TR=1700 ms; TE=17 ms; FA=90 deg; AT=7 min); 2D coronal proton density T2-weighted RARE (rapid acquisition of refocused echoes; nominal in-plane resolution=0.15×0.15 mm; ST=0.6 mm; TR=1200 ms; TE=72 ms; FA=90 deg; AT=6 min; echo-train length [ETL]=8); and 2D coronal MDEFT (nominal in-plane resolution=0.6×0.6 mm; ST=0.6 mm; TR=4500 ms; FA=9 deg; AT=3.5 min) acquired three times with different TI (150, 1200, and 4000 ms), both before and 20 min after the administration of a bolus of gadopentetate (Bayer, Leverkusen, Germany). Each monkey received 0.3 mmol/kg gadopentetate over 3 min.
Ex vivo MRI measurements
At the conclusion of the experiment, animals were transcardially perfused with cold 4% paraformaldehyde (PFA), and the whole brain was removed and placed in 10% neutral buffered formalin. Brains were placed in a plastic tube filled with nonmagnetic oil (Fomblin; Solvay, Brussels, Belgium), and postmortem MRI was obtained in the same magnet using a 38-mm inner-diameter birdcage volume RF coil. For each animal, whole brain 3D T2*-weighted MGRE (multi gradient echo; nominal resolution=0.1 mm isotropic; TR=57 ms; shortest TE=3.6 ms; echo spacing=4 ms; number of echoes=10; FA=90 deg; AT=1.1 hour; number of excitations=8) and 2D T2-weighted RARE (nominal in-plane resolution=0.1 mm × 0.1 mm; ST=0.3 mm; TR=1200 ms; TE=12 ms; AT time=50 min; number of excitations=8) were acquired.
Image postprocessing
Data were analyzed using algorithms implemented in MIPAV (National Institutes of Health, Bethesda, MD, USA), JIST (nitrc.org/projects/jist), Matlab (The MathWorks, Natick, MA, USA) and FSL (FMRIB, Oxford, UK). At each time point, the high-resolution T1-MDEFT scan was rigidly registered to the baseline T1-MDEFT scan. Pre- and post-contrast T1 maps were obtained from the variable-TI 2D MDEFT images using an algorithm implemented in MIPAV.19 The TI=1200-ms 2D MDEFT image, which has T1 weighting, was affine-registered (FSL FLIRT) to the baseline-registered T1-MDEFT, and the transformation matrix was applied to the T1 map itself. We created maps of the contrast-induced change in the longitudinal relaxation map: &DeltaR1 = 1/T1post−1/T1pre.
For each animal, white matter regions of interest (ROI) were delineated manually on coronal slices from the baseline T1-MDEFT scan using MIPAV tools. Lesion detection was performed on the arithmetic average between PD and T2 scans (denoted as T2PD), since this image provided excellent lesion-to-white matter contrast. At each time point, lesion ROI were delineated manually on the unregistered T2PD and converted to a binary mask, yielding what we term a “time-varying lesion mask.” Then the transformation matrix used for the registration of the T2PD to the baseline T1-MDEFT scan was also applied to the time-varying lesion mask. We merged all time points’ time-varying lesion masks to obtain a “final lesion mask.” Subtracting the final lesion mask from the baseline white matter mask created a normal-appearing white matter (NAWM) mask. On the final lesion mask, each lesion was labeled with a unique, lesion-specific identification number. For each lesion i, we denoted tlesion,i=0 as the time of its first appearance on the in vivo T2PD.
Estimation of BBB permeability
Intravenous injection of low-molecular-weight contrast agents, such as gadopentetate, allows detection of areas of impaired BBB permeability, as such agents do not normally leak from vessels into the interstitial space. The passage of gadopentetate from vessels into the brain parenchyma changes the magnetic properties of the tissue itself, shortening its longitudinal relaxation time (T1). T1 mapping allows quantitative estimation of the T1 within each unit of brain tissue volume, termed a “voxel.” The average T1 within all voxels contained in a ROI can thus be estimated. In this study, T1 maps were acquired prior to (T1pre) and 20 min after (T1post) intravenous gadopentetate injection and were used to calculate the change in the longitudinal relaxation rate, ΔR1 = 1/T1post − 1/T1pre, an estimate of BBB permeability in lesion areas and NAWM.
In each voxel, ΔR1 is proportional to the concentration of the contrast agent in the corresponding area of white matter:20 ΔR1(t+)=r1C(t+), where t+ denotes the time since contrast injection (~20 min in our experiments) and r1 the relaxivity of gadopentetate at 7T (4.17 mM−1 sec−1). It is important to realize that intravoxel contrast agent may be found both at high concentration within blood vessels (which is normal) and in lower concentration within the extracellular space (abnormal). Thus, any increase in ΔR1 may be due either to permeability or to vascular enlargement. Although tracer kinetic modeling techniques are typically used to distinguish these possibilities, in our data such models were difficult to fit and the results hard to interpret. Nevertheless, the time course of ΔR1 changes within lesion areas reported in this paper, together with the results of simulations (not described here) that demonstrated that ΔR1 changes of the magnitude reported here would be difficult to explain on the basis of vascular enlargement, suggests that permeability changes are the most likely explanation for our findings.
Immunohistochemistry and histological staining
Brain tissues examined for this study were embedded in paraffin, sectioned at 5 μm, and stained using hematoxylin and eosin (H&E). To characterize the changes present by immunohistochemistry, immunoperoxidase staining for glial fibrillary acidic protein (GFAP), ionized calcium binding adapter molecule-1 (Iba1), calprotectin-monocyte L1 protein Ab-1 (MRP14; also known as MAC387), 2′,3′-cyclic nucleotide 3′-phosphodiesterase (CNPase), CD3, and CD20 were used. GFAP marks astrocytes. Iba1 is a calcium binding protein that is microglia/macrophage-specific21 and does not cross-react with neurons and astrocytes.22 MRP14/MAC387, also known as calprotectin, is a heterocomplex that is expressed on monocytes and macrophages that have recently infiltrated in early inflammation.23,24 CNPase is expressed in high levels by oligodendrocytes. CD3 is used as a pan-T cell marker, whereas CD20 is used to identify B cells. Special stains, including Bielschowski’s method for neurofibrils and Luxol fast blue (LFB) for myelin, were also performed.
Immunohistochemical staining for CD3 was performed using the automated Discovery Ultra platform system (Ventana Medical Systems, Tuscon, AZ, USA) employing antihuman CD3 primary antibody (Dako, Carpinteria, CA, USA; polyclonal) and biotinylated goat anti-rabbit secondary antibody (Vector Laboratories, Burlingame, CA, USA). For all other immunohistochemical stains, formalin-fixed, paraffin-embedded sections of brain and spinal cord were deparaffinized, rehydrated, and subsequently blocked with 3% hydrogen peroxide in phosphate buffered saline (PBS). Pretreatment for MRP14 was performed using Protease K for five minutes at room temperature. Iba1, CNPase, and CD20 pretreatment involved microwaving for 20 minutes in 0.01 citrate buffer, followed by 20 minutes of cooling. GFAP did not require pretreatment.
Following pretreatment, an avidin-biotin block (Invitrogen, Frederick, MD, USA) and then a Dako Protein block (10 min; Carpineria, CA, USA) were conducted on all sections. A wash of tris-buffered saline followed each step. Sections were incubated with anti-human GFAP (Thermo Scientific, Waltham, MA, USA; monoclonal; 1:1600; overnight at 4°C), CNPase Ab-1 (Neomarkers, Fremont, CA, USA; monoclonal; clone 11-5B; 1:200; one hour at room temperature), Calprotectin-Monocyte L1 Protein Ab-1/MRP14 (Lab Vision, Fremont, CA, USA; monoclonal; clone MAC387; 1:200; thirty min at room temperature), Iba1 (Wako Pure Chemical Industries, Osaka, Japan; polyclonal; 1:1000; thirty min at room temperature), and CD20 (monoclonal; 1:179; overnight at 4°C). Slides were then incubated with secondary antibody: biotinylated horse anti-mouse (Vector Laboratories; 1:200; 30 min at room temperature) for GFAP, CNPase, MRP14/MAC387, and CD20, and biotinylated goat anti-rabbit (Vector Laboratories; 1:200; 30 minutes at room temperature) for Iba1. This was followed by 30 min incubation at room temperature with Vectastain ABC Elite (Vector Laboratories) for GFAP, Iba1, CNPase, and MRP14/MAC387 and Vectastain ABC Standard (Vector Laboratories) for CD20. Antigen-antibody complex formation was detected using diaminobenzidine (Dako) and counterstained with Mayer’s hematoxylin. Irrelevant, isotype-matched primary antibodies were used in place of the test antibody as negative controls in all immunohistochemical studies. Positive control tissues consisted of rhesus macaque cerebrum (GFAP, CNPase), spleen (Iba1, MRP14/MAC387), and axillary lymph node (CD3, CD20).
Histopathological analysis was performed on the brains of the following animals: WMH2, WMH3, WMH4, and WMH5. A total of 2 brain regions (each brain region consisting of consecutive coronal sections of the same brain area) for WMH2, WMH4, and WMH5, and 1 for WMH3, were characterized with immunohistochemistry and special stains.
MRI-histopathology correlation
In order to achieve a correlation between MRI and histopathology, paraffin-embedded brain tissues were sectioned using a custom-built cutting box that yielded histopathological brain sections with a similar orientation to that adopted for MRI acquisition. H&E-stained sections were first visually matched with the ex vivo MRI images using anatomical landmarks (Figure 1). In vivo longitudinal T2PD images were then visually matched to the ex vivo MRI and H&E sections. The other special stains and immunohistochemistry sections had been serially cut with respect to the H&E sections and were thus naturally coregistered. The age (in weeks) of each lesion that was visible on postmortem sections was established by analyzing the time interval between its first appearance on in vivo T2PD and the day the experiment was terminated.
FIGURE 1.
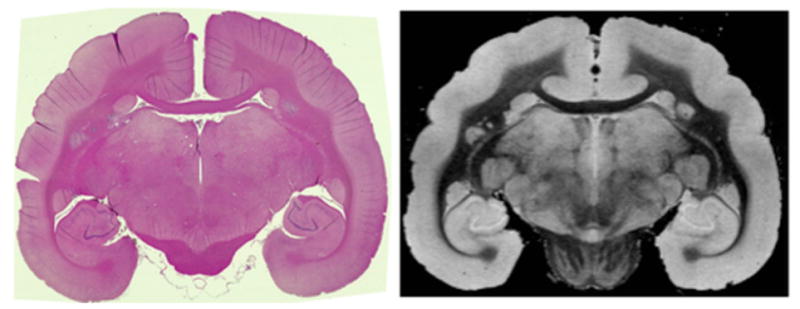
Matched hematoxylin and eosin (H&E) section (left) and ex-vivo T2* magnetic resonance imaging (MRI) slice (right) from WMH3.
Lesions
In this report, the term “lesion” is used to describe areas where demyelination is present. On T2PD MRI, those areas corresponded to abnormal, visually detectable, hyperintense signal in the cerebral white matter. Abnormalities without clear T2PD MRI correlates are denoted “foci,” a term that in this report subsumes alterations in permeability, which we denote “prelesional changes in ΔR1”, and their apparent histopathological correlates, which we denote “non-demyelinated inflammatory nodules.” In our animals, cortical lesions were rarely seen on MRI and not examined on pathology, despite prior reports of cortical lesions in marmoset EAE induced with a different antigen, recombinant human myelin oligodendrocyte glycoprotein.25–27 For lesions that traversed both white and gray matter, only the white matter portion was included in the present analysis.
Non-demyelinated inflammatory nodules
Foci not visible on in vivo T2PD MRI, but apparent on matched histological sections as collections of Iba1+ cells and variable numbers of perivascular lymphocytes, were classified as non-demyelinated inflammatory nodules. Corresponding ROI were drawn on the visually matched in vivo MRI and then applied longitudinally to the ΔR1 maps. For each inflammatory nodule, a control ROI (maintaining size and, to the extent possible, brain location) was placed in the NAWM.
Statistics
For the analysis of changes in lesion ΔR1 over time, we used repeated-measures ANOVA. The time from a lesion’s first appearance on MRI (tlesion,i) was considered as a categorical variable with heterogeneous compound symmetry as covariance structure. Animal number was considered as a random variable and lesion volume and lesion ΔR1 at baseline as covariates. The Tukey method was applied to pairwise comparison among time points. To evaluate ΔR1 changes within the NAWM over time, we used a random coefficient model with time treated as continuous. For the combined analysis of ΔR1 in inflammatory nodules, lesions (only those belonging to animals having inflammatory nodules), and control areas (NAWM), a random coefficient model was applied, including group (inflammatory nodule vs. lesion vs. NAWM), weeks from a lesion’s first appearance on MRI (tlesion,i), and their interaction. In addition, repeated-measures ANOVA was used to estimate ΔR1 mean and standard error at each time point, with time considered as a categorical variable. For this analysis, we assumed that the last week before the end of the experiment coincided with tlesion=−1 for the inflammatory nodules. SAS procedure MIXED was used for the above analyses. p=0.01 was used as significance level in order to adjust for multiple tests.
For all of the above analyses, in order to reduce the impact of partial volume averaging on our results, ROI with size<10 pixels (0.06 mm3) were excluded, as were lesions directly bordering the ventricles and/or large cerebral veins. Vicinity to the ventricles might also impair lesion identification due to the high MRI signal of cerebrospinal fluid. Vicinity to larger cerebral veins might affect lesion ΔR1 due to the presence of intravascular contrast agent.
Results
All animals developed clinical and radiological disease
EAE was induced in 5 outbred common marmosets (Callithrix jacchus) with human white matter homogenate (WMH) and complete Freund’s adjuvant (CFA).17 All immunized animals developed EAE. Clinical and radiological characteristics of the disease are summarized in Table 1. The time interval between immunization and the appearance of the first cerebral white matter lesion on MRI varied considerably, ranging from 2–16 (mean 7) weeks. In 4 animals (WMH1, WMH2, WMH4 and WMH5), the appearance of the first lesion preceded the onset of clinical symptoms; in WMH3, the two events occurred at the same time.
Table 1.
Clinical and radiological disease characteristics in marmosets with experimental autoimmune encephalomyelitis induced by injection of human white matter homogenate (WMH). Time to lesion development (as assessed by repeated magnetic resonance imaging, MRI), time to onset of clinical symptoms, time to 10% body weight loss, and time to perfusion are expressed in weeks. Time to onset of clinical symptoms is the time between immunization and a clinical score ≥2, indicating ataxia, visual dysfunction, weakness, and/or sensory loss. The total white matter lesion volume at the time of the final scan (“terminal MRI”) and the cumulative number of MRI-visible brain white matter lesions are also reported.
| Animal | Age (years) | Sex | Time to lesion development (weeks) | Time to onset of clinical symptoms (weeks) | Time to 10% weight loss (weeks) | Total lesion volume at terminal MRI (mm3) | Total number of MRI visible lesions | Experiment duration (weeks) |
|---|---|---|---|---|---|---|---|---|
| WMH1 | 4.5 | M | 2 | 4 | 3 | 78.8 | 351 | 7 |
| WMH2 | 2.6 | M | 8 | 11 | 9 | 19.2 | 38 | 28 |
| WMH3 | 3.3 | F | 16 | 16 | 19 | 14.5 | 6 | 19 |
| WMH4 | 4.5 | M | 2 | 7 | 7 | 39.0 | 42 | 7 |
| WMH5 | 5.0 | M | 7 | 9 | 6 | 2.8 | 21 | 9 |
Lesion development was an ongoing process once it started. For each animal, the total lesion volume per week is summarized in Figure 2, which demonstrates heterogeneity in the time of incidence and rate of progression of MRI-defined brain lesions in marmoset EAE. WMH1 developed minor clinical signs (visual impairment and sensory loss), and in vivo brain MRI demonstrated 351 small, disseminated lesions. WMH2 developed mild clinical signs suggestive of sensory dysfunction 11 weeks after immunization, which completely resolved. It then presented acute paraplegia 28 weeks after immunization, leading to termination of the experiment. MRI showed 38 medium-sized white matter lesions. WMH3 developed monoparesis of a lower limb 16 weeks after immunization. The experiment was terminated 3 weeks later due to a respiratory complication related to anesthesia. MRI showed 6 medium-to-large white matter lesions. WMH4 did not show clinical symptoms until 7 weeks after immunization, when the experiment was terminated due to acute hemiplegia. Radiologically, this animal presented 42 medium-sized white matter lesions. WMH5 showed recurrent intentional tremor at week 5, which completely resolved within 1 week. The experiment was terminated 9 weeks after immunization due to severe weight loss. In vivo brain MRI showed 21 medium-large white matter lesions.
FIGURE 2.
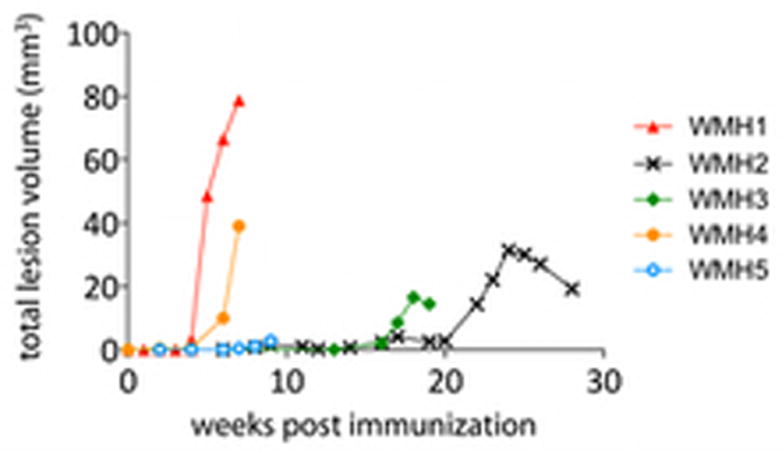
Cumulative volume of brain white matter lesions over time in marmoset experimental autoimmune encephalomyelitis induced with human white matter homogenate (WMH).
Blood-brain barrier permeability changes preceding lesion appearance on MRI
In all animals, brain MRI was performed every 2 weeks after immunization and weekly after the first white matter lesion appeared on the T2PD scan. Figure 3A shows the time course prelesional changes in ΔR1 (our measure of BBB permeability); tlesion=0 denotes the time of lesion appearance on T2PD in all 189 white matter lesions. These data demonstrate that ΔR1 is roughly stable prior to 4 weeks before lesion appearance. The statistical analysis focused on changes occurring between 6 weeks before lesion appearance and the time of lesion appearance (Figure 3B). There were no week-to-week changes in ΔR1 prior to week -4. However, ΔR1 increased between weeks -4 and -3 (p<0.0001), weeks -3 and -1 (p<0.005), and weeks -1 and 0 (p<0.0001). By contrast, considering both pre- and post-immunization time points, ΔR1 in NAWM did not change over time (p=0.77). These results suggest increasing local BBB permeability in areas of future lesion development.
FIGURE 3.

Focal blood-brain barrier permeability, estimated as the change in longitudinal relaxation rate following intravenous administration of gadolinium-based contrast dye (ΔR1), increases before the appearance of brain white matter lesions on magnetic resonance imaging. (A) Normal appearing (extralesional) white mater (blue) and lesion (red) permeability changes over time across all marmosets with experimental autoimmune encephalomyelitis. tlesion=0 denotes the time of lesion appearance on imaging, measured in weeks. Lesion ΔR1 remains stable prior to 4 weeks before lesion appearance (tlesion=−4). After tlesion=−4, ΔR1 increases in lesion areas, peaking at the time of lesion appearance (tlesion=0), and decreases over the 4 weeks thereafter. Permeability in the normal appearing white matter is stable over time (p=0.77). (B) Average changes to within-lesion-area permeability over time (*, p<0.001; **, p<0.0001). Error bars represent standard errors of the mean.
Non-demyelinated inflammatory nodules and focal blood-brain-barrier permeability changes
In 3 animals, histopathological analysis of brain sections showed small inflammatory foci that were not visible, or barely visible, on in vivo T2PD, including the scan performed just before termination of the experiment (“terminal MRI”) (Figure 4A). These areas appeared as small clusters of perivascular and parenchymal Iba1+ activated microglia and macrophages21 associated with variable numbers of perivascular lymphocytes but no demyelination. Such clusters were denoted “non-demyelinated inflammatory nodules” (Figure 4B). For each inflammatory nodule, distance from the closest MRI-visible lesion, total number of blood-derived MRP14+ early activated macrophages present in the nodule area, and presence/absence of focal abnormal signal on high resolution ex vivo MRI (100-μm isotropic resolution) are presented in Table 2. Staining of myelin with LFB showed no demyelination in any of the 9 inflammatory nodules we analyzed.28 MRP14+ macrophages were completely absent in 4 of the 9 nodules (44%); in the others, there were very few (range: 1 to 5) in the perivascular space and/or parenchyma. T cells were present within the perivascular space and rarely in the parenchyma. GFAP-expressing reactive astrocytes enveloped vessels, and their thickened processes extended into the adjacent parenchyma, suggesting endothelial activation29 and response to injury. To determine whether these inflammatory nodules represented the histopathological correlate of the prelesional ΔR1 changes detected by MRI, ROI were placed in the corresponding location on in vivo scans. ΔR1 was recorded at the final time point and during each of the 4 previous weeks. For comparison, corresponding ROI were placed in the NAWM, maintaining size and, to the extent possible, brain location.
FIGURE 4.
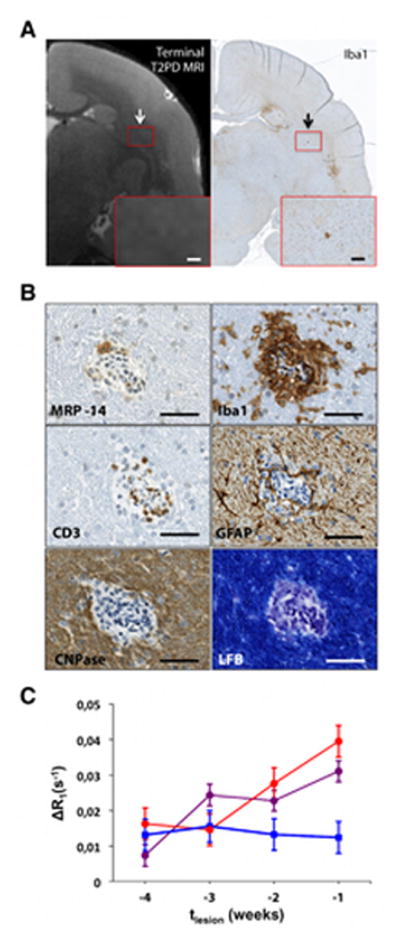
Non-demyelinated inflammatory nodules are associated with increasing blood-brain-barrier permeability over time. (A) Matched T2PD terminal magnetic resonance imaging (MRI) scan and Iba1 coronal section of the brain (WMH4). The representative inflammatory nodule appears as a small cluster of Iba1+ cells (black arrow) that is not visible, or barely visible, on the matched in vivo MRI (white arrow). Magnified views, red boxes. Scale bars: 300 μm. (B) Histological characterization of the inflammatory nodule shown in A. Only 1 MRP14+ blood-derived early activated macrophage (with MRP14 reaction measured as moderate) is present within the perivascular space, but not within the parenchyma. Iba1+ activated microglia and macrophages are present in the perivascular space and parenchyma. GFAP+ astrocytes are present within the parenchyma and in contact with the central vessel. CD3+ lymphocytes (T cells) are located at the edge of the vessel wall and in the perivascular space but do not extend into the parenchyma. CD20+ cells were detected in the perivascular space (not shown). CNPase (an oligodendrocyte marker) is normally expressed, and luxol fast blue (LFB), which stains myelin in blue, shows no demyelination. Scale bars: 50 μm. (C) Non-demyelinated inflammatory nodules (red), lesions (purple), and normal appearing white matter (blue) permeability, estimated as ΔR1. For lesions, ΔR1 is shown over the 4 weeks prior to lesion appearance on T2PD MRI. For the inflammatory nodules, we assumed that the week the experiment was terminated coincided with the week preceding lesion appearance. There was no difference between slopes of the permeability curves for inflammatory nodules and lesions (p=0.39); however, unlike normal appearing white matter, permeability within inflammatory nodules and lesions was significantly >0 (p<0.001). Error bars represent standard error of the mean.
Table 2.
Non-demyelinated inflammatory nodules detected on histopathology. All distance measurements were performed on the Iba1-stained sections, which identify microglia and macrophages. MRP14 staining, identifying blood-derived early activated macrophages, was measured as weak (+), moderate (++), or strong (+++). The rightmost column reports whether the lesion was visible (+) or not (−) on the high-resolution ex vivo magnetic resonance imaging (MRI).
| Animal | Nodule | Nodule diameter (μm) | Distance from closest MRI visible lesion (μm) | Number of perivascular MRP14 (degree of staining) | Number of parenchymal MRP14 (degree of staining) | Visible on ex vivo MRI |
|---|---|---|---|---|---|---|
| WMH3 | 1 | 206 | 4741 | 3 (++) | + | |
| 2 | 227 | 651 | − | − | − | |
|
| ||||||
| WMH4 | 1 | 181 | 1019 | 1 (+) | − | − |
| 2 | 131 | 940 | 1 (+) | 2 (+) | − | |
| 3 | 145 | 1942 | 1 (++); 4 (+) | − | + | |
|
| ||||||
| WMH5 | 1 | 115 | 2515 | − | − | − |
| 2 | 225 | 1830 | − | − | − | |
| 3 | 148 | 7080 | 2 (+++) | − | − | |
| 4 | 103 | 497 | − | − | − | |
ΔR1 increased within inflammatory nodules over the 4 weeks prior to experiment termination, as shown in Figure 4C. As this pattern was similar to that observed prior to formation of MRI-visible lesions, the slopes of the rise in ΔR1 were compared, treating the final time point for inflammatory nodules as 1 week prior to lesion appearance on T2PD (i.e., tlesion=−1). The slope, expressed in s−1/week, was nonzero for both inflammatory nodules and lesions: 0.0083 for inflammatory nodules (p=0.006) and 0.0062 for lesions (p<0.0001). There was no difference between inflammatory-nodule and lesion slopes (p=0.39), and there was no trend in NAWM (p=0.58). This suggests that ΔR1 within the inflammatory nodules during the 4 weeks before experiment termination behaves very similarly to ΔR1 in areas that eventually become focal demyelinated lesions.
Lesion histopathology and BBB permeability as a function of lesion age
In MS, the histopathological features and pattern of BBB permeability change considerably during the lifetime of a lesion.22,30 We determined how lesion histopathology and BBB permeability evolved after lesion appearance on T2PD. For 31 analyzed lesions in 4 animals, lesion age was defined as the interval between the time of the lesion’s first appearance on T2PD and experiment termination. Lesions present on histopathology were classified as acute if younger than 1 week (n=5), subacute if between 1 and 5 weeks (n=14), and late-subacute if between 5 and 9 weeks (n=12) (Table 3).
Table 3.
Number of histopathologically detected lesions classified as acute, subacute, and late-subacute.
| Acute (<1 week) | Sub-acute (1–5 weeks) | Late-subacute (5–9 weeks) | Total | |
|---|---|---|---|---|
| WMH2 | 1 | 2 | 9 | 12 |
| WMH3 | 1 | 2 | - | 3 |
| WMH4 | 2 | 8 | - | 10 |
| WMH5 | 1 | 2 | 3 | 6 |
|
| ||||
| Total | 5 | 14 | 12 | 31 |
Acute lesions
Acute lesions (<1 week old) corresponded to areas of discrete hyperintensity on T2PD MRI (Figure 5). BBB permeability within the lesion was maximal at this stage of lesion formation (tlesion=0; see Figure 3B). On histopathology, acute lesions surrounded a central inflamed blood vessel. CD3+ lymphocytes (T cells) and Iba1+ activated microglia and macrophages composed the perivascular cuff. CD20+ lymphocytes (B cells) and blood-derived MRP14+ early activated macrophages were also observed perivascularly, although less frequently. The parenchyma adjacent to the central vessel contained a large number of Iba1+ and MRP14+ cells. Many of the MRP14+ cells demonstrated ameboid morphology, consistent with an activated phenotype.23 Parenchymal T and B cells were rare. Astrocytes with high GFAP expression, cytoplasmic enlargement, and thick, prominent processes, all of which suggest activation, were found throughout the lesion parenchyma, particularly adjacent to vessels. Loss of LFB staining throughout the lesion indicated demyelination. Reduced CNPase expression paralleled the decreased LFB staining, suggesting reduced oligodendrocyte density (Fig 4B, D).31 Bielschowski’s silver stain showed that axons are disrupted and separated by inflammatory cells, unlike axons outside lesions (Fig 4B, D). These histopathological features were present in all acute lesions and indicate that, within lesions, demyelination begins near the perivascular cuff. All demyelinated lesions observed on tissue sections were visible on in vivo T2PD MRI.
FIGURE 5.

Representative magnetic resonance imaging (MRI) and histopathological features of acute lesions. (A, C) Acute lesions, visible on the hematoxylin and eosin section (blue arrow), were first seen on the terminal MRI (red arrow), performed on the day the experiment ended. The time of lesion appearance on MRI is denoted tlesion=0 and is measured in weeks, and these two lesions therefore appeared at most 1 week prior to the end of the experiment (lesion age <1 week). Magnified views (red boxes). Scale bars, 300 μm. (B, D) Histopathological features of the acute lesions shown in A and C, respectively. Blood-derived MRP14+ early activated macrophages are present in the parenchyma but rarely within the perivascular space of the central blood vessel. Iba1+ activated microglia and macrophages are present in both parenchyma and perivascular space. GFAP+ astrocytes are found in contact with the central vessel B and throughout the lesion D. CD3+ lymphocytes (T cells) are located in the perivascular space of the central vessel and sparingly in the adjacent parenchyma. CD20+ lymphocytes (B cells) are located in the perivascular space of the central vessel and also in the parenchyma. CNPase+ oligodendrocytes are diminished in the lesion parenchyma relative to surrounding white matter. LFB stains myelin in blue and demonstrates that the lesions are demyelinated. Bielschowski’s stain (Biels) shows axons that are disrupted and separated by inflammatory cells (red arrows) unlike the tightly apposed axons in the adjacent parenchyma (white arrows). Magnified views (white boxes). Scale bars, 100 μm. Animals: WMH4 (A, B); WMH3 (C, D).
Subacute lesions
MRI-dated lesions between 1 and 5 weeks old were classified as subacute. These appeared on T2PD as discrete areas of abnormal hyperintensity. The size of these lesions typically increased over time on longitudinal MRI (Figure 6). Sometimes a central vessel, appearing as a linear hypointensity on T2PD, was visible in the center of the lesion. Between 1 and 2 weeks after lesion appearance, BBB permeability was significantly lower than in acute lesions <1 week old. Between 2 and 4 weeks after lesion appearance, however, there were no significant permeability changes (Figure 3B).
FIGURE 6.

Representative magnetic resonance imaging (MRI) and histopathological features of subacute lesions. (A, C) The lesion (red arrows) is not visible on the pre-immunization baseline scan (black arrows). The time of lesion appearance on MRI is denoted tlesion=0 and is measured in weeks. At the end of the experiment (“Terminal T2PD MRI”), the lesion in A was 1–3 weeks old and the lesion in C, 3–5 weeks old. Both lesions enlarged in the weeks after they appeared. A blood vessel within the center of the lesion in A appears dark on MRI. The lesions are denoted by blue arrows on the hematoxylin and eosin (H&E) sections. Magnified views (red boxes). Scale bars, 300 μm. (B, D) Histopathological features of the subacute lesions shown in A and C, respectively. Blood-derived MRP14+ early activated macrophages are present at the lesion edge. Iba1+ activated microglia and macrophages are found throughout the lesion, without a clear distinction between center and periphery. Activated GFAP+ astrocytes are found within the lesion parenchyma and particularly in contact with blood vessels. CD3+ lymphocytes (T cells) are present in perivascular spaces and scattered throughout the lesion area. CD20+ lymphocytes (B cells) are only rarely present in parenchyma and perivascular spaces. CNPase+ oligodendrocytes are reduced in the lesion parenchyma. Luxol fast blue (LFB), which stains myelin blue, shows complete myelin loss at the center and milder demyelination at the lesion margins. Bielschowski’s stain (Biels) shows that normal axonal orientation and distribution is disrupted by infiltrating inflammatory cells with regions of complete axonal loss and fragmentation. Magnified views (white boxes). Dark lines and arcs in various histopathological sections are folding artifacts. Scale bars, 200 μm B and 300 μm D. WMH4 (A, B) ; WMH3 (C, D).
In subacute lesions, especially those 3–5 weeks old, there was marked demyelination at the center and slightly less demyelination at the margin. Similarly, CNPase expression in oligodendrocytes was reduced at the lesion center relative to the margin. Blood-derived MRP14+ early activated macrophages were distributed predominantly at the lesion edge. Iba1+ activated microglia and macrophages were prominent within both parenchyma and perivascular spaces and were typically distributed throughout the entire lesion area, without clear distinction between center and periphery. Perivascular and parenchymal infiltrates of lymphocytes, most commonly CD3+ T cells, were scattered throughout the plaque. Astrocytes, important components of the BBB, showed increased expression of GFAP and thickened processes, suggesting activation, around vasculature and throughout the lesion parenchyma. The Bielschowski stain showed that axons were disrupted and separated by inflammatory cells, unlike axons in the surrounding parenchyma, and also highlighted the presence of clear spaces (spongiosis) within the lesion and surrounding parenchyma (evidence of myelin loss) (Figures 6B, D).
Late-subacute lesions
Late subacute lesions appeared on T2PD as small foci of residual hyperintensity. These lesions were typically shrinking over time on serial MRI, following a peak usually reached 1–3 weeks following lesion appearance (Figure 7). All sampled late subacute lesions came from animals WMH2 and WMH5 and showed demyelination on LFB (Figure 7B). Myelin at the lesion borders was pale, a pattern that in MS has been correlated with remyelination (“shadow plaques”) (Figure 7D). CNPase expression was markedly reduced in the central lesion area, where LFB depicted myelin loss, but close to normal in areas that appeared pale on LFB. Blood-derived MRP14+ early activated macrophages were completely absent in 11 of the 12 late-subacute lesions (92%), but one lesion featured a few perivascular and parenchymal MRP14+ cells (<10 cells in total). In some of the younger late subacute lesions, Iba1+ activated microglia and macrophages were present perivascularly and in the parenchyma, but in older lesions they were more rare. A few CD3+ T cells and CD20+ B cells were still present, mostly perivascularly. Moderate numbers of GFAP+ astrocytes were seen in the immediate perivascular area. Axons were mildly disrupted by the presence of inflammatory cells (Figure 7B, D).
FIGURE 7.

Representative magnetic resonance imaging (MRI) and histopathological features of late-subacute lesions (animal WMH2). (A, C) Lesions (red arrows) are not visible on the pre-immunization baseline scans (black arrows) but appeared more than 5 weeks before the end of the experiment. The lesion in A was between 6 and 8 weeks old, and the lesion in B between 5 and 6 weeks old. Lesion size peaked in the weeks following lesion appearance but gradually diminished thereafter. Magnified views (red boxes). Scale bars, 300 μm. (B) Histopathological features of the late-subacute lesion shown in A. Blood-derived MRP14+ early activated macrophages are no longer seen. Iba1+ activated microglia and macrophages remain perivascularly and in the parenchyma close to the central vessel. Astrocytes show moderate GFAP expression. CD3+ (T cells) and CD20+ (B cells) lymphocytes are still present, although rare, in the parenchyma and perivascular spaces. CNPase+ oligodendrocytes are almost normal, except in the area immediately surrounding the central blood vessel. Luxol fast blue (LFB), which stains myelin blue, shows pale myelin in the residual lesion area close to the central blood vessel, suggesting remyelination. Axons are mildly disrupted by inflammatory cell infiltrate with evidence of dissolution in comparison with surrounding, closely packed axons. Magnified view (white box). Scale bars 100 μm. (D) Histopathological features of the late-subacute lesion shown in C. Luxol fast blue (LFB) shows absent myelin in the center of the lesion and pale myelin at the lesion margins. CNPase expression is reduced at the lesion center but still partially present at the periphery. Iba1+ activated microglia and macrophages are rarely present in the lesion area, but MRP14+ macrophages are absent. CD3+ lymphocytes (T cells) line the vessel wall and persist throughout the lesion and in the perivascular spaces. Scale bars, 100 μm.
Discussion
The major new finding in this study is that the BBB becomes focally and increasingly permeable starting up to one month before the appearance of new inflammatory, demyelinating lesions in a primate model that recapitulates immunopathogenic mechanisms of tissue damage in relapsing-remitting MS. These permeability changes correspond histopathologically to non-demyelinated inflammatory nodules comprising perivascular inflammation and microglial activation without associated visible abnormalities on MRI. MRI-visible lesions, on the other hand, all featured clear demyelination. Myelin removal appears to require the influx of MRP14+ early activated macrophages from the blood, highlighting the importance of the innate immune system in this process. However, our data also suggest a key role for adaptive immunity during the earliest stages of lesion formation, as evidenced by the presence of lymphocytes in the perivascular cuff. The sequence of events described in our data, and the relative localization of the different cell populations at different time points, together suggest that local inflammation and, in our view, myelin damage, seem most likely to result from the release of soluble, inflammatory, cytotoxic factors as part of antigen-specific immune responses within the perivascular cuff. Accordingly, lymphocytes appear to be absent from the parenchyma prior to the onset of demyelination.
The histopathological architecture of the non-demyelinated inflammatory nodules closely resembles foci described in MS tissue samples,32 which have been termed “pre-phagocytic” or “pre-demyelinating.”13,33 Since the MS tissue samples derive from autopsies, however, they cannot be definitively demonstrated to be the forerunners of focal lesions. On the other hand, in our marmoset EAE experiments, weekly MRI scans allowed us to chart the time course of BBB permeability changes within the inflammatory nodules as well as in areas that eventually evolved into demyelinated lesions, as seen both in vivo (MRI) and postmortem. The similar time courses (indistinguishable rates of increase) and absent BBB opening in corresponding areas of NAWM bolster our contention that inflammatory nodules are in fact the forerunners of full-fledged demyelination. The data suggest, consistent with some prior descriptions,34 that demyelination is not the earliest event in the development of a plaque. On the other hand, microglial activation is prominent, as evidenced here by the presence of parenchymal cells that are Iba1+ but not MRP14+.
Marmoset EAE lesions classified as “acute” in this study closely resembled “phagocytic areas” described in MS histopathology studies.13 Their appearance on MRI coincides with markedly elevated BBB permeability, detected as increased ΔR1, which on conventional MRI scans would correspond to visible contrast enhancement – a prevalent finding in new MS lesions.9 Evaluation of these acute lesions showed that blood-derived MRP14+ early activated macrophage infiltration is a good marker of the leading edge of demyelination, whereas Iba1, which is expressed in activated and resting microglia as well as macrophages,22,35 is more diffusely distributed. MRP14 is a calcium binding protein that is found in neutrophils, blood monocytes, and early activated infiltrating macrophages,23,36 though it is unclear whether this protein can also be expressed, under certain conditions, in CNS-resident microglia.37 Based on previous literature on MS lesions, in which MRP14 expression has been associated with the earliest stages of macrophage-mediated demyelination,13,23,33,37,38 we speculate that in the acute and subacute lesions observed here, MRP14+ cells were newly recruited, blood-derived monocytes and macrophages that were infiltrating the lesion parenchyma. Indeed, the radial spread of these cells mirrors the centrifugal spread of intravenously injected contrast in the newest MS lesions.30,39,40
Subacute lesions – 1–5 weeks old at the time of postmortem examination – continued to enlarge over time even as BBB permeability decreased. Considering that BBB permeability was measured in the central area of the lesion (an area corresponding to the lesion size in its acute stage), this finding is consistent with recent data in newly forming MS lesions, where the locus of BBB opening moves outward with time from the central blood vessel to the periphery of the expanding plaque.30 In subacute EAE lesions, active demyelination was only present at the lesion edge, having completed in the lesion center around the central vessel. Blood-derived MRP14+ early activated macrophages were found at the leading edge of demyelination, whereas Iba1+ cells (at this stage presumably a combination of microglia and macrophages) were diffusely distributed. On the other hand, in late-subacute lesions >5 weeks old, inflammation was markedly reduced. Demyelination and its attendant MRP14+ infiltration were absent, and there was some evidence of pale myelin staining with LFB, which could reflect nascent remyelination. Late-subacute lesions generally became smaller over time, a finding that is consistent with an overall reduction of inflammation in older lesions, as has been described in MS.22
The data presented here, in conjunction with literature reports from previous studies, allow us to construct a model of white matter lesion formation in marmoset EAE, which is also consistent with what is known about this process in MS (Figure 8). Based on our imaging and histopathological data, we believe that the non-demyelinated inflammatory nodules are the earliest cellular manifestation of lesion formation. These nodules are perivascular collections of lymphocytes and Iba1+ perivascular macrophages, together with parenchymal microglia, reactive astrocytes, normal myelin. This finding is consistent with the migration of peripherally primed, myelin-reactive T cells into the perivascular space either from the cerebrospinal fluid compartment,41 perhaps via the choroid plexus,42 or directly across the endothelium.43 In the perivascular space, these T cells encounter myelin antigens that reach this space and are presented by perivascular macrophages.44,45 Activation of these T cells following antigen presentation leads to secretion of cytokines and chemokines,33 which in turn activate both vascular endothelium and resident microglia,46 in agreement with previous findings in pre-phagocytic/pre-demyelinating lesions in MS.15 The MRI correlate of these processes is increased permeability to injected contrast material, corresponding to subtle opening of the endothelial side of the BBB. Within a few weeks, the parenchymal side of the BBB (also known as the glia limitans) is breached, and demyelination commences. Blood-derived MRP14+ macrophages arrive to strip the damaged, perhaps complement-coated, myelin.33,46 At this stage, Iba1+ microglia within the lesion may have multiple roles, including possibly repair.35 After a period lasting almost 5 weeks, the inflammatory activity of the lesion decreases, MRP14+ cells disappear, and remyelination commences.
FIGURE 8.
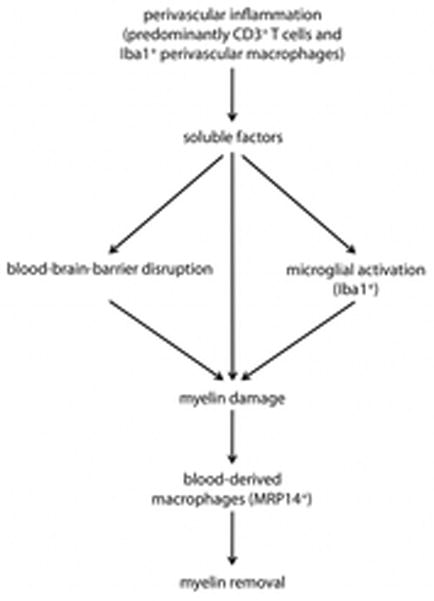
Model of lesion formation in marmoset experimental autoimmune encephalomyelitis. Peripherally primed myelin-reactive T cells (CD3+ T cells) pass into the perivascular space and recognize myelin antigens on the surface of antigen-presenting cells (e.g., Iba1+ perivascular macrophages). Activation of these T cells following antigen presentation then activates both the vascular endothelium (leading to subtle blood-brain-barrier opening) and resident microglia (Iba1+ microglial activation) by secreting soluble factors (cytokines and chemokines). These inflammatory factors enter the parenchyma, initiating tissue damage (including myelin damage) and activating resident microglia. Within a few weeks, the parenchymal side of the blood-brain barrier (the glia limitans) is breached, and early activated macrophages (blood-derived MRP14+ cells) infiltrate the parenchyma to remove myelin.
Although this model is consistent with data from our serial MRI scans and postmortem histopathology, we did not perform an exhaustive cellular, molecular, and biochemical analysis of the specific mechanisms by which tissue damage (demyelination and axonal loss) develops from inflammatory nodules. Future studies along these lines would benefit from a histological marker of oligodendrocyte apoptosis suitable for marmoset tissues. Such studies could also examine the effects of selective blockade of blood-derived macrophage infiltration, providing further insight into the extent to which those cells are required for demyelination to occur.
Finally, thanks to the strong immunological and histopathological similarities between the marmoset EAE model and the human disease, we believe that our findings may have important translational value with respect to MS. Indeed, the precise sequencing of tissue changes enabled by the imaging-pathology correlations reported here may improve the targeting of new therapies that address various stages of the process and may help to elucidate their mechanisms of action.
Acknowledgments
The authors wish to thank Cornell University for performing the Bielschowski and Luxol fast blue stains and Elizabeth Curran for assisting with tissue preparation; Abhik Ray-Chaudhury, Marsha Merrill, and Nancy Edwards, who helped in histopathology interpretation; Justin Senseney, who implemented the algorithm in MIPAV for T1 map reconstruction; John Ostuni, Colin Shea, and Govind Nair for image post processing and registration; Junjie Liu, who developed the T1 mapping method; Pascal Sati, who helped with MRI sequence design and implementation; Elisabeth Sweeney, who helped with hemodynamic simulations performed on dynamic contrast enhanced (DCE) MRI; Kelsey Motanic, who prepared the animals before MRI experiments and helped in clinical evaluation of the animals; Xianfeng (Lisa) Zhang, who provided assistance during in vivo MRI and euthanasia (perfusion); Matthew McCormick, for animal assistance during blood collection; and Lucinda Prevost, Sam Antonio, and James O’Malley in the NIH animal facility for marmoset care and project support.
Funding
This research was supported by the Intramural Research Program of NINDS.
Footnotes
Author contributions
- Conceived and designed the experiments: PM MIG DSR ACS SJ
- Performed the experiments: PM SMCM MIG EL PS JEW ACS
- Analyzed the data: PM SMCM MIG TW ACS SW
- Wrote the manuscript: PM SMCM LM DSR
Competing interests
The authors report no relevant conflicts of interest.
References
- 1.Lassmann H, Brück W, Lucchinetti CF. The immunopathology of multiple sclerosis: an overview. Brain Pathol. 2007;17(2):210–218. doi: 10.1111/j.1750-3639.2007.00064.x. [DOI] [PMC free article] [PubMed] [Google Scholar]
- 2.Filippi M, Rocca MA, Martino G, et al. Magnetization transfer changes in the normal appearing white matter precede the appearance of enhancing lesions in patients with multiple sclerosis. Annals of Neurology. 1998;43(6):809–814. doi: 10.1002/ana.410430616. [DOI] [PubMed] [Google Scholar]
- 3.Fazekas F, Ropele S, Enzinger C. Quantitative magnetization transfer imaging of pre-lesional white-matter changes in multiple sclerosis. Mult Scler. 2002;8(6):479–484. doi: 10.1191/1352458502ms860oa. [DOI] [PubMed] [Google Scholar]
- 4.Goodkin DE, Rooney WD, Sloan R, et al. A serial study of new MS lesions and the white matter from which they arise. Neurology. 1998;51(6):1689–1697. doi: 10.1212/wnl.51.6.1689. [DOI] [PubMed] [Google Scholar]
- 5.Laule C, Vavasour IM, Whittall KP, et al. Evolution of focal and diffuse magnetisation transfer abnormalities in multiple sclerosis. J Neurol. 2003;250(8):924–931. doi: 10.1007/s00415-003-1115-z. [DOI] [PubMed] [Google Scholar]
- 6.Wuerfel J. Changes in cerebral perfusion precede plaque formation in multiple sclerosis: a longitudinal perfusion MRI study. Brain. 2004;127(1):111–119. doi: 10.1093/brain/awh007. [DOI] [PubMed] [Google Scholar]
- 7.Werring DJ, Brassat D, Droogan AG, et al. The pathogenesis of lesions and normal-appearing white matter changes in multiple sclerosis: a serial diffusion MRI study. Brain. 2000;123( Pt 8):1667–1676. doi: 10.1093/brain/123.8.1667. [DOI] [PubMed] [Google Scholar]
- 8.Wiggermann V, Hernández Torres E, Vavasour IM, et al. Magnetic resonance frequency shifts during acute MS lesion formation. Neurology. 2013;81(3):211–218. doi: 10.1212/WNL.0b013e31829bfd63. [DOI] [PMC free article] [PubMed] [Google Scholar]
- 9.Katz D, Taubenberger JK, Cannella B, et al. Correlation between magnetic resonance imaging findings and lesion development in chronic, active multiple sclerosis. Annals of Neurology. 1993;34(5):661–669. doi: 10.1002/ana.410340507. [DOI] [PubMed] [Google Scholar]
- 10.Grossman RI, Gonzalez-Scarano F, Atlas SW, et al. Multiple sclerosis: gadolinium enhancement in MR imaging. Radiology. 1986;161(3):721–725. doi: 10.1148/radiology.161.3.3786722. [DOI] [PubMed] [Google Scholar]
- 11.De Groot CJ, Bergers E, Kamphorst W, et al. Post-mortem MRI-guided sampling of multiple sclerosis brain lesions: increased yield of active demyelinating and (p)reactive lesions. Brain. 2001;124(Pt 8):1635–1645. doi: 10.1093/brain/124.8.1635. [DOI] [PubMed] [Google Scholar]
- 12.van Horssen J, Singh S, van der Pol S, et al. Clusters of activated microglia in normal-appearing white matter show signs of innate immune activation. Journal of Neuroinflammation. 2012;9:156. doi: 10.1186/1742-2094-9-156. [DOI] [PMC free article] [PubMed] [Google Scholar]
- 13.Henderson APD, Barnett MH, Parratt JDE, Prineas JW. Multiple sclerosis: distribution of inflammatory cells in newly forming lesions. Annals of Neurology. 2009;66(6):739–753. doi: 10.1002/ana.21800. [DOI] [PubMed] [Google Scholar]
- 14.Davalos D, Ryu JK, Merlini M, et al. Fibrinogen-induced perivascular microglial clustering is required for the development of axonal damage in neuroinflammation. Nat Commun. 2012;3:1227. doi: 10.1038/ncomms2230. [DOI] [PMC free article] [PubMed] [Google Scholar]
- 15.Marik C, Felts PA, Bauer J, et al. Lesion genesis in a subset of patients with multiple sclerosis: a role for innate immunity? Brain. 2007;130(Pt 11):2800–2815. doi: 10.1093/brain/awm236. [DOI] [PMC free article] [PubMed] [Google Scholar]
- 16.t Hart BA, Massacesi L. Clinical, pathological, and immunologic aspects of the multiple sclerosis model in common marmosets (Callithrix jacchus) J Neuropathol Exp Neurol. 2009;68(4):341–355. doi: 10.1097/NEN.0b013e31819f1d24. [DOI] [PubMed] [Google Scholar]
- 17.Gaitán MI, Maggi P, Wohler J, et al. Perivenular brain lesions in a primate multiple sclerosis model at 7-tesla magnetic resonance imaging. Mult Scler. 2014;20(1):64–71. doi: 10.1177/1352458513492244. [DOI] [PMC free article] [PubMed] [Google Scholar]
- 18.Leibovitch E, Wohler JE, Cummings Macri SM, et al. Novel marmoset (Callithrix jacchus) model of human Herpesvirus 6A and 6B infections: immunologic, virologic and radiologic characterization. PLoS Pathog. 2013;9(1):e1003138. doi: 10.1371/journal.ppat.1003138. [DOI] [PMC free article] [PubMed] [Google Scholar]
- 19.Liu JV, Bock NA, Silva AC. Rapid high-resolution three-dimensional mapping of T1 and age-dependent variations in the non-human primate brain using magnetization-prepared rapid gradient-echo (MPRAGE) sequence. NeuroImage. 2011;56(3):1154–1163. doi: 10.1016/j.neuroimage.2011.02.075. [DOI] [PMC free article] [PubMed] [Google Scholar]
- 20.Tofts PS, Brix G, Buckley DL, et al. Estimating kinetic parameters from dynamic contrast-enhanced T(1)-weighted MRI of a diffusable tracer: standardized quantities and symbols. J Magn Reson Imaging. 1999;10(3):223–232. doi: 10.1002/(sici)1522-2586(199909)10:3<223::aid-jmri2>3.0.co;2-s. [DOI] [PubMed] [Google Scholar]
- 21.Imai Y, Ibata I, Ito D, et al. A novel gene iba1 in the major histocompatibility complex class III region encoding an EF hand protein expressed in a monocytic lineage. Biochem Biophys Res Commun. 1996;224(3):855–862. doi: 10.1006/bbrc.1996.1112. [DOI] [PubMed] [Google Scholar]
- 22.Lassmann H. Review: the architecture of inflammatory demyelinating lesions: implications for studies on pathogenesis. Neuropathol Appl Neurobiol. 2011;37(7):698–710. doi: 10.1111/j.1365-2990.2011.01189.x. [DOI] [PubMed] [Google Scholar]
- 23.Brück W, Porada P, Poser S, et al. Monocyte/macrophage differentiation in early multiple sclerosis lesions. Annals of Neurology. 1995;38(5):788–796. doi: 10.1002/ana.410380514. [DOI] [PubMed] [Google Scholar]
- 24.Soulas C, Conerly C, Kim W-K, et al. Recently Infiltrating MAC387+ Monocytes/Macrophages. Am J Pathol. 2011;178(5):2121–2135. doi: 10.1016/j.ajpath.2011.01.023. [DOI] [PMC free article] [PubMed] [Google Scholar]
- 25.Pomeroy IM, Matthews PM, Frank JA, et al. Demyelinated neocortical lesions in marmoset autoimmune encephalomyelitis mimic those in multiple sclerosis. Brain. 2005;128(Pt 11):2713–2721. doi: 10.1093/brain/awh626. [DOI] [PubMed] [Google Scholar]
- 26.Pomeroy I, Jordan E, Frank J, et al. Focal and diffuse cortical degenerative changes in a marmoset model of multiple sclerosis. Mult Scler. 2010;16(5):537–548. doi: 10.1177/1352458509360362. [DOI] [PMC free article] [PubMed] [Google Scholar]
- 27.Merkler D, Böscke R, Schmelting B, et al. Differential macrophage/microglia activation in neocortical EAE lesions in the marmoset monkey. Brain Pathol. 2006;16(2):117–123. doi: 10.1111/j.1750-3639.2006.00004.x. [DOI] [PMC free article] [PubMed] [Google Scholar]
- 28.KLUVER H, BARRERA E. A method for the combined staining of cells and fibers in the nervous system. J Neuropathol Exp Neurol. 1953;12(4):400–403. doi: 10.1097/00005072-195312040-00008. [DOI] [PubMed] [Google Scholar]
- 29.Engelhardt B, Ransohoff RM. Capture, crawl, cross: the T cell code to breach the blood-brain barriers. Trends Immunol. 2012 doi: 10.1016/j.it.2012.07.004. [DOI] [PubMed] [Google Scholar]
- 30.Gaitán MI, Shea CD, Evangelou IE, et al. Evolution of the blood-brain barrier in newly forming multiple sclerosis lesions. Annals of Neurology. 2011;70(1):22–29. doi: 10.1002/ana.22472. [DOI] [PMC free article] [PubMed] [Google Scholar]
- 31.Lucchinetti CF, Popescu BFG, Bunyan RF, et al. Inflammatory cortical demyelination in early multiple sclerosis. N Engl J Med. 2011;365(23):2188–2197. doi: 10.1056/NEJMoa1100648. [DOI] [PMC free article] [PubMed] [Google Scholar]
- 32.ADAMS RD, KUBIK CS. The morbid anatomy of the demyelinative disease. Am J Med. 1952;12(5):510–546. doi: 10.1016/0002-9343(52)90234-9. [DOI] [PubMed] [Google Scholar]
- 33.Prineas JW, Parratt JDE. Oligodendrocytes and the early multiple sclerosis lesion. Annals of Neurology. 2012;72(1):18–31. doi: 10.1002/ana.23634. [DOI] [PubMed] [Google Scholar]
- 34.Barnett MH, Prineas JW. Relapsing and remitting multiple sclerosis: pathology of the newly forming lesion. Annals of Neurology. 2004;55(4):458–468. doi: 10.1002/ana.20016. [DOI] [PubMed] [Google Scholar]
- 35.Boche D, Perry VH, Nicoll JAR. Review: activation patterns of microglia and their identification in the human brain. Neuropathol Appl Neurobiol. 2013;39(1):3–18. doi: 10.1111/nan.12011. [DOI] [PubMed] [Google Scholar]
- 36.Kiefer R, Kieseier BC, Brück W, et al. Macrophage differentiation antigens in acute and chronic autoimmune polyneuropathies. Brain. 1998;121( Pt 3):469–479. doi: 10.1093/brain/121.3.469. [DOI] [PubMed] [Google Scholar]
- 37.Trebst C, Sørensen TL, Kivisakk P, et al. CCR1+/CCR5+ mononuclear phagocytes accumulate in the central nervous system of patients with multiple sclerosis. Am J Pathol. 2001;159(5):1701–1710. doi: 10.1016/s0002-9440(10)63017-9. [DOI] [PMC free article] [PubMed] [Google Scholar]
- 38.Hart BA, Bauer J, Muller HJ, et al. Histopathological characterization of magnetic resonance imaging-detectable brain white matter lesions in a primate model of multiple sclerosis: a correlative study in the experimental autoimmune encephalomyelitis model in common marmosets (Callithrix jacchus) Am J Pathol. 1998;153(2):649–663. doi: 10.1016/s0002-9440(10)65606-4. [DOI] [PMC free article] [PubMed] [Google Scholar]
- 39.Absinta M, Sati P, Gaitán MI, et al. Seven-tesla phase imaging of acute multiple sclerosis lesions: A new window into the inflammatory process. Annals of Neurology. 2013;74(5):669–678. doi: 10.1002/ana.23959. [DOI] [PMC free article] [PubMed] [Google Scholar]
- 40.Initial investigation of the blood-brain barrier in MS lesions at 7 tesla. 2013;19(8):1068–1073. doi: 10.1177/1352458512471093. [DOI] [PMC free article] [PubMed] [Google Scholar]
- 41.Pesic M, Bartholomäus I, Kyratsous NI, et al. 2-photon imaging of phagocyte-mediated T cell activation in the CNS. J Clin Invest. 2013;123(3):1192–1201. doi: 10.1172/JCI67233. [DOI] [PMC free article] [PubMed] [Google Scholar]
- 42.Reboldi A, Coisne C, Baumjohann D, et al. C-C chemokine receptor 6-regulated entry of TH-17 cells into the CNS through the choroid plexus is required for the initiation of EAE. Nat Immunol. 2009;10(5):514–523. doi: 10.1038/ni.1716. [DOI] [PubMed] [Google Scholar]
- 43.Xu H, Manivannan A, Liversidge J, et al. Requirements for passage of T lymphocytes across non-inflamed retinal microvessels. Journal of Neuroimmunology. 2003;142(1–2):47–57. doi: 10.1016/s0165-5728(03)00258-3. [DOI] [PubMed] [Google Scholar]
- 44.Fabriek BO, van Haastert ES, Galea I, et al. CD163-positive perivascular macrophages in the human CNS express molecules for antigen recognition and presentation. Glia. 2005;51(4):297–305. doi: 10.1002/glia.20208. [DOI] [PubMed] [Google Scholar]
- 45.Ransohoff RM, Engelhardt B. The anatomical and cellular basis of immune surveillance in the central nervous system. Nat Rev Immunol. 2012;12(9):623–635. doi: 10.1038/nri3265. [DOI] [PubMed] [Google Scholar]
- 46.Larochelle C, Alvarez JI, Prat A. How do immune cells overcome the blood-brain barrier in multiple sclerosis? FEBS Lett. 2011;585(23):3770–3780. doi: 10.1016/j.febslet.2011.04.066. [DOI] [PubMed] [Google Scholar]