

Abstract
Background
The Pacific region is an area unique in the world, composed of thousands of islands with differing climates and environments. The spreading and establishment of the mosquito Aedes aegypti in these islands might be linked to human migration. Ae. aegypti is the major vector of arboviruses (dengue, chikungunya and Zika viruses) in the region. The intense circulation of these viruses in the Pacific during the last decade led to an increase of vector control measures by local health authorities. The aim of this study is to analyze the genetic relationships among Ae. aegypti populations in this region.
Methodology/Principal Finding
We studied the genetic variability and population genetics of 270 Ae. aegypti, sampled from 9 locations in New Caledonia, Fiji, Tonga and French Polynesia by analyzing nine microsatellites and two mitochondrial DNA regions (CO1 and ND4). Microsatellite markers revealed heterogeneity in the genetic structure between the western, central and eastern Pacific island countries. The microsatellite markers indicate a statistically moderate differentiation (FST = 0.136; P < = 0.001) in relation to island isolation. A high degree of mixed ancestry can be observed in the most important towns (e.g. Noumea, Suva and Papeete) compared with the most isolated islands (e.g. Ouvea and Vaitahu). Phylogenetic analysis indicated that most of samples are related to Asian and American specimens.
Conclusions/Significance
Our results suggest a link between human migrations in the Pacific region and the origin of Ae. aegypti populations. The genetic pattern observed might be linked to the island isolation and to the different environmental conditions or ecosystems.
Author Summary
Aedes aegypti is the major arbovirus vector in the Pacific region. The spread of this mosquito in the different islands seems to be linked to human activities at the beginning of the twentieth century. Since 2010, occurrence of arbovirus outbreaks increased in this region, with the co-circulation of dengue, chikungunya and Zika viruses. The lack of vaccines and treatments for these pathogens led the health authorities to implement vector control measures. In this study, we present the genetic structure and the phylogenetic data obtained from the analysis of 270 Ae. aegypti collected in the Pacific region. The infestation of the islands seems to have American and Asian origins. The genetic structure of the vector populations indicates a differentiation of the mosquitoes between the western, central and eastern Pacific island countries and the specific island isolation context. This differentiation could be related to the different environmental conditions in each island country.
Introduction
Dengue fever is the most prevalent arthropod-borne viral infection of humans in tropical and subtropical countries [1]. In the Pacific region dengue virus outbreaks have occurred regularly since World War II [2]. However, over the last 5 years, the arbovirus outbreak profile in the Pacific region has changed. Indeed, the predominant circulation of a single dengue virus serotype moved on to the co-circulation of several dengue serotypes, along with the emergence of chikungunya and Zika viruses [2–5].
Dengue, chikungunya and Zika are arboviruses transmitted to humans through the bites of mosquitoes belonging to the genus Aedes, subgenus Stegomyia. In the Pacific region, many of these vectors are endemic species members of the “scutellaris” group, which, according to Belkin [6], could have derived from a single original species unintentionally introduced by the first Austronesian navigators 1500 to 2000 years ago. Owing to the very particular conditions of this region including strict isolation and ecological differences between the islands, it underwent a speciation process that led to the separation into different species [6, 7]. The introduction of Aedes aegypti was more recent, this mosquito was first recorded in the Pacific in the late nineteenth and the early twentieth century [8]. At present, the main Aedes vectors are Ae. aegypti, Aedes albopictus, Aedes polynesiensis along with nine other Aedes potential vectors [8]. Ae. aegypti is present in most Pacific islands with the exception of Futuna and very few other isolated islands. Recently introduced, from South Asia into Western Pacific islands, Ae. albopictus is now established as far as the Kingdom of Tonga. Ae. polynesiensis is widespread in the Eastern part of Oceania, including Fiji, Samoa Islands, French Polynesia, and Pitcairn [9]. Regarding this distribution, Ae. aegypti is the most widespread arbovirus vector in the Pacific with its presence reported in a majority of islands. This vector is a domestic species, closely associated with human migrations and transportation, commerce and urbanization [10, 11].
Pacific islands have experienced intense population migrations since the early nineteenth century with the first wave of European colonization [12]. During the twentieth century, this migration continued due to the implementation of various business and industrial activities. Thus many Asian workers immigrated into New Caledonia, French Polynesia [13] and Fiji. Population flows between the different Pacific islands have always been observed. This immigration was highly influenced by the vehicular languages used, being more intense between French speaking islands or between English speaking islands [12]. The introduction of Ae. aegypti in different islands over time might be linked to the Pacific history of human migrations. In French Polynesia it was first reported in 1924 only in Tahiti, and then in the Marquesas Islands and in the Austral Islands sixty years later [14] but the first dengue epidemic was described in the middle of the nineteenth century [15] and might be due to Ae. polynesiensis which is a competent dengue vector [16, 17]. The first reported dengue epidemic in New Caledonia was described during the 1880s. This epidemic episode clearly demonstrates the presence of Ae. aegypti, as no other dengue vector had been reported at this date or later on [18]. In Fiji and Tonga, vector descriptions reported the presence of Ae. aegypti from the 1960s [6, 19], but dengue epidemics were recorded before the 1950s [2]. During World War II, the exchanges between America, Asia, Europe and the Pacific islands increased and may have impacted the distribution of Ae. aegypti [20].
Before 1960, no systematic control measures were implemented against Ae. aegypti in the South Pacific islands, except for international airports and harbors [19]. Due to an increase in the frequency and intensity of dengue outbreaks in the second half of the twentieth century, French Polynesia and New Caledonia health authorities adopted similar vector control strategies involving a combination of insecticide spraying and community awareness raising, aimed at source reduction. These strategies resulted in a decrease of the mosquito’s presence in these island groups [21–23]. In 2003, in Fiji, the Ministry of Health decided to assess a larval source reduction campaign to reduce the density of the vector’s breeding sites [24]. In Tonga the WHO decided in 1984 to increase the vector control effort at the international airport with insecticide applications and aircraft disinsection. These vector control operations did not result in elimination of Ae. aegypti, but they created different environments and exerted selective pressure.
To our knowledge, no studies have investigated the genetic diversity of Ae. aegypti in the Pacific region except in French Polynesia, using isoenzymes [11] and alloenzymes [25]. These studies demonstrated a link between the genetic diversity of Ae. aegypti populations, human population density, and vector control intensity. The recent arbovirus outbreak waves in the Pacific region highlight the need to improve our knowledge of Ae. aegypti in the Pacific. The aim of this study is to better understand the genetic structure and the phylogeny of this vector on the Pacific region. For this purpose, we analyzed a set of nine microsatellites and two mitochondrial DNA sequences on 270 Ae. aegypti specimens collected in nine locations distributed in four different Pacific Island Countries and Territories.
Materials and Methods
Description of the study area
The Pacific region is an area unique in the world, composed of thousands of islands, high volcanic and low coral (atoll) islands, separated by vast stretches of ocean. Our sample sites are situated between longitudes 165° East and 139° West, spanning a region approximately 6,000 km wide. Latitudes of our sample sites are between 9° South and 23° South. There are several tropical climatic zones across the South Pacific region with different environments according to the latitude, localization within the islands and human influence. In New Caledonia (NC), temperatures are generally mild although with marked seasons. Poindimie, situated in a rural area exposed to dominant winds, has heavy rainfall whereas Noumea, the main city, is much drier. Ouvea is a flat coral island with no water supply connection (Fig 1). In Fiji (FJ), both sample sites are situated in peri-urban settings. Lautoka, a city on the leeward side of the island, is situated in a dry area. Suva, on the windward side of the same island, has a wet climate. In Tonga (TG), Havelu is a suburb of Nuku’alofa, capital of the country, on the island of Tongatapu, a flat coral island, but, where piped water supply is available, unlike on Ouvea (Fig 1). In French Polynesia (FP) the climate is different between the islands. Tubuai is the southernmost sample site of all. It is a rural island with temperate climate and distinct seasons. Papeete is the main city on Tahiti, with a humid tropical maritime climate and high temperature with slight seasonal variations. The village of Vaitahu on the island of Tahuata in the Marquesas Islands, is the northernmost sample site with warm conditions year round (Fig 1).
Fig 1. Pacific map locating Ae. aegypti sampling sites, 2013.

The nine sample sites are represented by the red dots.
Mosquito sampling
Mosquitoes were sampled at the immature stage (larvae and pupae) in the four island countries: New Caledonia (NC, 3 sites), French Polynesia (FP, 3 sites), Fiji (FJ, 2 sites) and Tonga (TG, 1 site) (Fig 1). For each sampling site a central spot was specified (Table 1). All potential breeding sites within a 200 m radius were searched and mosquito larvae and pupae were collected (three to eleven containers were sampled per site). A first morphological identification was carried out. Aedes-like larvae were reared to adulthood for confirmation and the Ae. aegypti specimens collected. Thirty such specimens from each site were stored in 100% ethanol at -20°C for molecular analysis.
Table 1. Ae aegypti sampling sites: coordinates and date in Pacific islands, 2013.
| Sample name | Locality | Country | Date | Latitude | Longitude |
|---|---|---|---|---|---|
| Poi-NC | Poindimie | New Caledonia | Jul. 2013 | 20°56'56" S | 165°19'58" E |
| Nou-NC | Noumea | New Caledonia | Jul. 2013 | 22°13'57" S | 166°25'25" E |
| Ouv-NC | Ouvea (Loyalty Islands) | New Caledonia | Jul. 2013 | 20°39'00" S | 166°32'38" E |
| Lau-FJ | Lautoka (Viti Levu Island) | Fiji | Oct. 2013 | 17°39'33" S | 177°24'17" E |
| Suv-FJ | Suva (Viti Levu Island) | Fiji | Oct. 2013 | 18°05'13" S | 178°27'43" E |
| Hav-TG | Havelu (Nuku’alofa Tongatapu Island) | Tonga | Oct. 2013 | 21°09'03" S | 175°13'12"W |
| Tub-FP | Mataura (Tubuai Australes Islands) | French Polynesia | Nov. 2013 | 23°20'49" S | 149°28'43" W |
| Pap-FP | Papeete (Tahiti) | French Polynesia | Aug. 2013 | 17°31'38" S | 149°33'00" W |
| Vai-FP | Vaitahu (Tahuata Marquisas Islands) | French Polynesia | Jan. 2013 | 9°56'14" S | 139°06'29" W |
Thirty mosquitoes were analyzed for each sampling site.
DNA extraction
Total DNA was extracted from adult mosquitoes using the DNeasy Blood & Tissue Kit (Qiagen) with a first step of mechanic lysis with 2.38 mm RNase/DNase free metal beads at 3000 rpm during 1 min and stored at -20°C.
Microsatellite analysis
Individual genotypes were scored for 11 previously published microsatellite loci: AC1, AC2, AC4, AG1, AG2, AG5, CT2 [26], A1, B2, B3 [27] and 145TAAA1 [28]. DNA was amplified in a Veriti 96 well Thermal Cycler (Applied Biosystems) using the GoTaq G2 Flexi DNA Polymerase (Promega) as described in previous studies with slight modifications [26–28]. PCR products were analyzed using a Genetic Analyser 3130xl (Applied Biosystems). The results were genotyped with Peak Scanner software (Applied Biosystems) and double-checked (i. e., read by two independent people).
The deviation from Hardy-Weinberg equilibrium for each locus was tested with GenAlex 6.5 [29]. MicroChecker v2.2.3 [30] was used to calculate the probability of null allele occurrence in each locus within each population. The number of alleles and the estimated allele richness [31] were determined by FSTAT2.9.3 software [32]. The FIS for each population for all loci were calculated using Genetix [33] and Arlequin v3.5.1.2 [34]. The Analysis of Molecular Variance (AMOVA) and the FST were computed using Arlequin v3.5.1.2 software [34]. The population genetic structure was determined using STRUCTURE software [35]. The Bayesian approach was chosen to infer the number of genetic clusters (K). We performed twenty independent runs, K from 1 to 15, with a burn-in period of 100,000 iterations and a total of 1,000,000 Markov Chain Monte Carlo iterations. The program Structure Harvester [36] was used to determine the most probable number of clusters by calculating the ΔK value [37]. The web server CLUMPAK was used to summarize and visualize the STRUCTURE results [38]. A Mantel test of correlation between geographical and genetic distance matrices was tested on IBD web server 3.23 [39] with 1,000 permutations.
MtDNA sequencing analysis
A mitochondrial DNA analysis was performed for two genes: CO1 [40] and ND4 [41]. The 270 DNA samples were amplified and sequenced with the primers previously published. Amplified fragments were purified with the MinElute PCR Purification kit (Qiagen) and sequenced using BigDye Terminator v3.1 Cycle Sequencing kit (Applied Biosystems) on a Genetic Analyser 3130xl (Applied Biosystems).
Sequences were analyzed using Staden Package (MRC Cambridge, England), nucleotide sequences were aligned with BioEdit [42]. The haplotype numbers were assigned in reference to the published Ae. aegypti sequence from Cambodia for CO1 (GenBank accession No. JQ926688) and for ND4 (GenBank accession No. JQ926722). The nucleotide diversity (π), the Tajima [43], the Fu and Li [44] and Fu [45] tests were computed by DNASP v5 [46] to determine the neutrality of the populations. The phylogenetic networks based on CO1 and ND4 sequences were constructed using a reduced-median algorithm [47] as implemented in the Network program [48]. MRBAYES 3.1.2 software [49] was used to make a CO1-ND4 combined analysis using sequences obtained in this study and retrieved from GenBank. Four Markov chains were run for 2,000,000 generations with a 25% burn-in. The tree was drawn with FigTree v1.4.2 (Institute of Evolutionary Biology, University of Edinburgh). A Principle Coordinate Analysis (PCoA) of the mtDNA sequences was realized with DARwin software [50].
Results
Microsatellites analysis
Genetic variability of the samples
The 11 microsatellite loci allowed the identification of genotypes from the 270 Ae. aegypti adult mosquitoes sampled from the nine sites. The presence of a null allele was suspected at loci AG2 and 145TAAA1, which were therefore excluded from the analysis, leading to a dataset of 9 loci. A total of 57 alleles was observed for all samples (Table 2). The allelic richness was determined as 6 for the whole population ranging from 4 alleles for locus AC2 to 9 alleles for locus AG5. Regarding the allelic richness, no significant difference was observed among the different sampling sites or the different island countries.
Table 2. Genetic variability parameters estimated for the 9 microsatellites markers analyzed for all mosquito samples.
| AC1 | AC2 | AC4 | A1 | AG1 | AG5 | CT2 | B2 | B3 | All Loci | |||||||||||||||||||||
|---|---|---|---|---|---|---|---|---|---|---|---|---|---|---|---|---|---|---|---|---|---|---|---|---|---|---|---|---|---|---|
| Nall | Rs | Fis | Nall | Rs | Fis | Nall | Rs | Fis | Nall | Rs | Fis | Nall | Rs | Fis | Nall | Rs | Fis | Nall | Rs | Fis | Nall | Rs | Fis | Nall | Rs | Fis | Nall | Rs | Fis | |
| Poi-NC | 6 | 6 | 0,015 | 4 | 4 | -0,055 | 4 | 4 | -0,065 | 3 | 3 | 0,376 | 5 | 4,967 | 0,348 | 4 | 4 | -0,08 | 2 | 2 | 0,223 | 5 | 4,967 | 0,173 | 3 | 3 | -0,023 | 36 | 4 | 0,086 |
| Nou-NC | 6 | 6 | -0,011 | 4 | 3,966 | -0,074 | 4 | 4 | -0,076 | 3 | 3 | 0,095 | 5 | 5 | 0,038 | 5 | 5 | -0,12 | 2 | 2 | 0,262 | 2 | 2 | 0,721 | 2 | 2 | -0,324 | 33 | 3,7 | 0,045 |
| Ouv-NC | 4 | 3,967 | 0,139 | 3 | 3 | -0,236 | 5 | 4,966 | -0,052 | 3 | 3 | 0,206 | 5 | 6,933 | 0,051 | 5 | 4,999 | 0,059 | 2 | 2 | 0,296 | 3 | 2,967 | -0,065 | 3 | 3 | -0,108 | 33 | 3,7 | 0,017 |
| Lau-F | 6 | 5,967 | 0,01 | 3 | 3 | 0,033 | 2 | 2 | -0,177 | 5 | 4,966 | -0,099 | 4 | 4 | 0,025 | 7 | 6,999 | 0,132 | 4 | 3,967 | -0,113 | 4 | 4 | -0,09 | 3 | 3 | -0,295 | 38 | 4,2 | -0,055 |
| Suv-F | 5 | 4,999 | -0,229 | 4 | 4 | -0,117 | 2 | 2 | -0,387 | 5 | 4,967 | -0,031 | 4 | 4 | 0,146 | 6 | 5,966 | -0,08 | 3 | 2,967 | 0,138 | 4 | 4 | -0,386 | 4 | 4 | -0,204 | 37 | 4,1 | -0,128 |
| Hav-T | 6 | 5,933 | 0,158 | 4 | 3,967 | 0,119 | 2 | 2 | 0,141 | 5 | 4,966 | -0,135 | 3 | 3 | 0,162 | 4 | 4 | 0,136 | 4 | 4 | -0,152 | 4 | 3,966 | -0,67 | 5 | 4,967 | 0,186 | 37 | 4,1 | 0,009 |
| Mat-FP | 4 | 4 | -0,162 | 4 | 3,967 | 0,056 | 2 | 2 | 0,102 | 4 | 3,999 | 0,037 | 4 | 4 | 0,03 | 5 | 5 | -0,087 | 2 | 2 | -0,057 | 3 | 3 | 0,127 | 3 | 3 | -0,092 | 31 | 3,4 | -0,013 |
| Pap-FP | 4 | 4 | 0,165 | 4 | 3,967 | 0,157 | 2 | 2 | -0,208 | 4 | 3,999 | -0,038 | 4 | 4 | 0,107 | 5 | 5 | 0,113 | 3 | 3 | -0,101 | 5 | 4,967 | -0,218 | 4 | 3,967 | -0,205 | 35 | 3,9 | -0,004 |
| Vai-FP | 4 | 4 | 0,075 | 3 | 3 | 0,238 | 2 | 2 | -0,137 | 2 | 2 | 0,125 | 5 | 5,965 | -0,188 | 5 | 5 | 0,045 | 4 | 3,933 | -0,083 | 5 | 5 | -0,072 | 2 | 2 | 0,065 | 32 | 3,6 | 0,029 |
| New Caledonia | 6 | 5,983 | 0,145 | 4 | 3,973 | -0,106 | 5 | 4,333 | -0,048 | 3 | 3 | 0,261 | 5 | 5,665 | 0,169 | 6 | 5,785 | 0,039 | 2 | 2 | 0,283 | 5 | 4,235 | 0,286 | 3 | 2,999 | -0,103 | 39 | 4,3 | 0,103 |
| Fiji | 6 | 5,5 | -0,099 | 4 | 3,994 | -0,024 | 2 | 2 | -0,216 | 5 | 4,751 | -0,061 | 4 | 3,994 | 0,1 | 8 | 6,995 | 0,055 | 5 | 3,997 | 0,033 | 5 | 4,878 | -0,137 | 4 | 3,941 | -0,249 | 43 | 4,8 | -0,062 |
| Tonga | 6 | 5,933 | 0,158 | 4 | 3,967 | 0,119 | 2 | 2 | 0,141 | 5 | 4,966 | -0,135 | 3 | 3 | 0,162 | 4 | 4 | 0,136 | 4 | 4 | -0,152 | 4 | 3,966 | -0,67 | 5 | 4,967 | 0,186 | 37 | 4,1 | 0,009 |
| French Polynesia | 4 | 4 | 0,082 | 4 | 3,999 | 0,237 | 2 | 2 | -0,094 | 5 | 4,113 | 0,17 | 5 | 5,114 | 0,059 | 7 | 6,023 | 0,143 | 4 | 3,333 | 0,074 | 5 | 4,791 | -0,005 | 4 | 3,788 | 0,092 | 40 | 4,4 | 0,099 |
| All samples | 8 | 7,985 | 0,123 | 4 | 4 | 0,142 | 5 | 4,993 | 0,104 | 6 | 6 | 0,228 | 6 | 8,985 | 0,172 | 9 | 9 | 0,129 | 8 | 7,989 | 0,131 | 6 | 6 | 0,061 | 5 | 5 | -0,021 | 57 | 6,3 | 0,12 |
Nall corresponds to the number of scored alleles; Rs represents the Allele Richness; FIS indicates the Inbreeding coefficient.
Genetic structure of the samples
The AMOVA results indicated statistically moderate genetic differentiation for all samples (FST = 0.136; P < = 0.001). FST among the studied sample sites ranged from 0.05 to 0.24 (Table 3). The highest FST value was obtained between Ouvea (NC) and Vaitahu (FP) with 0.24. The two lowest results were obtained between Suva (FJ) and Lautoka (FJ) on one hand, while between Poindimie (NC) and Noumea (NC) on the other hand with a score of 0.05. Globally the FST results for Vaitahu (FP) were higher than the others (ranging from 0.13 to 0.24). Moreover, statistically high differences were observed between the New Caledonia samples and the samples of central (FJ and TG) and eastern Pacific (FP). The results of the Mantel test demonstrated a significant correlation between the genetic differentiation and the geographical distance (r = 0.6164; P < 0.001) (Fig 2) for the Pacific samples analyzed.
Table 3. Pairwise FST values for the nine populations studied and geographic distances between the sampling sites (in km).
| Poi-NC | Nou-NC | Ouv-NC | Lau-FJ | Suv-FJ | Hav-TG | Tub-FP | Pap-FP | Vai-FP | |
|---|---|---|---|---|---|---|---|---|---|
| Poi-NC | - | 182 | 130 | 1318 | 1412 | 2017 | 4643 | 4737 | 6050 |
| Nou-NC | 0.051 | - | 176 | 1255 | 1338 | 1899 | 4505 | 4618 | 5946 |
| Ouv-NC | 0.094 | 0.097 | - | 1188 | 1282 | 1894 | 4527 | 4613 | 5923 |
| Lau-FJ | 0.161 | 0.110 | 0.185 | - | 122 | 865 | 3499 | 3498 | 4763 |
| Suv-FJ | 0.122 | 0.094 | 0.148 | 0.051 | - | 744 | 3378 | 3383 | 4656 |
| Hav-TG | 0.156 | 0.145 | 0.168 | 0.136 | 0.064 | - | 2657 | 2720 | 4053 |
| Tub-FP | 0.187 | 0.176 | 0.154 | 0.112 | 0.110 | 0.175 | - | 647 | 1854 |
| Pap-FP | 0.108 | 0.117 | 0.149 | 0.087 | 0.095 | 0.141 | 0.083 | - | 1408 |
| Vai-FP | 0.162 | 0.172 | 0.238 | 0.166 | 0.148 | 0.198 | 0.188 | 0.130 | - |
Below diagonal, FST values, statistical significance was 0.05. Above diagonal, geographical distances (km) between the sample sites.
Fig 2. Correlation between the geographic and genetic distance matrices.
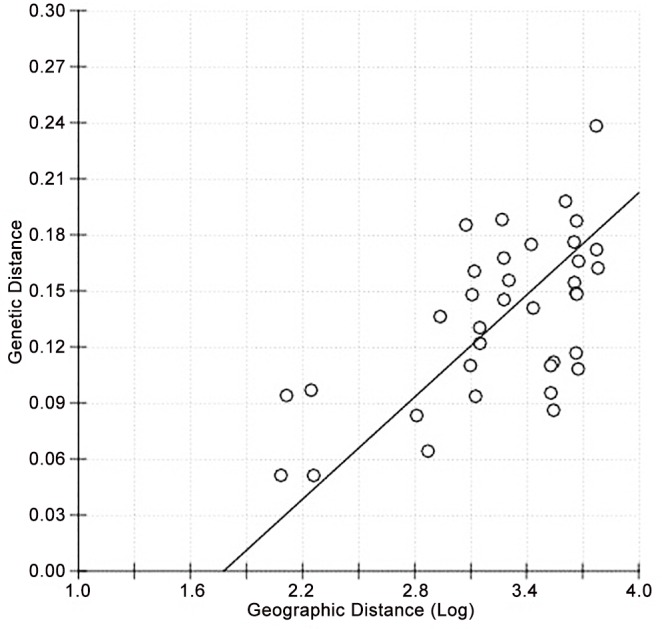
The regression line corresponds to the standard major axis regression between pairwise genetic distances and logarithmic geographic distances with equation: Fst = - 0.1620 + 0.09113·log (geographic distance). The relationship was significant (Mantel test: Z = 16.3746; r = 0.6164; P < 0.001).
The Bayesian analysis performed, with the Evanno et al method [37], revealed that the most likely number of clusters were K = 2, K = 4 (highest probability) and K = 7. These three clustering models were further analyzed. The two-cluster plot (K = 2) indicates a differentiation between the samples of New Caledonia (West Pacific) on one hand, Fiji, Tonga (Central Pacific) and French Polynesia (East Pacific) on the other hand (Fig 3). The four-cluster plot (K = 4) highlights a differentiation between the samples of Fiji and Tonga. The Suva samples seemed to be more differentiated than the Lautoka or Havelu samples. For French Polynesia the Vaitahu samples appeared to be a separate cluster and the Papeete individuals looked to be more diversified than the other FP samples. The seven-cluster plot (K = 7) confirmed the results obtained with the AMOVA: a high diversity for Suva and Papeete, mid-diversity for Noumea/Poindimie and Lautoka and isolation of Ouvea, Havelu, Tubuai and Vaitahu.
Fig 3. Model-based clustering of 270 Ae. aegypti individuals using STRUCTURE software.

Each individual is represented by a single vertical line; sample sites are separated by a black line; the whole sample is divided into K colors representing the number of clusters assumed. The colors show the estimated individual proportions of cluster membership.
MtDNA phylogeny analysis
CO1 gene diversity
All 270 individuals were analyzed for their CO1 sequence. The 711 bp alignment revealed the presence of seven distinct haplotypes (Figs 4, 5 and S1 Table, S2 Table) and a nucleotide diversity of π = 0.00177. Haplotype I (frequency = 0.25) was present in all islands except in Poindimie (NC) and in Fiji. Haplotype II (frequency = 0.24) was present in New Caledonia, Fiji and Vaitahu (in FP). Haplotype III (frequency = 0.21) was found in eastern islands (FP). Haplotype IV (frequency 0.18) seemed to be exclusively present in NC. The haplotype V (frequency = 0.09) was present only in Fiji. Haplotype VI (frequency = 0.02) was present only in Papeete (FP). And haplotype VII (frequency = 0.01) appeared to be exclusive to Suva (FJ). Haplotype II seemed to be the link between the different CO1 haplotypes in the Pacific region (Fig 5A). Haplotype VI appeared to derive from haplotype I with a single mutation. A link between haplotype VII and haplotypes III and V seemed to be present. Tajima’s D statistic (D = 1.02758, P > 0.10), used to determine the departure from neutrality, was not significant but suggested a balancing selection or a decrease in population size due to the presence of multiple alleles, some at low and other at high frequencies. Fu and Li’s statistics were positive but not significant (F* = 1.17029, P > 10; D* = 0.95715, P > 0.10) and confirmed the Tajima’s D result.
Fig 4. Representation of the MtDNA haplotype frequencies within the sample sites.

The left circles indicate the CO1 haplotype frequencies and the right circles the ND4 haplotype frequencies. The arc length of each slice is proportional to the haplotype frequencies (as an example a semicircle represents 15 samples). Haplotype frequencies are indicated in S1 Table.
Fig 5. Median-joining network obtained with the haplotypes of all samples.

A- Representation for the mtDNA CO1 sequences. B- Representation for mtDNA ND4 sequences. The diameters of grey circles represent the frequency of each haplotype for all individuals. The red number indicates the position of the mutation on the analyzed sequences.
ND4 gene diversity
Partial ND4 sequence was analyzed for all individuals (Figs 4, 5 and S1 Table, S2 Table). The 320 bp alignment revealed the presence of three distinct haplotypes and a nucleotide diversity of π = 0.00203. Haplotype I (frequency = 0.59) was present in all Pacific samples. As for haplotype II (frequency = 0.22) the results demonstrated its presence only in central and eastern islands from Suva to Vaitahu. Haplotype III (frequency = 0.19) was present in the western islands from Poindimie (NC) to Suva (FJ). Haplotypes II and III seem to derive from haplotype I with only a single nucleotide difference (Fig 5B). The departure from neutrality, indicated by Tajima’s D statistic, was not significant (D = 1.131386, P > 0.10). Fu and Li’s statistics were positive but not significant either (F* = 0.99728, P > 0.10; D* = 0.61853, P > 0.10).
Associated CO1-ND4 sequences analysis
The sequences of CO1 and ND4 were concatenated to perform a phylogenetic analysis with published mtDNA sequences from extra-Pacific Ae. aegypti specimens (Fig 6 and S3 Table). The phylogenetic tree obtained indicated the presence of a main combined haplotype in Pacific samples (CO1-I / ND4-I) originating from Asia. Specimens from the West Pacific (NC and FJ) were both linked to American mosquitoes and to Asian mosquitoes. A haplotype of Papeete-FP originated from Asia. Two haplotypes of Suva-FJ seemed to be linked to Australian specimens (CO1 mtDNA) and Asian specimens. The other samples principally of French Polynesia, Tonga and Suva-FJ were not clearly affiliated. The PCoA performed on associated CO1-ND4 sequences (S1 Fig) corroborated the results obtained. In fact, it underlined three origins: Asian, American and Australian.
Fig 6. Phylogenetic tree obtained with a Bayesian inference of concatenated CO1 and ND4 sequence data.

Numbers in parentheses indicate the number of samples belonging to this haplotype. For the Australian sample, only the CO1 sequence was available. Rooting was inferred from DNA sequences of Anopheles pullus and Culex quinquefasciatus but were not represented for clarity
Discussion
The spread of Ae. aegypti in the Pacific took decades [6, 14, 18, 19]. The presence of this vector contributed to an explosive arbovirus situation in the Pacific region since the year 2010. Pacific Island Countries and Territories tried to limit the importation of Ae. aegypti in new territories through the establishment of control measures at sea-ports and airports. These measures may have prevented the increase of mosquito populations, but no evidence of eradication of the vector was ever recorded as it was in South American or Mediterranean countries [40, 51, 52]
Our results indicate the presence of multiple clusters in the mosquito samples from the Pacific islands [40]. Our Ae. aegypti samples are linked to Ae. aegypti originating from the Americas, South-East Asia and Australia (Fig 6 and S1 Fig). The introduction of the Asian lineage in New Caledonia could be linked to i) whaling industry and the sandalwood commerce between China/Australia/Pacific (Fiji and New Caledonia) in the years 1800–1850 [53] and ii) the immigration of Asian workers to New Caledonia during the years 1900–1940 for the mining industry [54]. In French Polynesia the presence of the Asian lineage could be linked to a substantial immigration of Chinese people, with three waves of immigration: the first one in 1865, then from 1907 to 1914 and lastly from 1921 to 1925 [13]. The presence of Ae. aegypti of the American origin in the Pacific could be associated with the whaling activity during the XIXth century, and to the presence of the US navy during World War II. From 1942 to 1945, New Caledonia was a support base and a key location for the US and Allied troops fighting in the Pacific War. The NC human population doubled during this period, and a dramatic increase in trade and economic activity took place. Furthermore, between the years 1880 and 1910, most importations into New Caledonia came from Australia, the United States and France with at least one ship calling at Noumea every two days [55]. In Fiji, the link with the Australian cluster could be related to the sugar cane and sandalwood trade between the two countries [53]. The principal commercial exchanges of Fiji, where a large proportion of the current population is of Indian origin, were with India, South-East Asia, Australia, the United States, and Europe [55]. The same commerce pattern is valid for Tonga. It is important to note that although this Ae. aegypti migration through the Pacific started during the nineteenth century, it might still be a current phenomenon. Ae. aegypti was first recorded in New Caledonia’s outer islands Mare and Lifou only in the 90’s and on Isle of Pins in 2003 [56]. In French Polynesia, Ae. aegypti was first recorded in the Austral Islands in 1984 [14]. On another hand, Ae. albopictus is currently invading the Pacific region, it has been reported in Fiji in 1988 [57], in Tonga in 2011 [58] and in Vanuatu in 2012 [59]but not yet in French Polynesia and New Caledonia [8, 60].
The presence of mitochondrial pseudogenes was observed in Fiji mosquitoes (two samples for Suva and one for Lautoka) for CO1 mtDNA (Haplotype CO1-V and CO1-VII, Fig 5 and S2 Table) with difficult distinction between a C and a T nucleotide. The presence of pseudogenes has already been demonstrated in Ae. aegypti nuclear genome. This genetic phenomenon, called heteroplasmy, was highly prevalent in previous studies [61, 62]. Among all the populations studied, it is interesting to note that this heteroplasmy was found only in Fiji samples, where haplotype distribution from eastern and western Pacific overlap, thus suggesting that Fiji might act as a hub regarding Ae. aegypti diversity.
In general, the genetic diversity observed within the Pacific was lower than the genetic diversity observed in studies implemented in Africa [63] or South America [51]. Comparing these works to our context, a decrease in diversity was commonly observed in other islands and especially in Martinique [64] or Dominica [51] in the Caribbean. The genetic diversity seemed to be linked with the isolation of the island, and a low level of genetic exchanges between different islands was shown in French Polynesia [25, 64]. These results were confirmed by the presence of high correlation in the Mantel test (Fig 2) and suggest that even short range mosquitoes like Ae. aegypti can disperse readily within an island, each island having its own diversity.
Our results also indicate a clear structure differentiation between New Caledonia samples and the mosquitoes of Central (FJ and TG) and East Pacific (FP) (Fig 3). It is interesting to note, that mosquito specimens collected on the same island (ie: Noumea/Poindimie and Lautoka/Suva) are more homogeneous compared to samples from different islands (ie: Ouvea, Havelu, Tubuai and Vaitahu) which are more isolated. As a fact, in 1958, Ae. aegypti was restricted to Noumea and its suburbs [65]. The first mention of this species in Ouvea was reported in 1962 [6]. Whereas travel between Noumea and Poindimie is easy by road, Ouvea has remained quite isolated from the main island, which is corroborated by the Ae. aegypti-free status of the other Loyalty islands until the end of the 1990s[66, 67].
The mosquitoes of Noumea, Suva and Papeete were more genetically mixed. New Caledonia, French Polynesia and Fiji have the largest economies in the South Pacific region [68], thus underlining the importance of the sea-ports in this specific structure. Indeed, in New Caledonia, the Nickel industry represents 75% of the export of goods: mainly to Asia, Australia and Europe. For mosquitoes collected in central Pacific islands, a differentiation was observed between Lautoka (FJ) and Havelu (TG). The genetic link between Fiji and Tonga could be explained by the relative proximity of these two island countries and the volume of trade between them. Furthermore, the goods and services importation/exportation are promoted between English or French speaking countries [12].
Environmental conditions and ecosystems could have an impact on the structure of the Ae. aegypti population. Insecticides used both for agriculture and vector control can exert specific environmental constraints. Among the different island countries, insecticide use has been implemented in different ways. In New Caledonia, malathion (organophosphate) was used until the end of the 1980s when it was replaced by deltamethrin (pyrethroid). Malathion was reintroduced in 2005 due to the detection of mosquito resistance to pyrethroids and used until present day [69]. In French Polynesia, only malathion was used before the year 2000. Malathion was then used alternatively with pyrethroids. In Tonga, malathion was used until the end of the twentieth century and was then replaced by pyrethroids. These different vector control strategies could have an impact on the genetic structure of the Ae. aegypti population [64], (due to genetic bottlenecks) along with other environmental factors (climate, human influence…).
This is, to our knowledge, the first study carried out on a Pacific scale dealing with the genetic diversity and phylogeny of Ae. aegypti. The genetic specificity could have an impact on vector competence for the arbovirus especially for dengue virus [70–72]. In the Pacific region, the arboviral outbreaks impacted island countries at different times [4]. The genetic structure in the Pacific region indicates a western, central and eastern differentiation between the Ae. aegypti samples. Previous studies reported that the vector competence of Ae. aegypti for dengue virus is linked to the mosquito genetic factor and to the dengue virus strain [72, 73]. Thus characterization of vector competence for arboviruses in Pacific island mosquitoes is also an important issue deserving investigation.
Supporting Information
The colour indicates the geographical sample origin: blue represents American samples, green Asian samples, purple African samples, yellow Australian samples and red Pacific samples. Both axis represent 77.9% of the variability in the dataset.
(PDF)
N Number of individual analyzed. Roman numerals indicate the name of CO1 or ND4 haplotypes.
(PDF)
N corresponds to the number of sample belonging to this haplotype.
(PDF)
(PDF)
Acknowledgments
We thank Olivia O’Connor for her valuable suggestions during the project. We thank Subdivision Santé des Australes (Patricia Anania and Mathias Ellacott) and for assistance in mosquito sampling in Tubuai, the Heads of Units Drs Mike Kama, Eric Rafai (Fiji), Dr Reynold 'Ofanoa (Tonga) and all the Environmental Health Inspectors who participated in the field collection and laboratory rearing, particularly Mrs Kelera Oli and Alisi Tokailagi, Mr Waqa Tikoisuva and Kareleli Voi (Fiji) and Mr Uatesoni Tu'Angalu and Siaola Mahe (Tonga). We thank Mrs Sela 'Akolo Fa'u for revision of the manuscript. We are grateful to Secretariat of the Pacific Community for the help in coordination and data access. We thank Nicolas Pocquet for scientific discussion on Ae. aegypti. We thank Evelyne Henriot, Yves Mermoud, José-Louis Barbançon for sharing information regarding the past colonization of New Caledonia. Sequencing and genotyping were performed on “La Plateforme du Vivant”, Noumea, New Caledonia.
Data Availability
All sequences files are available from the GenBank database (accession numbers KT313642 to KT313662).
Funding Statement
This work was funded by the “Agence Française pour le Développement” through the Pacific Fund (CZT102701R/n°1162, CNC194801X/n°1272, UO0209CSOLD988/n°1439) and by the Government of New Caledonia (CS123007063/n°1162). Recipient for both grants: LG. The funders had no role in study design, data collection and analysis, decision to publish, or preparation of the manuscript.
References
- 1.Weaver SC, Reisen WK. Present and future arboviral threats. Antiviral Research. 2010;85(2):328–45. 10.1016/j.antiviral.2009.10.008 [DOI] [PMC free article] [PubMed] [Google Scholar]
- 2.Singh N, Kiedrzynski T, Lepers C, Benyon EK. Dengue in the Pacific—an update of the current situation. Pacific health dialog. 2005;12(2):111–9. Epub 2008/01/10. . [PubMed] [Google Scholar]
- 3.Cao-Lormeau V-M, Musso D. Emerging arboviruses in the Pacific. The Lancet. 384(9954):1571–2. 10.1016/S0140-6736(14)61977-2. [DOI] [PubMed] [Google Scholar]
- 4.Roth A MA, Lepers C, Hoy D, Duituturaga S, Benyon E, Guillaumot L, Souarès Y. Concurrent outbreaks of dengue, chikungunya and Zika virus infections–an unprecedented epidemic wave of mosquito-borne viruses in the Pacific 2012–2014. Euro Surveill. 2014;19(41):20929 [DOI] [PubMed] [Google Scholar]
- 5.Dupont-Rouzeyrol M, O'Connor O, Calvez E, Daures M, John M, Grangeon JP, et al. Co-infection with Zika and dengue viruses in 2 patients, New Caledonia, 2014: Emerg Infect Dis. 2015. February;21(2):381–2. 10.3201/eid2102.141553 [DOI] [PMC free article] [PubMed] [Google Scholar]
- 6.Belkin JN. The mosquitoes of the South Pacific: Diptera, Culicidae Berkeley, University of California Press; 1962;Vol. 1. [Google Scholar]
- 7.Rao NP, Rai KS. Inter and intraspecific variation in nuclear DNA content in Aedes mosquitoes. Heredity. 1987;59(2):253–8. [DOI] [PubMed] [Google Scholar]
- 8.Guillaumot L. Arboviruses and their vectors in the Pacific—status report. Pacific health dialog. 2005;12(2):45–52. . [PubMed] [Google Scholar]
- 9.Horwood P, Bande G, Dagina R, Guillaumot L, Aaskov J, Pavlin B. The threat of chikungunya in Oceania. Western Pac Surveill Response J. 2013;4(2):8–10. 10.5365/WPSAR.2013.4.2.003 [DOI] [PMC free article] [PubMed] [Google Scholar]
- 10.Lounibos LP. Invasions by insect vectors of human disease. Annual Review of Entomology. 2002;47(1):233–66. 10.1146/annurev.ento.47.091201.145206 [DOI] [PubMed] [Google Scholar]
- 11.Paupy C, Vazeille-Falcoz M, Mousson L, Rodhain F, Failloux AB. Aedes aegypti in Tahiti and Moorea (French Polynesia): isoenzyme differentiation in the mosquito population according to human population density. The American journal of tropical medicine and hygiene. 2000;62(2):217–24. . [DOI] [PubMed] [Google Scholar]
- 12.Rallu J-L. Tendance recentes des migrations dans le Pacifique Sud. In: Espace, population, sociétés. Les population du Pacifique—Populations of the Pacific. 1994–2:201–12. 10.3406/espos.1994.1640 [DOI] [Google Scholar]
- 13.Rallu J-L. Démographie des territoire français d'Océanie. In: Revue française d'histoire d'outre-mer. La France du Pacifique. 1989;76 (n°284–285, 3e et 4e trimestre 1989):45–62. 10.3406/outre.1989.2742 [DOI] [Google Scholar]
- 14.ORSTOM. Atlas de Polynésie Française. Editions de l'ORSTOM, Paris, France. 1993.
- 15.Chungue E DX, Murgue B. Dengue in French Polynesia: Major features, surveillance, molecular epidemiology and current situation. Pac Health Dialog. 1998;5:154–62. [Google Scholar]
- 16.Carrington LB, Simmons CP. Human to Mosquito Transmission of Dengue Viruses. Frontiers in Immunology. 2014;5:290 10.3389/fimmu.2014.00290 . [DOI] [PMC free article] [PubMed] [Google Scholar]
- 17.Rosen L, Rozeboom LE, Sweet BH, Sabin AB. The transmission of dengue by Aedes polynesiensis Marks. Am J Trop Med Hyg. 1954;3(5):878–82. [DOI] [PubMed] [Google Scholar]
- 18.Perry WJ. The mosquitoes and mosquito-borne diseases on New Caledonia, an historic account; 1885–1946. The American journal of tropical medicine and hygiene. 1950;30(1):103–14, illust. . [DOI] [PubMed] [Google Scholar]
- 19.Chow CY. Aedes aegypti in the Western Pacific Region. Bulletin of the World Health Organization. 1967;36(4):544–6. . [PMC free article] [PubMed] [Google Scholar]
- 20.Kuno G. Research on dengue and dengue-like illness in East Asia and the Western Pacific during the First Half of the 20th century. Reviews in Medical Virology. 2007;17(5):327–41. 10.1002/rmv.545 . [DOI] [PubMed] [Google Scholar]
- 21.Dupont-Rouzeyrol M, Caro V, Guillaumot L, Vazeille M, D'Ortenzio E, Thiberge JM, et al. Chikungunya virus and the mosquito vector Aedes aegypti in New Caledonia (South Pacific Region). Vector Borne Zoonotic Dis. 2012;12(12):1036–41. Epub 2012/11/22. 10.1089/vbz.2011.0937 . [DOI] [PubMed] [Google Scholar]
- 22.Lardeux F, Riviere F, Sechan Y, Loncke S. Control of the Aedes vectors of the dengue viruses and Wuchereria bancrofti: the French Polynesian experience. Ann Trop Med Parasitol. 2002;96(2):S105–16. [DOI] [PubMed] [Google Scholar]
- 23.Nhan TX, Claverie A, Roche C, Teissier A, Colleuil M, Baudet JM, et al. Chikungunya virus imported into French polynesia, 2014: Emerg Infect Dis. 2014. October;20(10):1773–4. 10.3201/eid2010.141060 [DOI] [PMC free article] [PubMed] [Google Scholar]
- 24.Raju AK. Community Mobilization in Aedes aegypti Control Programme by Source Reduction in Peri-Urban District of Lautoka, Viti Levu,Fiji Islands. 2003;Dengue Bulletin(27):149–55. [Google Scholar]
- 25.Failloux AB, Darius H, Pasteur N. Genetic differentiation of Aedes aegypti, the vector of dengue virus in French Polynesia. Journal of the American Mosquito Control Association. 1995;11(4):457–62. . [PubMed] [Google Scholar]
- 26.Slotman M, Kelly N, Harrington C, Kitthawee S, Jones W, Scott T, et al. Polymorphic microsatellite markers for studies of Aedes aegypti (Diptera: Culicidae), the vector of dengue and yellow fever. Mol Ecol Notes. 2007;7:168–71. 10.1111/j.1471-8286.2006.01533.x [DOI] [Google Scholar]
- 27.Brown JE, McBride CS, Johnson P, Ritchie S, Paupy C, Bossin H, et al. Worldwide patterns of genetic differentiation imply multiple ‘domestications’ of Aedes aegypti, a major vector of human diseases. Proceedings of the Royal Society B: Biological Sciences. 2011;278(1717):2446–54. 10.1098/rspb.2010.2469 [DOI] [PMC free article] [PubMed] [Google Scholar]
- 28.Lovin DD, Washington KO, deBruyn B, Hemme RR, Mori A, Epstein SR, et al. Genome-based polymorphic microsatellite development and validation in the mosquito Aedes aegypti and application to population genetics in Haiti. BMC Genomics. 2009;10(590):1471–2164. [DOI] [PMC free article] [PubMed] [Google Scholar]
- 29.Peakall R, Smouse PE. GenAlEx 6.5: genetic analysis in Excel. Population genetic software for teaching and research—an update. Bioinformatics. 2012;28(19):2537–9. 10.1093/bioinformatics/bts460 . [DOI] [PMC free article] [PubMed] [Google Scholar]
- 30.Van Oosterhout C, Hutchinson WF, Wills DPM, Shipley P. Micro-checker: software for identifying and correcting genotyping errors in microsatellite data. Molecular Ecology Notes. 2004;4(3):535–8. 10.1111/j.1471-8286.2004.00684.x [DOI] [Google Scholar]
- 31.El Mousadik A, Petit RJ. High level of genetic differentiation for allelic richness among populations of the argan tree [Argania spinosa (L.) Skeels] endemic to Morocco. Theoret Appl Genetics. 1996;92(7):832–9. 10.1007/bf00221895 [DOI] [PubMed] [Google Scholar]
- 32.Goudet J. FSTAT (Version 1.2): A Computer Program to Calculate F-Statistics. Journal of Heredity. 1995;86(6):485–6. [Google Scholar]
- 33.Belkhir K BP, Chikhi L, Raufaste N and Bonhomme F. (1996–2004) GENETIX 4.05, logiciel sous Windows TM pour la génétique des populations. Laboratoire Génome, Populations, Interactions, CNRS UMR 5000, Université de Montpellier II, Montpellier (France).
- 34.Excoffier L, Laval G, Schneider S. Arlequin (version 3.0): An integrated software package for population genetics data analysis. Evolutionary Bioinformatics Online. 2005;1:47–50. . [PMC free article] [PubMed] [Google Scholar]
- 35.Pritchard JK, Stephens M, Donnelly P. Inference of Population Structure Using Multilocus Genotype Data. Genetics. 2000;155(2):945–59. [DOI] [PMC free article] [PubMed] [Google Scholar]
- 36.Earl D, vonHoldt B. STRUCTURE HARVESTER: a website and program for visualizing STRUCTURE output and implementing the Evanno method. Conservation Genet Resour. 2012;4(2):359–61. 10.1007/s12686-011-9548-7 [DOI] [Google Scholar]
- 37.Evanno G, Regnaut S, Goudet J. Detecting the number of clusters of individuals using the software structure: a simulation study. Molecular Ecology. 2005;14(8):2611–20. 10.1111/j.1365-294X.2005.02553.x [DOI] [PubMed] [Google Scholar]
- 38.Kopelman NM, Mayzel J, Jakobsson M, Rosenberg NA, Mayrose I. Clumpak: a program for identifying clustering modes and packaging population structure inferences across K. Mol Ecol Resour. 2015;12(10):1755–0998. [DOI] [PMC free article] [PubMed] [Google Scholar]
- 39.Jensen JL, Bohonak A.J., and Kelley S.T.. Isolation by distance, web service. BMC Genetics 6: 13 v323 http://ibdwssdsuedu/ 2005. [DOI] [PMC free article] [PubMed] [Google Scholar]
- 40.Paupy C, Le Goff G, Brengues C, Guerra M, Revollo J, Barja Simon Z, et al. Genetic structure and phylogeography of Aedes aegypti, the dengue and yellow-fever mosquito vector in Bolivia. Infection, Genetics and Evolution. 2012;12(6):1260–9. 10.1016/j.meegid.2012.04.012 [DOI] [PubMed] [Google Scholar]
- 41.da Costa-da-Silva AL, Capurro ML, Bracco JE. Genetic lineages in the yellow fever mosquito Aedes (Stegomyia) aegypti (Diptera: Culicidae) from Peru. Memórias do Instituto Oswaldo Cruz. 2005;100:539–44. [DOI] [PubMed] [Google Scholar]
- 42.Hall TA. BioEdit: A user-friendly biological sequence alignment editor and analysis program for Windows 95/98/NT. Nucleic Acids Symposium Series 1999;41:95–8. [Google Scholar]
- 43.Tajima F. The Effect of Change in Population Size on DNA Polymorphism. Genetics. 1989;123(3):597–601. . [DOI] [PMC free article] [PubMed] [Google Scholar]
- 44.Fu YX, Li WH. Statistical tests of neutrality of mutations. Genetics. 1993;133(3):693–709. [DOI] [PMC free article] [PubMed] [Google Scholar]
- 45.Fu YX. Statistical tests of neutrality of mutations against population growth, hitchhiking and background selection. Genetics. 1997;147(2):915–25. [DOI] [PMC free article] [PubMed] [Google Scholar]
- 46.Rozas J, Sanchez-DelBarrio JC, Messeguer X, Rozas R. DnaSP, DNA polymorphism analyses by the coalescent and other methods. Bioinformatics. 2003;19(18):2496–7. [DOI] [PubMed] [Google Scholar]
- 47.Bandelt HJ, Forster P, Rohl A. Median-joining networks for inferring intraspecific phylogenies. Mol Biol Evol. 1999;16(1):37–48. [DOI] [PubMed] [Google Scholar]
- 48.Fluxus Technology ltd 2004–2015 NETWORK 4.6.1.3. http://wwwfluxus-engineeringcom/sharenethtm.
- 49.Ronquist F, Huelsenbeck JP. MrBayes 3: Bayesian phylogenetic inference under mixed models. Bioinformatics. 2003;19(12):1572–4. [DOI] [PubMed] [Google Scholar]
- 50.Perrier X, Flori A., Bonnot F. Data analysis methods Hamon P, Seguin M, Perrier X, Glaszmann J C Ed, Genetic diversity of cultivated tropical plants. 2003;Enfield, Science Publishers; Montpellier.: 43–76. [Google Scholar]
- 51.Monteiro FA, Schama R, Martins AJ, Gloria-Soria A, Brown JE, Powell JR. Genetic Diversity of Brazilian Aedes aegypti: Patterns following an Eradication Program. PLoS Negl Trop Dis. 2014;8(9):e3167 10.1371/journal.pntd.0003167 [DOI] [PMC free article] [PubMed] [Google Scholar]
- 52.Powell JR, Tabachnick WJ. History of domestication and spread of Aedes aegypti—a review. Mem Inst Oswaldo Cruz. 2013;1:11–7. [DOI] [PMC free article] [PubMed] [Google Scholar]
- 53.Shineberg D. They came for Sandalwood. A study of the sandalwood trade in the South-West Pacific, 1830–1865. 1967. [Google Scholar]
- 54.IRD. Atlas de la Nouvelle-Calédonie IRD Éditions, Marseille, France. 2012.
- 55.Survey. NZDoLa. Atlas of the South Pacific. Wellington New Zealand Government Printing Office. 1986. [Google Scholar]
- 56.InstitutPasteurdeNouvelle-Calédonie. IPNC—Rapport technique Année 2003 www.institutpasteur.nc/rapports-dactivites/2003.
- 57.Laille M, Fauran P, Rodhain F. [The presence of Aedes (Stegomyia) albopictus in the Fiji Islands]. Bull Soc Pathol Exot. 1990;83(3):394–8. [PubMed] [Google Scholar]
- 58.Guillaumot L, Ofanoa R, Swillen L, Singh N, Bossin HC, Schaffner F. Distribution of Aedes albopictus (Diptera, Culicidae) in southwestern Pacific countries, with a first report from the Kingdom of Tonga. Parasit Vectors. 2012;5(247):1756–3305. [DOI] [PMC free article] [PubMed] [Google Scholar]
- 59.Guillaumot L. Entomological survey on Efate—Vanuatu to assess the statut of the mosquito Aedes albopictus. 2013;Doc. n°41/2013-IPNC-URE-EM/LG/DG, 7th of February 2013.
- 60.Roth A, Mercier A, Lepers C, Hoy D, Duituturaga S, Benyon E, et al. Concurrent outbreaks of dengue, chikungunya and Zika virus infections—an unprecedented epidemic wave of mosquito-borne viruses in the Pacific 2012–2014. Euro Surveill. 2014;19(41):20929 [DOI] [PubMed] [Google Scholar]
- 61.Hlaing T, Tun-Lin W, Somboon P, Socheat D, Setha T, Min S, et al. Mitochondrial pseudogenes in the nuclear genome of Aedes aegypti mosquitoes: implications for past and future population genetic studies. BMC Genetics. 2009;10(1):11 10.1186/1471-2156-10-11 [DOI] [PMC free article] [PubMed] [Google Scholar]
- 62.Paduan Kdos S, Ribolla PE. Mitochondrial DNA polymorphism and heteroplasmy in populations of Aedes aegypti in Brazil. J Med Entomol. 2008;45(1):59–67. [DOI] [PubMed] [Google Scholar]
- 63.Paupy C, Brengues C, Ndiath O, Toty C, Hervé J-P, Simard F. Morphological and genetic variability within Aedes aegypti in Niakhar, Senegal. Infection, Genetics and Evolution. 2010;10(4):473–80. 10.1016/j.meegid.2010.03.001 [DOI] [PubMed] [Google Scholar]
- 64.Marcombe S, Paris M, Paupy C, Bringuier C, Yebakima A, Chandre F, et al. Insecticide-driven patterns of genetic variation in the dengue vector Aedes aegypti in Martinique Island. PLoS One. 2013;8(10). [DOI] [PMC free article] [PubMed] [Google Scholar]
- 65.Rageau J. La répartition géographique des moustiques en Nouvelle-Calédonie et dépendances. CPS. 1958;Document technique n°117.
- 66.InstitutPasteurdeNouvelle-Calédonie. IPNC—Rapport technique Année 2003 www.institutpasteur.nc/rapports-dactivites/1996.
- 67.InstitutPasteurdeNouvelle-Calédonie. IPNC—Rapport technique Année 2003 www.institutpasteur.nc/rapports-dactivites/1999.
- 68.ISEE. Bilan économique et social 2014—Echanges extérieurs Institut de la Statistique et des Etudes Economiques Nouvelle-Calédonie. 2014.
- 69.Huerre M, Camprasse MA, Laille M. Problèmes posés par les épidémies de dengue. L'exemple des foyers d'Océanie. Situation mondiale actuelle et dans les DOM-TOM. Médecine et Maladies Infectieuses. 1995;25, Supplement 7(0):688–95. 10.1016/S0399-077X(05)80880-7. [DOI] [Google Scholar]
- 70.Lambrechts L, Chevillon C, Albright RG, Thaisomboonsuk B, Richardson JH, Jarman RG, et al. Genetic specificity and potential for local adaptation between dengue viruses and mosquito vectors. BMC Evol Biol. 2009;9(160):1471–2148. [DOI] [PMC free article] [PubMed] [Google Scholar]
- 71.Failloux AB, Vazeille M, Rodhain F. Geographic genetic variation in populations of the dengue virus vector Aedes aegypti. J Mol Evol. 2002;55(6):653–63. [DOI] [PubMed] [Google Scholar]
- 72.Tabachnick WJ. Nature, nurture and evolution of intra-species variation in mosquito arbovirus transmission competence. Int J Environ Res Public Health. 2013;10(1):249–77. 10.3390/ijerph10010249 [DOI] [PMC free article] [PubMed] [Google Scholar]
- 73.Tabachnick W. Genetics of Insect Vector Competence for Arboviruses In: Harris K, editor. Advances in Disease Vector Research. Advances in Disease Vector Research. 10: Springer; New York; 1994. p. 93–108. [Google Scholar]
Associated Data
This section collects any data citations, data availability statements, or supplementary materials included in this article.
Supplementary Materials
The colour indicates the geographical sample origin: blue represents American samples, green Asian samples, purple African samples, yellow Australian samples and red Pacific samples. Both axis represent 77.9% of the variability in the dataset.
(PDF)
N Number of individual analyzed. Roman numerals indicate the name of CO1 or ND4 haplotypes.
(PDF)
N corresponds to the number of sample belonging to this haplotype.
(PDF)
(PDF)
Data Availability Statement
All sequences files are available from the GenBank database (accession numbers KT313642 to KT313662).