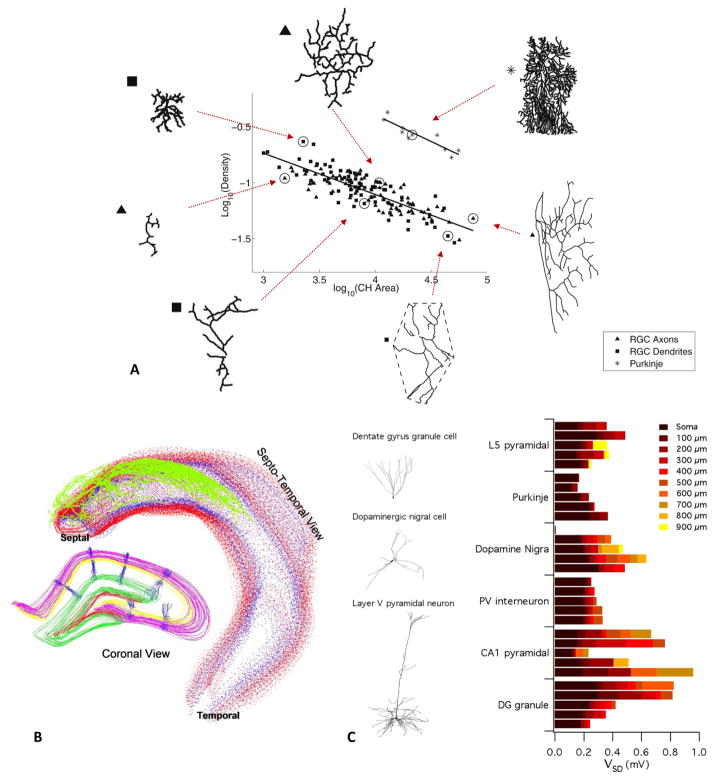
Figure 6. Examples of secondary discoveries made with reconstructions downloaded from NeuroMorpho.Org.
A) Structural design principle describing an inverse relationship between branching complexity and total arbor area in all neurons (adapted from Teeter and Stevens 2011). These data illustrate the case of relatively flat trees from retinal ganglion cells (RGC) and Purkinje cells. B) Space occupancy, dendritic overlap, and orientation of pyramidal cells in the rat hippocampus (Ropireddy and others 2012). The fully reconstructed axon of a single pyramidal cell (green) is embedded in the volumetric rendering of a digital reconstruction of the hippocampal tissue. In the left inset, the reconstructed dendritic trees of pyramidal cells from NeuroMorpho.Org are embedded in the same space. C) Neuron models with stochastically gated, identically distributed ion channels in distinct morphologies, exemplified on the left. On the right, the average standard deviations of the simulated membrane potentials are plotted for each morphological type as a function of increasing distance along the dendrite from the soma (adapted from Cannon and others 2010).

