

Abstract
Cytokine profiles in peritoneal dialysis effluent (PDE) vary among patients of continuous ambulatory peritoneal dialysis (CAPD), which may indicate the therapeutic efficiency of CAPD. We examined the cytokine profiles of PDE with stable CAPD and analyzed their relation with the peritoneal solute transport rate (PSTR). The peritoneal equilibration test (PET) was performed to evaluate peritoneal solute transport rate (PSTR) by calculating dialysate/plasma creatinine (D/P Cr). Patients were then divided into either low and low-average transport (L/A), or high and high average transport (H/A) groups according PET results. Overnight PDE were collected from 30 CAPD patients and various cytokines and growth factors were detected using the Luminex Flex Map 3D system. The concentrations of interleukin (IL)-6, monocyte chemoattractant protein (MCP)-1 and tumor necrosis factor (TNF)-α in dialysate were 66.4±59.8, 221±96.1 and 1.79±0.34 pg/mL respectively while IL-17A, IL-17F, IL-21, IL-22 or IL-23 could not be detected. Higher IL-6 levels were found in the H/A group as compared with the L/A group (P<0.05); however MCP-1, TNF-α, transforming growth factor (TGF)-β1 and VEGF levels were not significantly different between these two groups (P>0.05). We found that IL-6, MCP-1, vascular endothelial growth factor (VEGF) and TGF-β1 levels were closely correlated with each other and all significantly associated with D/P Cr. Multivariate analysis showed that D/P Cr was independently correlated with IL-6 and negatively correlated with serum albumin (r=-0.369, P=0.045). In conclusion, our study indicates that systemic analysis of cytokine profiles in PDE reveals the transport characteristics of CAPD patients. Long-term follow-up study should be necessary to further confirm the value of cytokine detection in evaluation of PD therapeutic efficiency.
Keywords: Peritoneal dialysis, inflammation, Luminex, MT, neovascularization
Introduction
Peritoneal dialysis (PD) is an effective alternative form of renal replacement therapy for patients with end-stage renal disease (ESRD). The efficiency of PD depends on the structural and functional integrity of the peritoneum. Accumulative evidence from both laboratory and clinical studies has highlighted that continuous exposure to bio-incompatible PD solutions, recurrent episodes of peritonitis and various factors other than those related to the PD technique (eg. uremic inflammation and primary kidney disease per se) lead to the damage of peritoneal structure and final dialysis failure [1-4].
Peritoneal inflammation and fibrosis, regulated by the cytokine network in the celiac immune system, is the most consistent change observed in the peritoneal tissues of patients who undergo a long-term PD therapy [4]. The micro-inflammation that occurs in peripheral circulation and peritoneal environment is a considerable risk factor for ESRD patients [5] associated with the increased peritoneal solute transport rate (PSTR) including increased technique failure and patients mortality. Several studies have revealed the relationship between PSTR and intraperitoneal cytokines based on the pathophysiologic mechanisms of the structural changes. The presence of certain cytokines in peritoneal dialysis effluent (PDE) probably leads to diminish peritoneal function. Previous studies mostly focused on the correlation between a specific cytokine and peritoneal function, which may be influenced by an abnormal cytokine network. Moreover, previous studies have revealed conflicting results about the relationship between local inflammation and membrane function associated with faster PSTR [6]. In this study, we applied to examine a series of inflammatory factors and growth factors at a single time point in PDE of patients undergoing PD treatment and evaluate the relationship between the cytokine profile and PSTR.
Materials and methods
Subjects
This study complied with the Declaration of Helsinki and was approved by the Committee on Research Ethic of Central South University, The Second Xiangya Hospital. A total of 30 patients were selected for the experimental group who were treated with PD from October 2012 to February 2013 in the Second Xiangya Hospital. Patients who had to be less than 70 years old and being treated with continuous ambulatory peritoneal dialysis (CAPD) (1.5% and 2.5% peritoneal dialysis solution, Baxter’s) with an unstable condition were excluded from this study (eg. tumors, systematic inflammation, peritonitis for 2 months before the follow-up, or abdominal operation history).
Clinical measurements
To collected the basic information, to record the biochemical and hematological routing assay and to calculate and assess the efficiency of PD and PSTR, which include clearance rate of creatinine (CCr), weekly urea clearance index (weekly Kt/Vurea), Estimated glomerular filtration rate (eGFR), the 4-hour dialysate creatinine /plasma creatinine (4-D/P Cr). The eGFR studies were carried out the reduced formula MDRD [7]. The weekly Kt/Vurea studies were the same way equal to the Manchester Royal Infirmary, Little Rock, AR, USA [8]. The study of 4-D/P Cr is from the classical Peritoneal Equilibrium Test (PET) (Table 1) [9].
Table 1.
Grouping standard of PET results
| Classification of transport feature | 4 h D/P Cr | 4 h dialysate glucose concentration (mmol/L) |
|---|---|---|
| High transport | 0.82~1.03 | 13-28 |
| High-average transport | 0.65~0.81 | 28-40 |
| Low-average transport | 0.50~0.64 | 40-53 |
| Low transport | 0.34~0.49 | 53-68 |
The cytokine/growth factor
The Luminex 3D system was applied to examine inflammatory factors (interleukin (IL)-6, monocyte chemoattractant protein (MCP)-1, tumor necrosis factor (TNF)-α, IL-17A, IL-17F, IL-21, IL-22, IL-23) and growth factors vascular endothelial growth factor (VEGF) and transforming growth factor (TGF)-β1 in PDE of patients undergoing PD treatment. Dialysate sampling was from an overnight dwell.
Statistical analysis
Statistical analysis was carried out using SPSS17.0 software (SPSS Inc., USA). Data were expressed as mean ± standard deviation (x±SD). Groups were compared using independent t-tests. Enumeration data were expressed as a percentage, and groups were compared using χ2 analysis. Correlation between two continuous variables was analyzed using Pearson correlation test. Multiple linear regression analysis was performed to estimate the factors related to PSTR. Value of all data were considered statistically significant at a value of P<0.05.
Results
Basic information of patients
A total of 30 CAPD patients were enrolled in this study with an average age of 46±10 years. Conditions included primary glomerular disease, hypertensive nephropathy, diabetic nephropathy and other renal disease. Basic clinical data are shown in Table 2.
Table 2.
Basic features and clinical data of peritoneal dialysis patients
| Index | Value |
|---|---|
| Age (years) | 46±10 |
| Male/female | 12 (40%)/18 (60%) |
| Causes of kidney failure | |
| Primary glomerular disease | 20 (66.7%) |
| Hypertensive nephropathy | 4 (13.3%) |
| Diabetic nephropathy | 2 (6.7%) |
| Other | 4 (13.3%) |
| BMI (kg/m2) | 23.3±3.18 |
| BSA (m2) | 1.63±0.16 |
| Dialysis time (month) | 11.5±16.9 |
| hs-CRP (mg/L) | 3.68±5.17 |
| 4 h D/P Cr | 0.63±0.10 |
| 4 h D/D0 glucose | 0.44±0.10 |
| 24 h ultrafiltration volume (mL) | 2292±276 |
| Total Kt/V (weekly Kt/Vurea) | 2.02±0.67 |
| Total CCr (L/week) | 69.9±20.7 |
| eGFR (L/week/1.73 m2) | 2.62±2.20 |
| 24 h urine volume (mL) | 667.7±470.8 |
| Hemoglobin (g/L) | 104±40.4 |
| Total cholesterol (mmol/L) | 5.35±1.17 |
| Triglyceride (mmol/L) | 1.63±0.68 |
Data were expressed as mean ± standard deviation or a percentage.
Analysis of cytokine profiles in PDE
The inflammatory factors (Figure 1) shows that the average levels of IL-6 (A, 66.4±59.8 pg/ml), MCP-1 (B, 221±96.1 pg/ml), TNF-α (C, 1.79±0.34 pg/ml). The concentrations of Th17 cell-associated cytokines such as IL-17A, IL-17F, IL-21, IL-22 and IL-23 were below the detection limit. The pro-angiogenesis factor VEGF average level was 19.3±26.6 pg/m (Figure 2A) and TGF-β1 indicates relatively high levels of (3312±1133 pg/mL) in PDE (Figure 2B).
Figure 1.
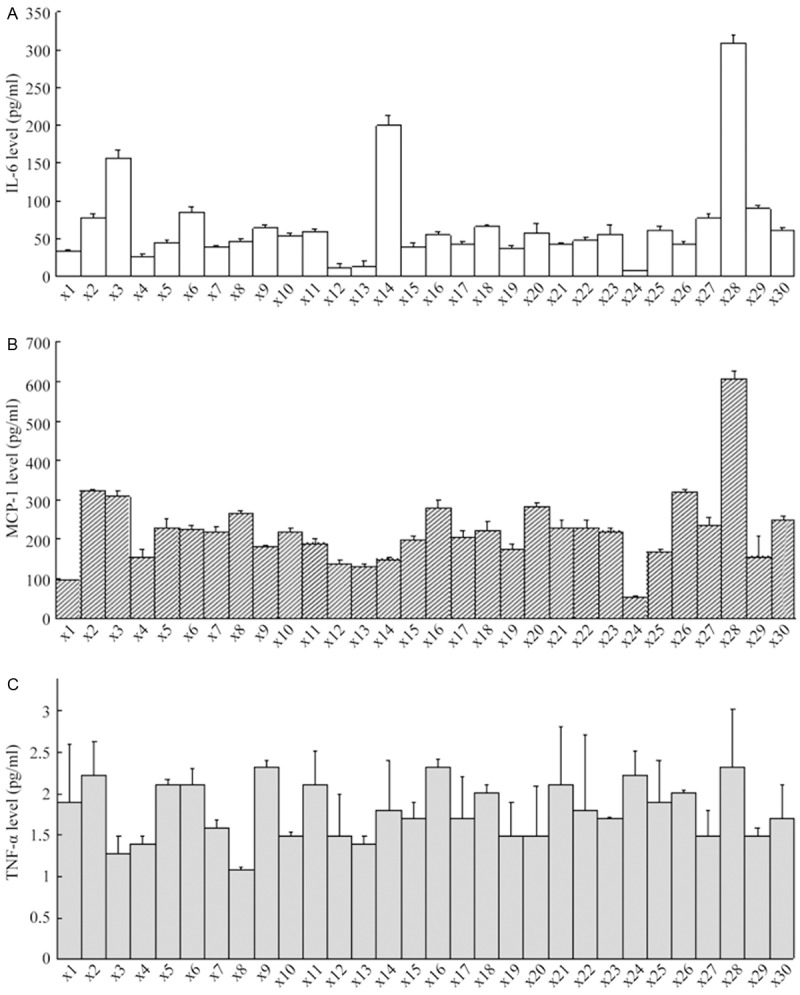
Detection of inflammatory factor profile in peritoneal dialysis effluent. Levels of IL-6 (A), MCP-1 (B), TNF-α (C) were expressed as means ± standard.
Figure 2.
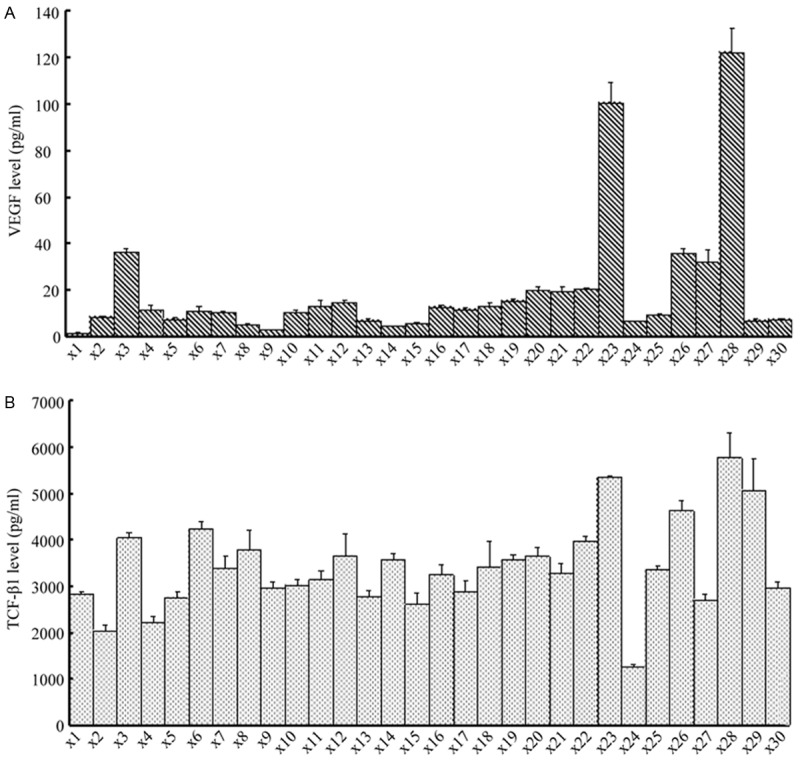
Detection of pro-angiogenesis, pro-EMT and fibrosis protein factor in peritoneal dialysis effluent. Levels of VEGF and TGF-β1 are expressed as mean ± standard deviation (x±SD) in individual patients.
Correlationanalysis of solute transport rate
Patients were divided into either low and low-average transport (L/A), or high and high average transport (H/A) groups according PET results. Basic information and laboratory result with no differences (P>0.05) of these two groups is shown in Table 3. The cytokine profiles in PDE showed that the IL-6 levels were significantly higher in the H/A group than in the L/A group. In contrast, MCP-1, TNF-α, TGF-β1 or VEGF did not show significantly differences (P>0.05).
Table 3.
Comparative analysis of patients’ information in independent groups of different solute transport rate
| L/A (n=15) | H/A (n=15) | P value | |
|---|---|---|---|
| Age (years) | 46.7±10.0 | 45.5±11.0 | 0.769 |
| Sex (male/female) | 7/8 | 5/15 | 0.273 |
| Dialysis time (months) | 9.3±6.9 | 13.7±23.0 | 0.476 |
| BMI (kg/m2) | 23.6±3.7 | 22.9±2.6 | 0.556 |
| Blood pressure (mmHg) | 160±26.5/94.1±10.5 | 152±28.4/89.3±9.5 | 0.451/0.205 |
| 24 h urinary volume (mL) | 592±414.2 | 743.3±524.7 | 0.388 |
| Left abdominal dialysate outflow (mL) | 2380.0±226.6 | 2203.3±299.1 | 0.079 |
| 24 h ultrafiltration volume (mL) | 1000±572.9 | 793±565.0 | 0.328 |
| Blood sugar (mmol/L) | 5.1±1.2 | 4.9±0.4 | 0.702 |
| Blood BUN (mmol/L) | 21.0±5.2 | 22.8±7.2 | 0.423 |
| Blood CRE (μmol/L) | 998.3±405.6 | 999.25±275.2 | 0.994 |
| Hemoglobin (g/L) | 111.6±53.1 | 97.3±21.2 | 0.34 |
| Albumin (g/L) | 38.5±4.1 | 36.7±4.1 | 0.236 |
| Total cholesterol (mmol/L) | 5.5±1.3 | 5.2±1.1 | 0.489 |
| hs-CRP (mg/L) | 3.5±3.0 | 3.8±6.7 | 0.271a |
| Total Kt/V (weekly Kt/Vurea) | 2.0±0.8 | 2.1±0.6 | 0.781 |
| Total Ccr (L/week) | 67.7±23.8 | 72.1±17.7 | 0.57 |
| eGFR (L/week/1.73 m2) | 2.7±2.4 | 2.5±2.0 | 0.782 |
| 4 h D/P Cr | 0.55±0.06 | 0.71±0.06 | <0.001** |
| IL-6 (pg/mL) | 41.3±18.0 | 91.5±75.7 | 0.012a,* |
| TNF-α (pg/mL) | 1.7±0.4 | 1.8±0.3 | 0.427 |
| MCP-1 (pg/mL) | 192.9±66.3 | 250.0±113.9 | 0.104 |
| TGF-β1 (pg/mL) | 3025.7±941.5 | 3598.7±1264.4 | 0.170 |
| VEGF (pg/mL) | 14.9±24.1 | 23.8±29.0 | 0.69a |
Data are expressed as mean ± standard deviation or a percentage.
P<0.05;
P<0.01;
Data were logarithmically transformed prior to statistical analysis.
Analyses of peritoneal transport rate-related factors were carried out using Pearson correlation test (Figure 3). D/P Cr was negatively correlated with the volume of PDE (r=-0.496, P=0.005). For inflammatory cytokines, IL-6 and MCP-1 levels showed significant positive correlation with PSTR (D/P Cr) (r=0.656, P<0.001 and r=0.620, P<0.001) (Figure 3A, 3B). TNF-α was not significant correlated with D/P Cr (r=0.209, P=0.268) (Figure 3F). VEGF levels were positively correlated with D/P Cr (r=0.425, P=0.019) (Figure 3D). TGF-β1 levels were significantly positively correlated with D/P Cr (r=0.624, P<0.001) (Figure 3C). Among circulating inflammation markers, serum albumin was negatively correlated with D/P Cr (r=-0.369, P=0.045) (Figure 3E), whereas the correlation of serum hs-CRP with D/P Cr was not significant (r=-0.201, P=0.296) (Figure 3G).
Figure 3.
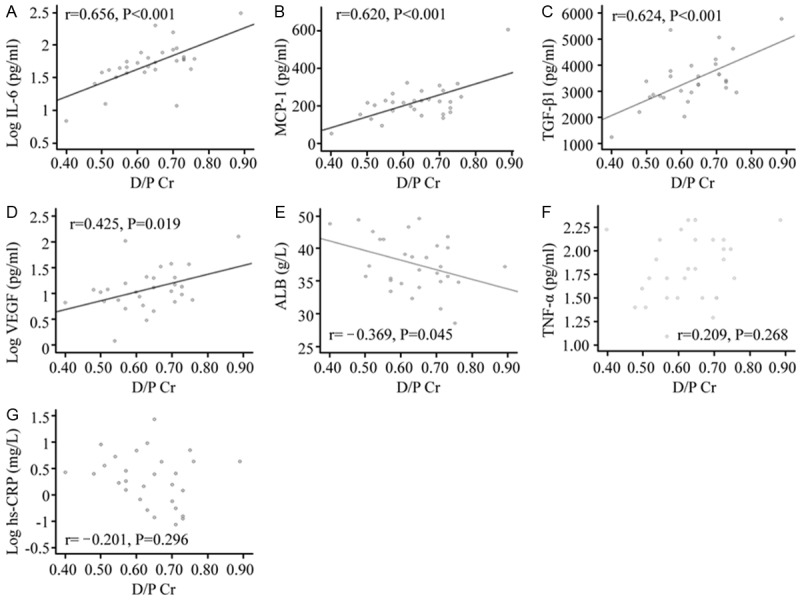
The correlation of D/P Cr with each factor in peritoneal dialysis effluent. The correlations of L-6 level (A), MCP-1 level (B) and TGF-β1 level (C) with D/P Cr were significantly positive (P<0.01). VEGF level (D) was positively correlated with D/P Cr (P=0.019; P<0.05). Serum albumin (E) was slightly positively correlated with D/P Cr (P=0.045; P<0.05). The correlations of TNF-α level (F) and hs-CRP (G) with D/P Cr are not significant (P>0.05). IL-6 level, VEGF level and hs-CRP were analyzed after logarithmic transformation.
Correlational analysis of cytokine profiles in PDE
Multiple linear regression analysis for several D/P Cr-related factors was performed to analyze the independent factors influencing PSTR (Table 4). Correlation analysis among various cytokines in PDE was carried out using Pearson tests. We found that level of IL-6 inflammatory cytokine in PDE was still an independent factor affecting the underlying PSTR. As an important control, each cytokine was not significantly correlated with the ultrafiltration volume (data not shown).
Table 4.
Multiple linear regression analysis of the of solute transport rate-related factors
| 95% credibility interval | Standard coefficient | B | P value | ||
|---|---|---|---|---|---|
|
| |||||
| Lower limit | Upper limit | ||||
| Constant | 0.129 | 0.444 | 0.287 | 0.001 | |
| Log IL-6 | 0.113 | 0.295 | 0.656 | 0.204 | <0.001 |
Volume of peritoneal dialysis effluent left in abdomen, IL-6, MCP-1, VEGF, TGF-β1, serum albumin and hs-CRP were included in the regression analysis.
As to the correlation analysis of inflammatory cytokines in PDE, IL-6 levels were significantly positively correlated with levels of MCP-1 (r=0.655, P<0.001) (Figure 4A), whereas TNF-α levels were not significantly correlated with either levels of IL-6 (r=0.150, P=0.428) or MCP-1 (r=0.217, P=0.250) (Figure 4B, 4C).
Figure 4.
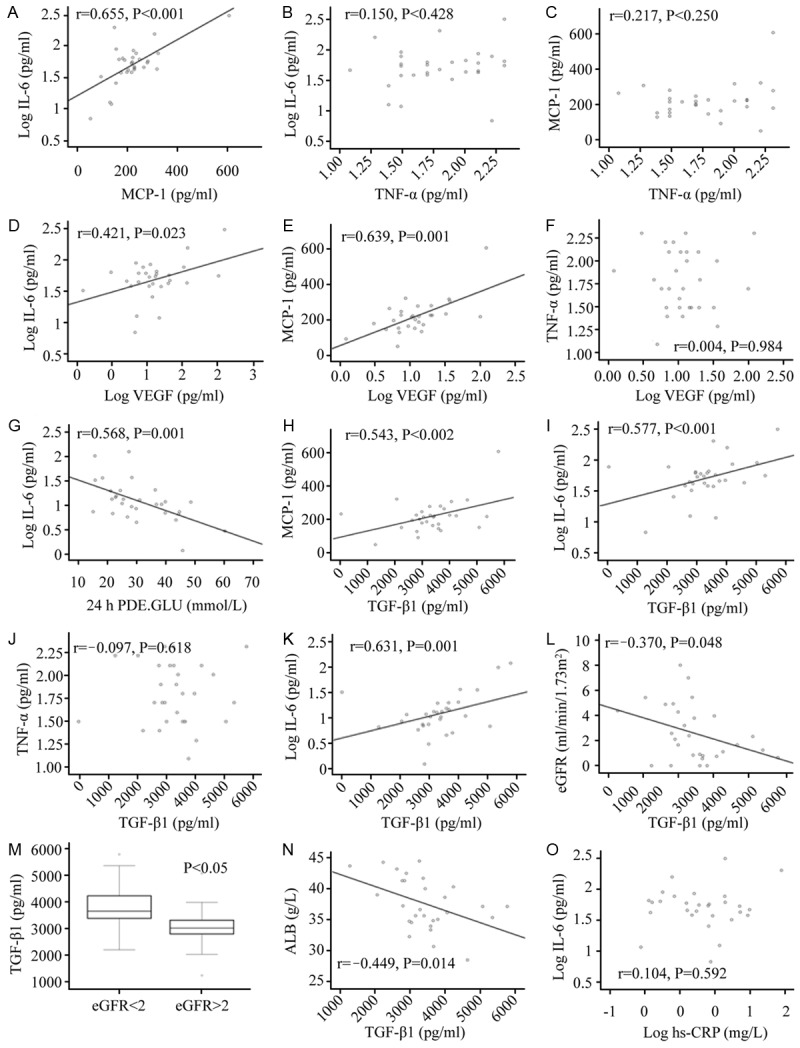
(A-C) Correlation analysis of inflammatory cytokines in peritoneal dialysis effluent. IL-6 level in peritoneal dialysis effluent was significantly positively correlated with MCP-1 level (A), whereas TNF-α level was not significantly correlated with levels of IL-6 (B) or MCP-1 (C). IL-6 was analyzed after logarithmic transformation. (D-G) The correlation of VEGF with inflammatory factors and 24 h glucose concentration in peritoneal dialysis effluent. VEGF was positively correlated with IL-6 (D), MCP-1 (r=0.639, P<0.001) (E), was not significantly correlated with TNF-α (F), and was significantly negatively correlated with 24 h dialysate glucose concentration (G). IL-6 was analyzed after logarithmic transformation. (H-K) The correlation analysis of TGF-β1 with inflammatory factors and VEGF in peritoneal dialysis effluent. TGF-β1 was positively correlated with inflammatory cytokines IL-6 (H), MCP-1 (I), and was not significantly correlated with TNF-α (J). TGF-β1 was significantly positively correlated with pro-angiogenesis factor VEGF (K). (L, M) Correlational analysis of TGF-β1 in peritoneal dialysis effluent with eGFR. There was weak negative correlation between TGF-β1 and eGFR (L). Effluent TGF-β1 levels of patients with eGFR ≥2 ml/min/1.73 m2 were significantly lower than that of patients with eGFR <2 mL/min/1.73 m2 (M). (N, O) The related factor analysis of high-sensitivity C-reactive protein and serum albumin. Serum ALB was negatively correlated with TGF-β1 in peritoneal dialysis effluent (r=-0.449, P=0.014) (N), there was no significant correlation between hs-CRP and cytokine in peritoneal fluid, illustrated in (O).
VEGF was positively correlated with inflammatory cytokines IL-6 (r=0.421, P=0.023) and MCP-1 (r=0.639, P<0.001) (Figure 4D, 4E), correlated with but not TNF-α (r=-0.004, P=0.984) (Figure 4F). In addition, VEGF was significantly positively correlated with 24 h dialysate urea nitrogen concentration (r=0.488, P=0.006) (Figure 4G), and 24 h dialysate creatinine concentration (r=0.557, P=0.001), while being significantly negatively correlated with 24 h dialysate glucose concentration (r=-0.568, P=0.001).
TGF-β1 was positively correlated with levels of inflammatory cytokines IL-6 (r=0.577, P=0.001) and MCP-1 (r=0.543, P=0.002) (Figure 4H, 4I), correlated with but not TNF-α (r=-0.097, P=0.618) (Figure 4J). We also found that TGF-β1 was significantly positively correlated with VEGF (r=0.631, P<0.001) (Figure 4K).
TGF-β1 was slightly negatively correlated with eGFR (r=-0.370, P=0.048) (Figure 4L); the effluent levels of TGF-β1 inpatients (n=16) with eGFR ≥2 mL/min/1.73 m2 were significantly lower than that of patients (n=14) where eGFR <2 mL/min/1.73 m2 (P=0.018) (Figure 4M). In addition, there was a large positive correlation between eGFR and urine volume (r=0.812, P<0.001).
According to Pearson correlation analysis, it is indicated that serum ALB was negatively correlated with TGF-β1 in PDE (r=-0.449, P=0.014) (Figure 4N), while we observed no significant correlation between hs-CRP and cytokines IL-6 in peritoneal fluid (Figure 4O).
Discussion
This study, for the first time, revealed relationship between cytokines profile in the peritoneal effluent dialysates and PSTR in CAPD patients. Previous studies suggested baseline serum IL-6 was an independent predictor of composite concentrations to predict cardiovascular events [10], but little is known about the role of inflammatory cytokine in PD efficiency. In this study, we identified IL-6 as the major pro-inflammatory cytokine affecting PSTR. Some studies have found that IL-6 in PDE is related to decline of peritoneal function as well as ultrafiltration volume [11]. And the level of dialysate IL-6 was shown that to be positively correlated with the underlying PSTR in PD patients [12]. Our clinical assessment showed similar results. Furthermore, PSTR was significantly positively related to levels of dialysate IL-6, with IL-6 levels of the high PSTR group being significantly higher than that of the low PSTR group. The study suggested that IL-6 as an independent factor plays a key role in regulating PSTR.
We found a close correlation between IL-6 and MCP-1 indicating that chronic inflammation may contributes to increased PSTR. Early studies showed that MCP-1 is an important monocyte chemotactic factor for PD-related peritonitis. High MCP-1 was also found in effluence of non-septic patients with CAPD [13], probably participating in angiogenesis [14]. In this study also showed positive correlation with MCP-1 and PSTR. The close correlation of MCP-1 and VEGF favors a role of MCP-1 in the formation of neovessels as well, which is also well-known biological function in proinflammatory responses. Furthermore, this study showed that MCP-1 was associated with pro-EMT and fibrosis factor TGF-β1. It was reported by a recent in vivo study that MCP-1 could cause the transdifferentiation of peritoneal mesothelium cells, which can be inhibited by TGF-β1 antibody [15]. Low expression of MCP-1 may also induce morphological changes in a rat PD model, suggesting that MCP-1 may be directly involved in the EMT process induced by TGF-β1 [7].
In addition, some studies have shown that increased effluent IL-6 is positively correlated with increased in levels of pro-angiogenesis factor VEGF [16]. In line with previous studies, we confirmed the correlation between effluent IL-6 levels and neovascularization in stable CAPD patients. Chronic inflammation may accelerate the secretion of TGF-β1 and may eventually lead to EMT, which is regarded as the initiation of peritoneal fibrosis. TNF-α is produced by the activated macrophage as one of the classical inflammation factors which may associate with the secretion of IL-6 in IPD patients [7]. Consistent with previous study [17], we did not find a correlation between PSTR and TNF-α. In the present study, our finding of low expression of TNF-α may be suggestive of inadequate circulation diffusion or clearance.
Additionally, in this study, Th17 cell-related factors were below the detection limit. However, increased production of IL-17A was documented in a study on peritoneal dialysis-related peritonitis, which may represent an early protective immune response [18]. It was confirmed by the present study that concentrations of TGF-β and IL-6 increased in effluent, both of which are important regulatory factors [19] driving un-sensitized T cells differentiate to Th17 cells. Thus, undetectable IL-17 may have resulted from its comparatively low expression and the dilution by a large volume of dialysate.
Neovessel formation is considered the most significant cause leading to peritoneal malfunction. It has been shown that a certain part of the peritoneal cavity produces VEGF inpatients with long-period PD, and that VEGF levels slightly increase in high PSTR [20]. In this study demonstrated the close relationship between neovascularization and solute transport. And the vessels involved with solute transport may develop more promptly resulting in a higher rate of transport when the glucose concentration gradient descends faster and more strongly. Moreover, we also found a significant correlation between VEGF and TGF-β1, the latter being the transdifferentiation marker of epithelial cells.
Additionally, there are considerable controversies about the relationship between PSTR and systemic inflammation or complications reported [12]. Our study suggests that serum high-sensitivity CRP is not remarkably correlated with PSTR, which is in line with previous studies. And the role of the hypoalbuminemia in PSTR could not be conclusively established, although the data show it was slightly correlated with PSTR. TGF-β1 is well known as an important factor in promoting the EMT [10]. However, little is known about the association between TGF-β1 and PSTR. The detection of TGF-β1 in PDE in this study suggests that D/P Cr and PSTR accompany the increase in TGF-β1. Similarly, TGF-β1 in PDE was negatively correlated with albumin. Therefore, further investigation is needed to elucidate whether the relationship among ALB, PSTR, and TGF-β1.
Long-term exposure to non-physiological factors such as PD can lead to local chronic inflammation. The current data indicates that when chronic inflammation occurs in the peritoneum, certain inflammatory cytokines, pro-angiogenesis factor, and pro-EMT and fibrosis factors are likely to affect the peritoneal transport function through some unknown mechanisms. The relationships between these important inflammatory cytokines and peritoneal function have been studied previously and many of the results are consistent with present study. While these studies have focused on only one or a few cytokines, we applied a global and follow-up screening on a series of cytokines/growth factors to assess peritoneal dialysis efficacy.
Conclusion
Our study indicates that systemic analysis of cytokine profiles in PDE reveals the transport characteristics of CAPD patients. Especially D/P Cr could be independently predicted by dialysate IL-6. The relationship between systemic micro-inflammatory makers and PSTR was still obscure. Long-term follow-up study should be necessary to further confirm the value of cytokine detection in evaluation of PD therapeutic efficiency.
Acknowledgements
This work was supported by the National Natural Science Foundation of China (No. 81070610).
Disclosure of conflict of interest
None.
References
- 1.Lambie M, Davies SJ. Longitudinal study of small solute transport and peritoneal protein clearance in peritoneal dialysis patients. Clin J Am Soc Nephrol. 2014;9:326–334. doi: 10.2215/CJN.04420413. [DOI] [PMC free article] [PubMed] [Google Scholar]
- 2.Davies SJ. Peritoneal solute transport and inflammation. Am J Kidney Dis. 2014;64:978–986. doi: 10.1053/j.ajkd.2014.06.030. [DOI] [PubMed] [Google Scholar]
- 3.La Milia V, Limardo M, Cavalli A, Crepaldi M, Locatelli F. Transport of peritoneal membrane assessed before and after the start of peritoneal dialysis. Nephrol Dial Transplant. 2009;24:2894–2898. doi: 10.1093/ndt/gfp151. [DOI] [PubMed] [Google Scholar]
- 4.Rumpsfeld M, McDonald SP, Johnson DW. Higher peritoneal transport status is associated with higher mortality and technique failure in the Australian and New Zealand peritoneal dialysis patient populations. J Am Soc Nephrol. 2006;17:271–278. doi: 10.1681/ASN.2005050566. [DOI] [PubMed] [Google Scholar]
- 5.Carrero JJ, Stenvinkel P. Inflammation in end-stage renal disease-what have we learned in 10 years? Semin Dial. 2010;23:498–509. doi: 10.1111/j.1525-139X.2010.00784.x. [DOI] [PubMed] [Google Scholar]
- 6.Lambie M, Chess J, Donovan KL, Kim YL, Do JY, Lee HB, Noh H, Williams PF, Williams AJ, Davison S, Dorval M, Summers A, Williams JD, Bankart J, Davies SJ, Topley N. Independent effects of systemic and peritoneal inflammation on peritoneal dialysis survival. J Am Soc Nephrol. 2013;24:2071–2080. doi: 10.1681/ASN.2013030314. [DOI] [PMC free article] [PubMed] [Google Scholar]
- 7.Lee SH, Kang HY, Kim KS, Nam BY, Paeng J, Kim S, Li JJ, Park JT, Kim DK, Han SH, Yoo TH, Kang SW. The monocyte chemoattractant protein-1 (MCP-1)/CCR2 system is involved in peritoneal dialysis-related epithelial-mesenchymal transition of peritoneal mesothelial cells. Lab Invest. 2012;92:1698–1711. doi: 10.1038/labinvest.2012.132. [DOI] [PubMed] [Google Scholar]
- 8.Chatoth DK, Golper TA, Gokal R. Morbidity and mortality in redefining adequacy of peritoneal dialysis: a step beyond the National Kidney Foundation Dialysis Outcomes Quality Initiative. Am J Kidney Dis. 1999;33:617–632. doi: 10.1016/s0272-6386(99)70212-x. [DOI] [PubMed] [Google Scholar]
- 9.Cano F, Sanchez L, Rebori A, Quiroz L, Delucchi A, Delgado I, Aguilar MA, Azócar M, Castro F, Ibacache MJ, Cuevas M, Esquivel M. The short peritoneal equilibration test in pediatric peritoneal dialysis. Pediatr Nephrol. 2010;25:2159–2164. doi: 10.1007/s00467-010-1566-2. [DOI] [PubMed] [Google Scholar]
- 10.Yáñez-Mó M, Lara-Pezzi E, Selgas R, Ramírez-Huesca M, Domínguez-Jiménez C, Jiménez-Heffernan JA, Aguilera A, Sánchez-Tomero JA, Bajo MA, Alvarez V, Castro MA, del Peso G, Cirujeda A, Gamallo C, Sánchez-Madrid F, López-Cabrera M. Peritoneal dialysis and epithelial-to-mesenchymal transition of mesothelial cells. N Engl J Med. 2003;348:403–413. doi: 10.1056/NEJMoa020809. [DOI] [PubMed] [Google Scholar]
- 11.Jelicic I, Ljutic D, Sain M, Kovacic V, Radic J. Influence of local inflammation of the peritoneal membrane on diuresis and residual renal function in patients treated with peritoneal dialysis. J Artif Organs. 2012;15:65–70. doi: 10.1007/s10047-011-0603-7. [DOI] [PubMed] [Google Scholar]
- 12.Oh KH, Jung JY, Yoon MO, Song A, Lee H, Ro H, Hwang YH, Kim DK, Margetts P, Ahn C. Intra-peritoneal interleukin-6 system is a potent determinant of the baseline peritoneal solute transport in incident peritoneal dialysis patients. Nephrol Dial Transplant. 2010;25:1639–1646. doi: 10.1093/ndt/gfp670. [DOI] [PubMed] [Google Scholar]
- 13.Visser CE, Tekstra J, Brouwer-Steenbergen JJ, Tuk CW, Boorsma DM, Sampat-Sardjoepersad SC, Meijer S, Krediet RT, Beelen RH. Chemokines produced by mesothelial cells: huGRO-alpha, IP-10, MCP-1 and RANTES. Clin Exp Immunol. 1998;112:270–275. doi: 10.1046/j.1365-2249.1998.00592.x. [DOI] [PMC free article] [PubMed] [Google Scholar]
- 14.Roy A, Kolattukudy PE. Monocyte chemotactic protein-induced protein (MCPIP) promotes inflammatory angiogenesis via sequential induction of oxidative stress, endoplasmic reticulum stress and autophagy. Cell Signal. 2012;24:2123–2131. doi: 10.1016/j.cellsig.2012.07.014. [DOI] [PubMed] [Google Scholar]
- 15.Margetts PJ, Kolb M, Galt T, Hoff CM, Shockley TR, Gauldie J. Gene transfer of transforming growth factor-beta1 to the rat peritoneum: effects on membrane function. J Am Soc Nephrol. 2001;12:2029–2039. doi: 10.1681/ASN.V12102029. [DOI] [PubMed] [Google Scholar]
- 16.Feurino LW, Zhang Y, Bharadwaj U, Zhang R, Li F, Fisher WE, Brunicardi FC, Chen C, Yao Q, Min L. IL-6 stimulates Th2 type cytokine secretion and upregulates VEGF and NRP-1 expression in pancreatic cancer cells. Cancer Biol Ther. 2007;6:1096–1100. doi: 10.4161/cbt.6.7.4328. [DOI] [PubMed] [Google Scholar]
- 17.Cooker LA, Luneburg P, Holmes CJ, Jones S, Topley N. Interleukin-6 levels decrease in effluent from patients dialyzed with bicarbonate/lactate-based peritoneal dialysis solutions. Perit Dial Int. 2001;3:S102–S107. [PubMed] [Google Scholar]
- 18.Wang HH, Lee TY, Lin CY. Kinetics and involvement of interleukin-17 in the outcome of peritonitis in nondiabetic patients undergoing peritoneal dialysis. J Chin Med Assoc. 2011;74:11–15. doi: 10.1016/j.jcma.2011.01.002. [DOI] [PubMed] [Google Scholar]
- 19.Korn T, Bettelli E, Oukka M, Kuchroo VK. IL-17 and Th17 Cells. Annu Rev Immunol. 2009;27:485–517. doi: 10.1146/annurev.immunol.021908.132710. [DOI] [PubMed] [Google Scholar]
- 20.Pecoits-Filho R, Araujo MR, Lindholm B, Stenvinkel P, Abensur H, Romão JE Jr, Marcondes M, De Oliveira AH, Noronha IL. Plasma and dialysate IL-6 and VEGF concentrations are associated with high peritoneal solute transport rate. Nephrol Dial Transplant. 2002;17:1480–1486. doi: 10.1093/ndt/17.8.1480. [DOI] [PubMed] [Google Scholar]