

Abstract
To determine whether contrast-enhanced transrectal ultrasound (CE-TRUS) is superior to transrectal ultrasound (TRUS) on diagnosis of prostate cancer, 317 patients were processed TRUS examination with or without SonoVue, then biopsy was performed. Sensitivity, specificity, accuracy, positive predictive value (PPV) and negative predictive value (NPV) of two techniques were compared in multiple subgroups of PSA level, Digital rectal examination (DRE) and prostate volume on biopsy results. In PSA 4-10 ng/ml and DRE negative groups, CE-TRUS had greater sensitivity and accuracy compared with TRUS by patient (P = .004 and .003; .013 and .005 respectively) and greater sensitivity, accuracy, PPV and NPV by core. When prostate volume was 45-65 ml, CE-TRUS had greater specificity and accuracy by patient and all diagnostic performances were statistically significant by core. CE-TRUS is superior to TRUS on diagnosis of prostate cancer in a designed patient population with lower PSA level, DRE negative findings and modest prostate volume.
Keywords: Prostate cancer, ultrasound, contrast agent, biopsy
Introduction
Prostate cancer is one of the major public health issues facing the male population in the world. TRUS is the most important tool for diagnosing prostate cancer by guiding prostate biopsies. TRUS targeted a visual lesion increased the detection rate about two times compared with systematic biopsy, but also missed about 30% cancer [1,2]. Microvessel density within the prostate demonstrated a clear association of increased microvessel density with the presence of carcinoma [3]. Colour/power Doppler has been proposed as a mean to detect tumor neovascularity but it may not have sufficient resolution to detect new microvessels [1,2,4,5]. The currently used ultrasound contrast agents consist of microbubbles with a diameter smaller than red blood cells. So CE-TRUS can observe these new microvessels [6]. Some reports demonstrate that CE-TRUS targeted biopsy increased the detection of prostate cancer with fewer biopsy cores [7-17]. Moreover, Halpern et al. [15] reported that CE-TRUS technique allowed identification of higher Gleason score lesions, which is important for defining prognosis and deciding treatment. But some reports say CE-TRUS not only has limited diagnosis efficiency but also time consuming and costly [18-20]. The real advantages of CE-TRUS still remain controversial [21]. The variable degree of clinical characteristics of patients may be largely responsible for the variation results in previous studies.
Most comparative studies have analyzed detection rates (the number of prostate cancer cases found, divided by the total number of patients) of CE-TRUS and systematic biopsy [10-14,18]. In clinical practice, TRUS for targeting biopsies is the primary technique currently. If CE-TRUS is superior to TRUS, that will be much more valuable. Moreover, the diagnostic performance parameters-sensitivity, specificity, PPV, NPV and accuracy of TRUS and CE-TRUS have seldom been evaluated [19,20], especially in different clinical characteristics. The sensitivity and PPV parameters are answers to the question, “What is the probability that I have prostate cancer when TRUS or CE-TRUS diagnosed positive?” Adversely, the specificity and NPV parameters are answers to the question, “What is the probability that I have prostate cancer after TRUS or CE-TRUS diagnosed negative?” In order to address these topics, a clinician needs to know all the parameters.
The purpose of our study was to find the real advantages of CE-TRUS. We compared the diagnostic performance (sensitivity, specificity, PPV, NPV and accuracy) of transrectal ultrasound (TRUS) and contrast-enhanced transrectal ultrasound (CE-TRUS) on prostate cancer in different clinical characteristics (PSA level, DRE findings and prostate volume).
Methods
Patients
The retrospective study was approved by the Ethics Committee of Hospital and written patient informed consent was obtained from each patient before the examination and biopsy. From June 2010 to November 2011, 317 patients who were scheduled for prostate biopsy because of an elevated PSA level (≥ 4.0 ng/ml) were enrolled. Excluded criterion referred to the previous literatures reported on prostate biopsy and SonoVue application [20]. Patients whose cancer had broken through prostate capsule and had mass outside of prostate were excluded in our study because the volume of prostate cannot be evaluated. Patients whose PSA was higher than 100 ng/mL were excluded. Biopsy preparation is the same as the previous literature [20]. All patients had not previously undergone biopsy. DRE was performed before TRUS examination, and was recorded as with (DRE positive) or without (DRE negative) suspicion of prostate cancer.
TRUS and CE-TRUS examination
All examinations were performed using a MyLab 90 scanner (Esaote SpA, Genoa, Italy) and a 3-9 MHz EC1123 probe by a radiologist who was blinded to the clinical information. The radiologist did the examination according to the protocol we designed. First, gray-scale and power Doppler imaging were performed. Standard transverse and longitudinal scanning were performed throughout the prostate to assess the structure and volume that were calculated using the prolate ellipse formula. Then CE-TRUS was performed using contrast-tuned imaging (CnTI) technique. The imaging conditions were as follows: frequency, general-M mode; gain, 50%; derated pressure, 50 kPa; Depth, 45-50 mm. No parameter was changed during the examination. The ultrasound contrast agent was SonoVue (Bracco SpA, Milan, Italy). 2.4 ml of SonoVue was administrated via a peripheral vein in a bolus fashion. Scanning was started 2-3 seconds after microbubbles reach the prostate capsule, following a standard sequence of transverse imaging from base to apex (5-6 s), then from apex to base, and repeated. Scanning was lasted continuously for about 90 seconds. The overall examination time was about 10-15 minutes. Cineloops were obtained during the scanning for image review. During the examination, attention was paid to minimize the probe pressure on the rectal wall to avoid obliterating signals from small vessels of the peripheral glands that faced the probe.
Image analysis
After the examination, we analyzed the imaging. The images of TRUS were analyzed by 2 radiologists who were blinded to the clinical information. The images of CE-TRUS were analyzed by 2 other radiologists who were blinded to the clinical and baseline imaging information. If a disagreement was found, another senior radiologist would review the image until a consensus was achieved. We focused on the peripheral zone only and divided prostate to six areas (bilateral base, mid and apex). Radiologists gave their comments according to the following criterions on the basis of our clinical experience and the previous literatures [4,7-19,22].
TRUS
(1) focal hypoechoic mass; (2) focal contour bulge; (3) ill-defined of peripheral zone and transition zone; (4) focal asymmetric/increased flow.
CE-TRUS
Rapid or increased contrast enhancement compared with transition zone, contralateral half of the peripheral zone or ipsilateral peripheral zone tissue.
Biopsy protocol and pathology
After the imaging analyzing, biopsy was performed with an 18-gauge biopsy needle by two radiologists. When there was no abnormal finding, ten biopsies were taken randomly, five from each prostate side (two cores from the base, two cores from the mid-gland, one core from the apex). When an abnormality was present at TRUS baseline imaging or CE-TRUS imaging, the biopsy specimen from the corresponding core was directed toward the abnormal finding. We will take additional cores in cases with more than 2 coded positive from CEUS and TRUS findings on the same side. The biopsy specimens were put into separate bottles and labeled according to gland location. Each biopsy specimen was reported as prostate cancer, prostatic intraepithelial neoplasia, prostatitis, or as benign prostatic tissue. All no cancerous findings were grouped together.
Analysis
Each patient/biopsy site coded as positive/negative for TRUS and positive/negative for CEUS and then compared to the biopsy result at that patient/site. All statistical calculations were performed by using SPSS13.0 software (SPSS, Chicago, IL) with P < 0.05 considered as statistically significant. By patient, McNemar test was used to assess diagnosis performance of sensitivity, specificity, accuracy and Chi-square test was used to assess PPV, NPV between two techniques. By core, conditional logistic regression analysis was used to assess sensitivity, specificity, accuracy, PPV and NPV between two techniques. Conditional logistic regression analysis was chosen, because the biopsy sites within any one patient were not statistically independent observations.
Results
The age of patients ranged from 41 to 92 years, with a mean of 69.33 years and an SD of 8.31. PSA levels ranged from 4.01 to 99 ng/mL, with a mean of 22.94 ng/mL and an SD of 23.06. Prostate volume ranged from 20.1 to 179.5 mL, with a mean of 59.13 mL and an SD of 27.44. Ten biopsies were taken for each patient. Prostate cancer was detected at 915 cores from 150 patients. Prostate cancer was detected at 668 cores from 119 patients by 1009 CE-TRUS targeted biopsy cores and 597 cores from 110 patients by 988 TRUS targeted biopsy cores (Figure 1).
Figure 1.
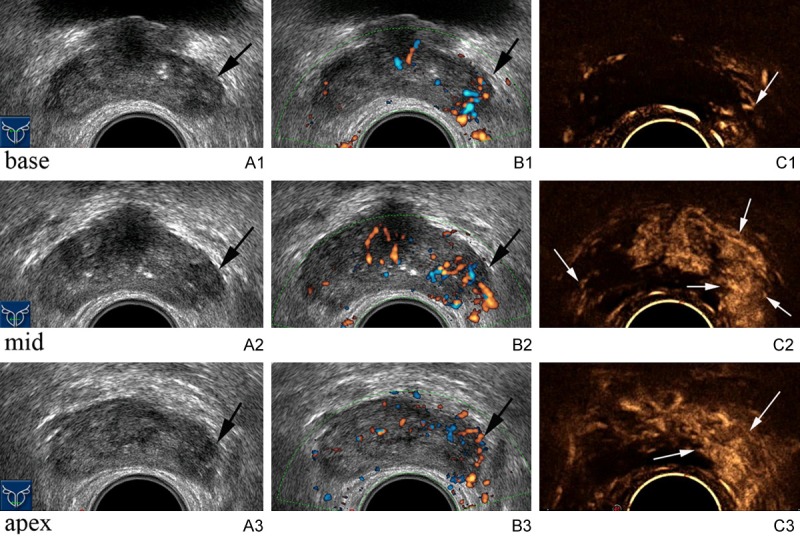
Images acquired from a patient with clinical characteristics of 28.00 ng/ml PSA level, DRE positive of left gland, 84 years old and 33 ml prostate volume. Grey-scale image shows hypoechoic lesions in the left base (A1), mid (B1) and apex (C1) gland (arrows). Power Doppler image shows increased vessels in these areas (A2, B2, C2 respectively). Contrast enhanced ultrasound image shows rapidly enhancing lesions with greater contrast in these areas (A3, B3, C3 respectively) compared with corresponding left gland (arrows). Biopsy targeted to these suspicious areas reveals Gleason 7 prostate cancer. Moreover, contrast enhanced ultrasound image shows a low enhancement area in the right mid gland (arrow) compared with surrounding peripheral zone tissues. Biopsy targeted to this suspicious area reveals Gleason 7 prostate cancer.
Cancer diagnostic performance of TRUS vs. CE-TRUS according to PSA level (Table 1)
Table 1.
Cancer diagnosis performance of TRUS vs. CE-TRUS according to PSA level
| PSA level/diagnostic performance | Sensitivity | Specificity | Accuracy | PPV | NPV | |||||
|---|---|---|---|---|---|---|---|---|---|---|
|
| ||||||||||
| TRUS | CE-TRUS | TRUS | CE-TRUS | TRUS | CE-TRUS | TRUS | CE-TRUS | TRUS | CE-TRUS | |
| By patient | ||||||||||
| 4-10 | 47.22 | 66.67* | 51.43 | 65.71 | 50 | 66.04* | 33.33 | 50.00 | 65.45 | 79.31 |
| 10-20 | 69.57 | 71.74 | 58.06 | 59.68 | 62.96 | 64.81 | 55.17 | 56.9 | 72.00 | 74.00 |
| > 20 | 89.71 | 91.18 | 57.14 | 60.00 | 78.64 | 80.58 | 80.26 | 81.58 | 74.07 | 77.78 |
| By core | ||||||||||
| 4-10 | 51.16 | 66.86* | 88.29 | 90.88 | 82.26 | 86.98* | 45.83 | 58.67* | 90.32 | 93.40* |
| 10-20 | 57.88 | 68.13* | 82.16 | 84.01 | 76.02 | 80* | 52.32 | 59.05 | 85.22 | 88.63* |
| > 20 | 74.68 | 78.09 | 74.46 | 76.61 | 74.56 | 77.28 | 71.05 | 73.69 | 77.80 | 80.64 |
Statistically significant differences (P < 0.05, CE-TRUS versus TRUS);
Abbreviations: TRUS, transrectal ultrasound; CE-TRUS, contrast-enhanced transrectal ultrasound; PPV, positive predictive value; NPV, negative predictive value; PSA, serum prostate specific antigen.
For PSA level groups, cancer was detected in 33.96% (36/106), 42.59% (46/108) and 66.02% (68/103) patients and in16.23% (172/1060), 25.28% (273/1080) and 45.63% (470/1030) cores in 4-10, 10-20 and > 20 ng/mL subgroups, respectively.
By patient, in PSA level 4-10 ng/mL subgroup, the sensitivity and accuracy were statistically significant greater for CE-TRUS than for TRUS (P = 0.004 and 0.003). There is no significant difference between the two techniques in PSA level higher subgroup. By core, statistically, CE-TRUS significantly improved the sensitivity, accuracy, PPV and NPV in PSA level 4-10 ng/mL subgroup (P = 0.003, 0.003, 0.012 and 0.02 respectively). In PSA level 10-20 ng/mL subgroup sensitivity, accuracy and NPV were significantly different between the two techniques (P = 0.013, 0.026 and 0.048 respectively). In PSA level > 20 ng/mL subgroup, there is no significant difference between the two techniques in all diagnosis performance.
Cancer diagnosis performance of TRUS vs. CE-TRUS according to DRE (Table 2)
Table 2.
Cancer diagnosis performance of TRUS vs. CE-TRUS according to DRE
| DRE findings/diagnostic performance | Sensitivity | Specificity | Accuracy | PPV | NPV | |||||
|---|---|---|---|---|---|---|---|---|---|---|
|
| ||||||||||
| TRUS | CE-TRUS | TRUS | CE-TRUS | TRUS | CE-TRUS | TRUS | CE-TRUS | TRUS | CE-TRUS | |
| By patient | ||||||||||
| DRE positive | 84.78 | 83.70 | 43.75 | 50 | 65.70 | 68.02 | 63.41 | 65.81 | 71.43 | 72.73 |
| DRE-negative | 55.17 | 72.41* | 65.52 | 73.56 | 61.38 | 73.10* | 51.61 | 64.62 | 68.67 | 80 |
| By core | ||||||||||
| DRE positive | 75.52 | 77.92 | 78.81 | 81 | 77.62 | 79.88 | 67.05 | 70.07 | 84.94 | 86.54 |
| DRE-negative | 43.10 | 62.41* | 86.29 | 88.53 | 77.66 | 83.31* | 44.04 | 57.64* | 85.85 | 90.40* |
Statistically significant differences (P < 0.05, CE-TRUS versus TRUS);
Abbreviations: TRUS, transrectal ultrasound; CE-TRUS, contrast-enhanced transrectal ultrasound; PPV, positive predictive value; NPV, negative predictive value; DRE, digital rectal examination.
For DRE findings groups, cancer was detected in 53.48% (92/172), 40.00% (58/145) patients and in36.34% (625/1720), 20.00% (290/1450) cores in DRE positive and DRE negative subgroups, respectively.
By patient and by core, when DRE was positive, there was no significantly different between the two techniques in all diagnostic performance. When DRE was negative, sensitivity and accuracy were statistically significant greater for CE-TRUS than for TRUS (P = 0.013 and 0.005) by patient. By core, sensitivity, accuracy, PPV and NPV were statistically significant greater for CE-TRUS than for TRUS (P = 0.000, 0.000, 0.001 and 0.001 respectively).
Cancer diagnosis performance of TRUS vs. CE-TRUS according to prostate volume (Table 3)
Table 3.
Cancer diagnosis performance of TRUS vs. CE-TRUS according to prostate volume
| Prostate Volume/diagnostic performance | Sensitivity | Specificity | Accuracy | PPV | NPV | |||||
|---|---|---|---|---|---|---|---|---|---|---|
|
| ||||||||||
| TRUS | CE-TRUS | TRUS | CE-TRUS | TRUS | CE-TRUS | TRUS | CE-TRUS | TRUS | CE-TRUS | |
| By patient | ||||||||||
| ≤ 45 | 77.46 | 77.46 | 29.55 | 31.82 | 59.13 | 60 | 63.95 | 64.71 | 44.83 | 46.67 |
| 45-65 | 72.34 | 80.85 | 50 | 66.07* | 60.19 | 72.82* | 54.84 | 66.67 | 68.29 | 80.43 |
| > 65 | 65.63 | 81.25 | 76.12 | 79.10 | 72.73 | 79.80 | 56.76 | 65 | 82.26 | 89.83 |
| By core | ||||||||||
| ≤ 45 | 67 | 69.98 | 76.44 | 79.38 | 73.13 | 76.09 | 60.54 | 64.68 | 81.11 | 83.05 |
| 45-65 | 63.87 | 74.19* | 82.92 | 96.81* | 77.18 | 83.01* | 61.68 | 70.77* | 84.26 | 88.65* |
| > 65 | 63.86 | 77.23* | 88.32 | 88.32 | 83.33 | 86.06 | 58.37 | 62.90 | 90.51 | 93.80* |
Statistically significant differences (P < 0.05, CE-TRUS versus TRUS);
Abbreviations: TRUS, transrectal ultrasound; CE-TRUS, contrast-enhanced transrectal ultrasound; PPV, positive predictive value; NPV, negative predictive value.
For prostate volume groups, cancer was detected in 61.74% (71/115), 45.63% (47/103) and 32.32% (32/99) patients and in35.04% (403/1150), 30.10% (310/1030) and 20.40% (202/990) cores in ≤ 45, 45-65, and > 65 ml subgroups, respectively.
By patient, only the sensitivity and accuracy of volume 45-65 ml subgroup was statistically significant greater for CE-TRUS than for TRUS (P = 0.012, and 0.004). By core, statistically, CE-TRUS significantly improved all the diagnostic performance in volume 45-65 ml subgroup (P = 0.006, 0.004, 0.001, 0.000 and 0.015 respectively). In volume ≤ 45 mL subgroup, there was no significantly different between the two techniques in all diagnostic performance. In volume > 65 mL subgroup, sensitivity and PPV were significantly different between the two techniques (P = 0.003 and 0.018).
Discussion
CE-TRUS is currently the most promising prostate biopsy guidance technique. However, the actual merit of CE-TRUS is still in question. In order to test the diagnostic efficiency of TRUS and CE-TRUS techniques, multiple subgroups of the patients with different PSA level, DRE findings and prostate volume were performed in our study. In each subgroup, the diagnostic performance including sensitivity, specificity, accuracy, PPV and NPV of the two techniques were compared on biopsy results. The subgroup analysis would theoretically increase the possibility of finding a real value of CE-TRUS.
Patients with a high PSA level may have a greater chance of having positive sonographic findings that could be detected by TRUS. In our study, CE-TRUS had great value in PSA level 4-10 ng/ml subgroup. When PSA level was 4-10 ng/mL, CE-TRUS targeted biopsy lost (false negative) 57 foci, with 5 foci detected by TRUS and 52 foci detected by random biopsy. So CE-TRUS targeted biopsy was not sufficient to eliminate the need for random biopsy. In TRUS baseline imaging, the increased microvessel density is one reason for hypoechoic appearance. Therefore, the decision to target a lesion suspicious on TRUS may also include abnormalities on CE-TRUS. In our study, 5 foci was only detected in the way of TRUS, that may caused by the fast scanning losing the small extent lesions, and we can do twice or more times of CE-TRUS examination to avoid missing lesions in future.
Prostate cancer is the only type of cancer in which tumor palpability is equated with clinical significance [23,24]. Patients with a positive DRE may have a greater chance of having positive sonographic findings that could be detected by TRUS. In our study, when DRE was positive, CE-TRUS was not better than TRUS in all diagnostic performance. When DRE was negative, CE-TRUS had better diagnostic performance compared with TRUS.
Prostate volume is variable among elderly individuals. Prostate volume can influence the detection of prostate cancer using CE-TRUS guided biopsy [25]. Enlarged transition zone is the primary cause of large prostate volume. In large prostate, peripheral zone was pressed thinner and it was difficult to detect lesions in thinner peripheral zone. When prostate volume was 45-65 mL, CE-TRUS had better diagnostic performance compared with TRUS. CE-TRUS diagnosis efficiency was limited in smaller (≤ 45 mL) and larger (> 65 mL) prostate.
CE-TRUS targeted biopsy may detect more patients and cancer foci with fewer biopsy cores that may alleviate biopsy related risks and patient complaints. Different from other organs, prostate cancer has the characteristics of multiple foci. 85% of prostate cancer is multifocal. Although CE-TRUS did not have better diagnostic performance by patient in some subgroup, but by core did. By core analysis plays a significant role in understanding the distribution of prostate cancer in the prostate gland and can play as a reference index for the staging of prostate cancer.
CnTI technology was applied in our study with a low acoustic pressure, which can protect the microbubbles. CnTI is capable of detecting one single microbubble and therefore can visualize the blood flow in the microvasculature, which enable scanning under real-time time conditions. We used mylab90 EC 1123 probe whose rotated was 200, which could display overall prostate and had advantage to find abnormal imaging according to bilateral comparison.
Our study has some limitations. First, we pay attention to peripheral zone of prostate where the majority of clinically significant prostate cancers develop. Because changes of prostatic hyperplasia in the transition zone often show hypervascularity, which cannot be differentiated from malignant tissue. Second, although each biopsy core was correlated with imaging findings, we cannot be certain that the biopsy needle passed through each visible sonographic abnormality. Third, the biopsy tissue histopathologic was used as a rough estimate, and we cannot be certain that all the cancers were identified. Further larger scale study with whole-mount prostatectomy is needed.
Conclusions
Understanding the value of CE-TRUS could have implications for patient care. CE-TRUS had better diagnostic performance in patient with indeterminate risk that may help clinicians make a decision whether to keep on prostate cancer screening or to process CE-TRUS targeted prostate biopsy. CE-TRUS targeted biopsy may detect more cancer foci that may be useful in reflecting cancer distribution in prostate gland and evaluating the stage. CE-TRUS targeted biopsy may detect more patients and cancer foci with fewer biopsy cores that may alleviate biopsy related risks and patient complaints.
Acknowledgements
This work was supported by the national level key subjects of China: Imaging and Nuclear Medicine.
Disclosure of conflict of interest
The authors confirm that there are no conflicts of interest.
References
- 1.Aus G, Abbou CC, Bolla M, Heidenreich A. EAU guidelines on prostate cancer. Eur Urol. 2005;48:546–551. doi: 10.1016/j.eururo.2005.06.001. [DOI] [PubMed] [Google Scholar]
- 2.Djavan B, Margreiter M. Biopsy standards for detection of prostate cancer. World J Urol. 2007;25:11–17. doi: 10.1007/s00345-007-0151-1. [DOI] [PubMed] [Google Scholar]
- 3.Bigler SA, Deering RE, Brawer MK. Comparison of microscopic vascularity in benign and malignant prostate tissue. Hum Pathol. 1993;24:220–226. doi: 10.1016/0046-8177(93)90304-y. [DOI] [PubMed] [Google Scholar]
- 4.Halpern EJ, McCue PA, Aksnes AK, Hagen EK, Frauscher F, Gomella LG. Contrast-enhanced US of the Prostate with Sonazoid: Comparison with Whole-Mount Prostatectomy Specimens in 12 Patients. Radiology. 2002;222:361–366. doi: 10.1148/radiol.2222010582. [DOI] [PubMed] [Google Scholar]
- 5.Kuligowska E, Barish MA, Fenlon HM, Blake M. Predictors of Prostate Carcinoma: Accuracy of Grey-Scale and Color Doppler US and Serum Markers. Radiology. 2001;220:757–64. doi: 10.1148/radiol.2203001179. [DOI] [PubMed] [Google Scholar]
- 6.Smeenge M, Mischi M, Laguna Pes MP, de la Rosette JJ, Wijkstra H. Novel contrast-enhanced ultrasound imaging in prostate cancer. World J Urol. 2011;29:581–587. doi: 10.1007/s00345-011-0747-3. [DOI] [PMC free article] [PubMed] [Google Scholar]
- 7.Trabulsi EJ, Sackett D, Gomella LG, Halpern EJ. Enhanced Transrectal Ultrasound Modalities in the Diagnosis of Prostate Cancer. Urology. 2010;76:1025–1033. doi: 10.1016/j.urology.2010.05.022. [DOI] [PubMed] [Google Scholar]
- 8.Heijmink SW, Barentsz JO. Contrast-enhanced versus systematic transrectal ultrasound-guided prostate cancer detection: An overview of techniques and a systematic review. Eur J Radiol. 2007;63:310–316. doi: 10.1016/j.ejrad.2007.06.027. [DOI] [PubMed] [Google Scholar]
- 9.Heijmink SW, van Moerkerk H, Kiemeney LA, Witjes JA, Frauscher F, Barentsz JO. A comparison of the diagnostic performance of systematic versus ultrasound-guided biopsies of prostate cancer. Eur Radiol. 2006;16:927–938. doi: 10.1007/s00330-005-0035-y. [DOI] [PubMed] [Google Scholar]
- 10.Mitterberger M, Horninger W, Pelzer A, Strasser H, Bartsch G, Moser P, Halpern EJ, Gradl J, Aigner F, Pallwein L, Frauscher F. A Prospective Randomized Trial Comparing Contrast-Enhanced Targeted Versus Systematic Ultrasound Guided Biopsies: Impact on Prostate Cancer Detection. Prostate. 2007;67:1537–1542. doi: 10.1002/pros.20639. [DOI] [PubMed] [Google Scholar]
- 11.Halpern EJ, Ramey JR, Strup SE, Frauscher F, McCue P, Gomella LG. Detection of Prostate Carcinoma with Contrast-Enhanced Sonography Using Intermittent Harmonic Imaging. Cancer. 2005;104:2373–2383. doi: 10.1002/cncr.21440. [DOI] [PubMed] [Google Scholar]
- 12.Mitterberger MJ, Aigner F, Horninger W, Ulmer H, Cavuto S, Halpern EJ, Frauscher F. Comparative efficiency of contrast enhanced colour Doppler ultrasound targeted versus systematic biopsy for prostate cancer detection. Eur Radiol. 2010;20:2791–2796. doi: 10.1007/s00330-010-1860-1. [DOI] [PubMed] [Google Scholar]
- 13.Yuen JS. Comparison of contrast enhanced color Doppler targeted biopsy with convertional systematic biopsy:impact on prostate cancer detection. J Urol. 2003;170:192–3. doi: 10.1097/01.ju.0000069563.16034.d7. [DOI] [PubMed] [Google Scholar]
- 14.Aigner F, Pallwein L, Mitterberger M, Pinggera GM, Mikuz G, Horninger W, Frauscher F. Contrast-enhanced ultrasonography using cadence-contrast pulse sequencing technology for targeted biopsy of the prostate. BJU Int. 2008;103:458–463. doi: 10.1111/j.1464-410X.2008.08038.x. [DOI] [PubMed] [Google Scholar]
- 15.Halpern EJ, Rosenberg M, Gomella LG. Prostate Cancer: Contrast enhanced US for Detection. Radiology. 2001;219:219–225. doi: 10.1148/radiology.219.1.r01ap21219. [DOI] [PubMed] [Google Scholar]
- 16.Matsumoto K, Nakagawa K, Hashiguchi A, Kono H, Kikuchi E, Nagata H, Miyajima A, Oya M. Contrast-enhanced Ultrasonography of the Prostate with Sonazoid. Jpn J Clin Oncol. 2010;40:1099–104. doi: 10.1093/jjco/hyq102. [DOI] [PubMed] [Google Scholar]
- 17.Zhao HX, Xia CX, Yin HX, Guo N, Zhu Q. The value and limitations of contrast-enhanced transrectalultrasonography for the detection of prostate cancer. Eur J Radiol. 2013;82:e641–647. doi: 10.1016/j.ejrad.2013.07.004. [DOI] [PubMed] [Google Scholar]
- 18.Taverna G, Morandi G, Seveso M, et al. Colour Doppler and microbubble contrast agent ultrasonography do not improve cancer detection rate in transrectal systematic prostate biopsy sampling. BJU Int. 2011;108:1723–1727. doi: 10.1111/j.1464-410X.2011.10199.x. [DOI] [PubMed] [Google Scholar]
- 19.Seitz M, Gratzke C, Schlenker B, Buchner A, Karl A, Roosen A, Singer BB, Bastian PJ, Ergün S, Stief CG, Reich O, Tilki D. Contrast-enhanced transrectal ultrasound (CE-TRUS) with cadence-contrast pulse sequence (CPS) technology for the identification of prostate cancer. Urol Oncol. 2011;29:295–301. doi: 10.1016/j.urolonc.2009.03.032. [DOI] [PubMed] [Google Scholar]
- 20.Yi A, Kim JK, Park SH, Kim KW, Kim HS, Kim JH, Eun HW, Cho KS. Contrast-Enhanced Sonography for Prostate Cancer Detection in Patients with Indeterminate Clinical Findings. AJR. 2006;186:1431–1435. doi: 10.2214/AJR.04.1959. [DOI] [PubMed] [Google Scholar]
- 21.Wink M, Frauscher F, Cosgrove D, Chapelon JY, Palwein L, Mitterberger M, Harvey C, Rouvière O, de la Rosette J, Wijkstra H. Contrast-Enhanced Ultrasound and Prostate Cancer; A Multicentre European Research Coordination Project. Eur Urol. 2008;54:982–993. doi: 10.1016/j.eururo.2008.06.057. [DOI] [PubMed] [Google Scholar]
- 22.Xie SW, Li FH, Li HL, Du J, Xia JG, Fang H, Bo JJ, Zhu JS. Value of Contrast-Enhanced Sonography with Micro Flow Imaging in the Diagnosis of Prostate Cancer. J Clin Ultrasound. 2011;39:371–377. doi: 10.1002/jcu.20841. [DOI] [PubMed] [Google Scholar]
- 23.Baumgart LA, Gerling GJ, Bass EJ. Characterizing the range of simulated prostate abnormalities palpable by digital rectal examination. Cancer Epidemiol. 2010;34:79–84. doi: 10.1016/j.canep.2009.12.002. [DOI] [PMC free article] [PubMed] [Google Scholar]
- 24.Lee F Jr, Bronson JP, Lee F, Torp-Pedersen ST, Siders DB, Thornbury JR, McHugh TA. Nonpalpable cancer of the prostate: Assessment with transrectal US. Radiology. 1991;178:197–199. doi: 10.1148/radiology.178.1.1984304. [DOI] [PubMed] [Google Scholar]
- 25.Colleselli D, Bektic J, Schaefer G, Frauscher F, Mitterberger M, Brunner A, Schwentner C, Bartsch G, Horninger W, Pelzer AE. The influence of prostate volume on prostate cancer detection using a combined approach of contrastenhanced ultrasonography-targeted and systematic grey-scale biopsy. BJU Int. 2007;100:1264–1267. doi: 10.1111/j.1464-410X.2007.07174.x. [DOI] [PubMed] [Google Scholar]