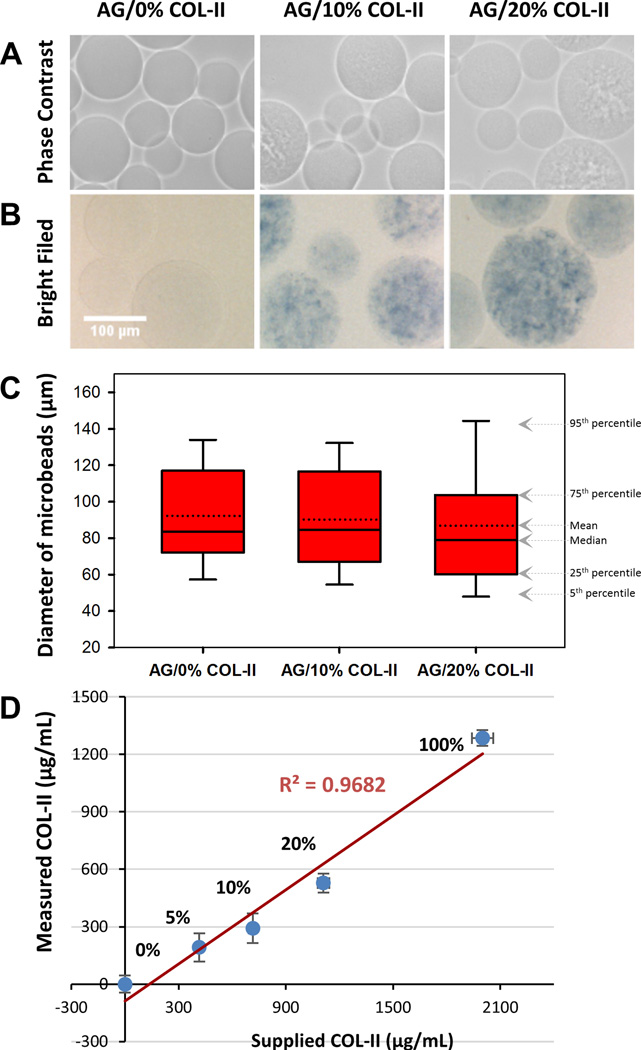
Figure 2.
Morphology, collagen content, and size distribution of AG/COL-II microbeads. (A) Phase contrast and (B) brightfield images of acellular microbeads with varying COL-II concentration, with collagen stained with Coomassie Blue in the brightfield images. (C) Diameter of microbeads as a function of composition. The solid center line in the box plot represents the median, the dotted center line in the box represents the mean, and the lower and upper boundaries of the box represent the 25th and 75th percentiles, respectively. Whiskers (error bars) above and below the box indicate the 90th and 10th percentiles. (D) Quantitation of protein content of AG/COL-II microbeads using a total protein assay.

