

Abstract
Background
Antiangiogenic therapy of vestibular schwannoma (VS) in type 2 neurofibromatosis can produce tumor shrinkage with response rates of 40%–60%. This study examines the predictive value of parameter-derived MRI in this setting.
Methods
Twelve patients with 20 VSs were recruited. Each had at least one rapidly growing tumor. Patients were treated with bevacizumab, 5 mg/kg every 2 weeks. Patients with stable or reduced VS volume were maintained at 2.5–5 mg every 4 weeks after 6 months. Those who failed treatment had their bevacizumab discontinued. Dynamic contrast-enhanced (DCE) MRI performed prior to treatment using a high temporal resolution technique, and data were analyzed to allow measurement of contrast transfer coefficient (Ktrans), vascular fraction (vp), extravascular-extracellular fraction (ve). Relaxation rate (R1N) was measured using a variable flip angle technique. Apparent diffusional coefficient (ADC) was calculated from diffusion-weighted imaging. The predictive power of microvascular parameters and ADC were examined using logistic regression modeling.
Results
Responding tumors were larger (P < .001), had lower R1N (P < .001), and higher Ktrans (P < .05) and ADC (P < .01). They showed increases in R1N (P < .01) and reduction of Ktrans (P < .01) and ADC (P < .01). Modeling to predict response demonstrated significant independent predictive power for R1N (Β = − 0.327, P < .001), and Ktrans (Β = 0.156, P < .05). Modeling to predict percentage change in tumor volume at 90 days identified baseline tumor volume (Β = 5.503, P < .05), R1N (Β = − 5.844, P < .05), and Ktrans (Β = 5.622, P < .05) as independent significant predictors.
Conclusions
In patients with type 2 neurofibromatosis, biomarkers from DCE-MRI are predictive of VS volume response to inhibition of vascular endothelial growth factor inhibition.
Keywords: bevacizumab, DCE-MRI, neurofibromatosis type 2, prediction, treatment response
The management of rapidly progressive vestibular schwannoma (VS) is a major clinical problem. This is particularly true in patients with type 2 neurofibromatosis (NF2), in which bilateral VSs are the hallmark of the disease, and multiple other cerebral tumors commonly coexist, complicating treatment planning and limiting surgical options.1,2 The benign VS arises from Schwann cells surrounding the inferior and superior vestibular portion of the eighth cranial nerve.2 Progressive tumor growth can cause loss of hearing, and iatrogenic hearing loss can occur following surgical intervention or radiotherapy. As tumors continue to enlarge, they produce increasing brainstem compression that can be fatal. The growth of tumors is highly dependent on the formation of new blood vessels, a process known as angiogenesis. Vascular endothelial growth factor (VEGF) is a ubiquitous proangiogenic cytokine expressed in both sporadic and NF2-related VS. Moreover, the magnitude of VEGF expression has been shown to correlate with tumor growth rate.3,4 These observations led to trials of VEGF inhibition strategies, which demonstrated reduction of tumor growth rate, tumor shrinkage,5–7 and even tumor regression.8,9
Although the number of such studies remains small, there is clear variation in response rates, which range from 40% to 60%.5,6,10 These findings have led others to suggest that antiangiogenic therapy may be appropriate in selected cases of sporadic VS.11 However, as these authors point out, antiangiogenic therapy is extremely costly, which in combination with the slow progression of VS and the variability in growth rates would make clinical trials difficult to conduct. In other tumor types, it was proven possible to predict response to antiangiogenic therapy using biomarkers of the tumor microenvironment derived from dynamic contrast-enhanced magnetic resonance imaging (DCE-MRI)12–14 or from diffusion-weighted MRI.15 In this study we have examined the power of these parameters to predict reduction in the size of VS in patients with NF2 treated with bevacizumab.
Methods
Patient Population
Patients were recruited through the nationally commissioned, highly specialized NF2 clinic in Manchester; UK. All participants gave informed consent, and the National Research Ethics Committee North West approved the study (REC reference 13/NW/0247). Inclusion criteria were: (i) proven NF2and (ii) at least one VS demonstrating a high growth rate (defined as an increase of 4 mm or greater in the maximal transverse diameter over a 12-month period). In our practice, this growth rate is observed in ∼10% of patients with NF2. Exclusion criteria included standard contraindications to MR imaging or contrast-agent administration. Patients were treated with the antivascular endothelial growth factor antibody, bevacizumab, 5 mg/kg every 2 weeks. Where bevacizumab resulted in a reduction in VS volume, treatment at 5 mg/kg every 2 weeks was continued until stability was achieved. Patients in whom there was stability of VS volume were reduced to a maintenance dose of 2.5–5 mg every 4 weeks after 6 months. Those who failed treatment had their bevacizumab discontinued. Clinical response was assessed using a standardized speech discrimination test at 40 dB.
Patients underwent detailed imaging on 2 occasions: pretreatment (day zero) and 3 months (day 90) following treatment. Follow-up studies with conventional MRI scans were then performed every 3–6 months.
Each VS was classified according to response to antiangiogenic therapy over the 90-day period. Response was defined as a volume reduction exceeding 0.125 cm3 or a relative volume decrease exceeding 5%. These thresholds were defined by a reproducibility study (unpublished results) as the lowest volume change reliably detectable on postcontrast anatomical scans (>95% probability of tumor volume reduction). These criteria differ from standard clinical criteria for volume response since the aim of the work was to identify tumor features that related to detectable reduction in tumor volume. Progression on treatment was defined as an increase in tumor volume exceeding 0.125 cm3 or a relative volume increase exceeding 5% on the 3- or 6-month follow-up scans.
Magnetic Resonance Imaging
Patients were imaged on a 1.5T whole body scanner (Philips Acheiva, Philips Medical Systems) using an 8-channel head coil. Imaging included anatomical sequences before and after contrast agent administration for measurement of tumor volume. Diffusion-weighted images (DWIs) were collected using 3 B values (0, 400, and 800 s/mm3). DCE-MRI data were collected using a dual-injection technique, as described previously.16 Contrast agent (CA; gadoterate meglumine; Dotarem, Geurbet S.A.) was administered by power injector as an intravenous bolus at a rate of 3 mL/s, followed by a chaser of 20 mL/s of 0.9% saline administered at the same rate. A high temporal resolution (1 s) sequence with a low dose of contrast agent (0.02 mmol/kg) was performed (LDHT-DCE) to allow accurate measurement of the arterial input (AIF) and tissue residue functions. Subsequently, a full CA dose (0.1 mmol/kg), high-spatial resolution (voxel size = 1 × 1 × 2 mm) acquisition (FDHS-DCE) was performed to provide high spatial resolution data and scaling of the AIF. Variable flip angle (VFA; α = 2°, 8°, 15° and 20°) acquisitions were performed prior to the LDHT DCE series for native longitudinal relaxation rate (R1N) mapping.
Image Processing
Analysis of Dynamic Contrast-enhanced MRI
The SI-time curves were converted to contrast concentration curves using measured values of R1N.17 Using the AIF derived from LDHT-DCE, the LDHT-DCE tissue residue time course curves were fitted to the modified Tofts model.18,19 Estimated values of transfer constant (Ktrans), fractional plasma volume (vp), and fractional volume of extravascular-extracellular space (ve) were calculated on a pixel-by-pixel basis. Estimates of bolus arrival time (BAT) were also derived from LDHT-DCE.
Analysis of Diffusion-weighted Imaging
DWI images were used to calculate an apparent diffusion coefficient (ADC). This was done on a pixel-by-pixel basis using inhouse software to fit an exponential decay function to signal intensity. Average values were then derived from the region of interest (ROI).
Co-registration and Tumor Segmentation
Longitudinal co-registration was performed for all scans for each participant. Both 3D-VFA series and images from the LDHT-DCE 4D dynamic series from each visit were co-registered to one precontrast FDHS-DCE 3D dataset acquired on day zero. VSs were segmented using a semiautomatic segmentation program (SX plugin for Osirix, Segmentix, Fr). The results of segmentation were reviewed and, where necessary, edited by an experienced neuroradiologist (A.J.). The resulting 3D ROIs were used to measure tumor volume before and after treatment and to identify pixels for inclusion in pharmacokinetic analysis (vide supra).
Statistical Analysis
The hypotheses that pretreatment tumor mean values of Ktrans, vp, ve, BAT, R1N, ADC, and tumor volume did not differ between responders and nonresponders was tested using the Mann-Whitney U test. The hypotheses that tumor mean values of Ktrans, vp, ve, BAT, R1N, and ADC in VS were unchanged following treatment was tested using the Wilcoxon signed rank tests.
Binary logistic regression modeling was performed to assess ability of imaging biomarkers to predict tumor response at day 90. The model included tumor volume, R1N and LDHT-DCE derived measures of Ktrans, vp, ve, BAT, and ADC. All explanatory variables were standardized prior to analysis, and results were expressed as standardized beta coefficients. The predictive performance of the model was assessed by receiver operator characteristics (ROC) analysis and calculation of the area under the curve (AUC). Cross-validation analysis using a leave-one-out methodology was also performed, and classification performance and corresponding cross-validation set was assessed by calculation of sensitivity, specificity, and positive and negative predictive power. Binary logistic regression modeling using the same baseline parameters was also performed to assess the ability of imaging biomarkers to predict progression of the tumor on treatment.
Further linear regression analysis modeling was performed to test the hypothesis that no relationship exists between imaging parameters at baseline and subsequent percentage change in tumor volume. Separate models were performed for each dependent variable using the same explanatory variable datasets described above.
Results
Treatment was well tolerated in all participants with no toxicity greater than grade 1, and in no cases did treatment have to be stopped or withdrawn prematurely. DCE-MRI data were collected in 12 consecutive participants with a total of 20 VSs. Previous surgical resection of a contralateral VS had been performed prior to antiangiogenic treatment in 4 cases. Image quality was high, and no significant movement artefact was apparent in any dataset (Fig. 1). Of these 20 tumors, 12 responded to treatment. These included 2 tumors that had not shown significant growth prior to treatment. There was no response in 8 tumors; 4 of which had shown rapid growth prior to treatment. Imaging biomarker data for all tumors are shown in Table 1. Differences in pretreatment imaging characteristics between responders and nonresponders are shown in Fig. 2. Responding tumors were significantly larger (P < .001) and showed lower values of R1N (P < .001) and significantly higher values of Ktrans (P < .05) and ADC (P < .01).
Fig. 1.
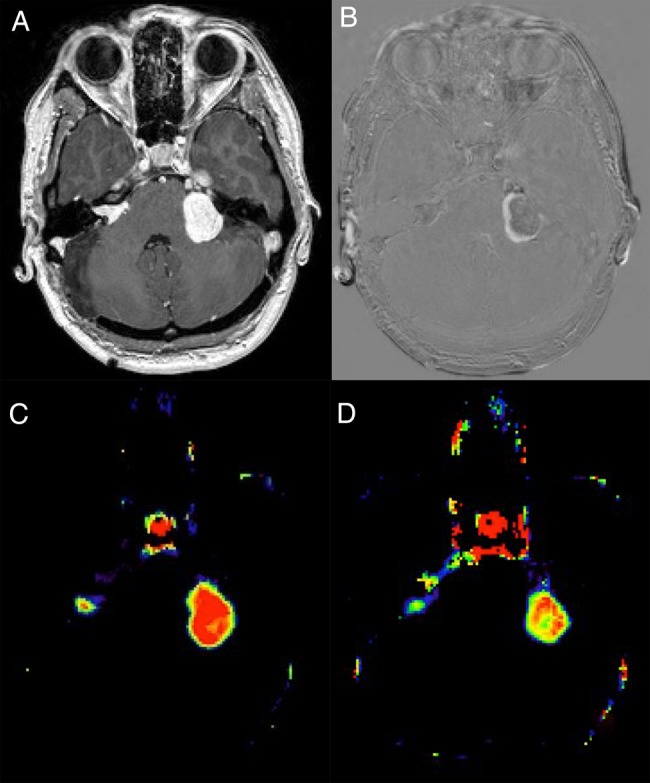
(A) Contrast-enhanced T1-weighted images of a patient with bilateral vestibular schwannomas. (B) Subtraction image showing volume reduction after 90 days of treatment in the left-sided tumor. (C) Ktrans image at baseline showing high values in the larger, rapidly growing tumor. (D) Ktrans image after 90 days of treatment showing marked reduction in the larger tumor.
Table 1.
Data from individual participants with measured tumor volumes at baseline, day 90 and day 180
| Patient | Sex/ | Tumor | R1N |
Ktrans** |
ADC** |
Tumor Volume |
Response, 90 d | Response, 180 d | |||||
|---|---|---|---|---|---|---|---|---|---|---|---|---|---|
| Number | Age* | Location | 0 d | 90 d | 0 d | 90 d | 0 d | 90 d | 0 d | 90 d | 180 d | ||
| 1 | M/16 | R | 0.6223 | 0.7554 | 0.1538 | 0.0666 | 1238.0 | 1169.25 | 10.520 | 7.382 | 6.852 | res | res |
| L | 0.6935 | 0.7402 | 0.1604 | 0.0627 | 1259.8 | 1115.1 | 4.389 | 3.542 | 3.530 | res | res | ||
| 2 | F/25 | R | 0.6204 | 0.6705 | 0.1396 | 0.1138 | 1103.6 | 1133.4 | 17.870 | 13.110 | 12.400 | res | res |
| 3 | M/21 | R | 0.8630 | 0.9903 | 0.0879 | 0.1064 | 980.4 | 911.5 | 0.852 | 0.993 | 1.063 | non | non |
| L | 0.7123 | 0.8304 | 0.0915 | 0.1116 | 1123.6 | 1098.0 | 1.354 | 1.236 | 1.437 | non | non | ||
| 4 | F/23 | R | 0.8382 | 0.7762 | 0.0712 | 0.0575 | 825.7 | 835.9 | 0.482 | 0.490 | 0.509 | non | non |
| L | 0.6183 | 0.6959 | 0.1325 | 0.0861 | 1366.6 | 1317.2 | 5.736 | 4.148 | 3.705 | res | res | ||
| 5 | F/16 | R | 0.9430 | 1.0324 | 0.0394 | 0.0450 | 914.2 | 718.2 | 0.407 | 0.448 | 0.562 | non | non |
| L | 0.6649 | 0.6909 | 0.0923 | 0.0845 | 1156.4 | 1131.6 | 5.932 | 5.471 | 5.691 | res | res | ||
| 6 | M/23 | L | 0.7810 | 0.8416 | 0.1127 | 0.1105 | 1157.8 | 892.1 | 1.096 | 1.171 | NA*** | non | NA*** |
| 7 | F/29 | R | 0.6338 | 0.6464 | 0.1443 | 0.0798 | 1354.2 | 1249.8 | 4.613 | 4.077 | 4.697 | res | non |
| L | 0.7572 | 0.6777 | 0.0711 | 0.0324 | 854.1 | 991.8 | 0.563 | 0.398 | 0.612 | res | non | ||
| 8 | M/20 | R | 0.6877 | 0.6918 | 0.0989 | 0.0813 | 1300.1 | 1159.1 | 3.445 | 3.260 | 3.173 | res | res |
| L | 1.1578 | 1.1350 | 0.1185 | 0.1142 | 791.1 | 558.2 | 0.196 | 0.209 | 0.218 | non | non | ||
| 9 | F/54 | R | 0.6908 | 0.7157 | 0.0994 | 0.1175 | 1206.2 | 1217.0 | 2.962 | 2.526 | NA*** | res | NA*** |
| L | 0.6326 | 0.6830 | 0.1142 | 0.0953 | 1358.2 | 1490.9 | 6.406 | 5.169 | NA*** | res | NA*** | ||
| 10 | M/29 | R | 0.6137 | 0.6602 | 0.1135 | 0.0739 | 1248.0 | 1217.4 | 8.481 | 6.288 | 6.044 | res | res |
| 11 | M/26 | R | 0.6939 | 0.7680 | 0.0886 | 0.0736 | 1032.8 | 1179.2 | 2.067 | 1.702 | NA*** | res | NA*** |
| 12 | M/58 | R | 0.8984 | 0.8570 | 0.0586 | 0.0635 | 906.6 | 907.1 | 1.147 | 1.143 | 1.052 | non | non |
| L | 0.9159 | 0.8575 | 0.0499 | 0.0567 | 987.1 | 831.0 | 1.073 | 1.073 | 1.085 | non | non | ||
Abbreviations: ADC, apparent diffusion coefficient; L, left; non, nonresponder; R, right; res, responder.
Measured values of R1N (s-1), Ktrans (min-1) and ADC (mm/s) are shown before and following 90 days of treatment.
*Age at baseline MRI scans.
**Ktrans values are in min−1; ADC values are in 10–12 m2/sec.
***No MRI scans performed at that time.
Fig. 2.

Comparison of tumor volume (cm3), apparent diffusion coefficient (ADC; mm2/s), (Contrast transfer coefficient; Ktrans (min−1), and R1N (longitudinal relaxation; s−1) between responders (res) and ‘nonresponders (non). High values of ADC and Ktrans and low values of R1N are in keeping with a larger extravascular-extracellular space and increased levels of interstitial free fluid.
Improvements in hearing performance on the word discrimination task were seen in 4 participants, corresponding to significant volumetric tumor response in each case. There was no significant difference in the volume change or percentage volume change in those responding tumors that showed improvement in hearing function and those that did not.
Table 2 is a correlation matrix showing nonparametric correlation coefficients and significance values for all imaging parameters. Tumor volume correlates with treatment-related volume change (P < .001) and percentage volume change (P < .001) and correlates inversely with R1N (P < .001). Treatment-related volume change and percentage volume change correlate inversely with R1N (P < .001 and P < .01, respectively). Of the pharmacokinetic parameters, Ktrans correlates with tumor volume (P < .01), volume change (P < .01), percentage volume change (P < .05), and R1N (P < .01), and ve shows weak correlation with the same parameters (P < .05). ADC correlates with tumor volume (P < .01), volume change (P < .01), percentage volume change (P < .05), and Ktrans (P < .01) and correlates inversely with R1N (P < .01).
Table 2.
Correlations between tumor volumetric parameters, dynamic contrast-enhanced MRI-derived parameters, and apparent diffusion coefficient
| Tumor Volume (V) | Change in V | Percentage Change V | R1N | Ktrans | vp | ve | ADC | |
|---|---|---|---|---|---|---|---|---|
| Tumor volume (V) | 0.920*** | 0.711*** | −0.932*** | 0.669** | NS | 0.513* | 0.758** | |
| Change in V | −0.913*** | 0.684** | NS | 0.562* | −0.662** | |||
| Percentage change V | −0.779** | 0.562* | NS | O.481* | −0.486* | |||
| R1N | −0.666** | NS | −0.511* | −0.788*** | ||||
| Ktrans | NS | NS | 0.654** | |||||
| vp | NS site | NS | ||||||
| ve | 0.504* |
Abbreviations: ADC, apparent diffuse coefficient; vp, plasma volume; NS, not significant; ve, extravascular extracellular space fraction.
Figures represent the Spearman correlation coefficient.
*P < .05, **P < .01, ***P < .001.
Following treatment, there was significant reduction in tumor volume (P < .01) and increase in R1N (P < .05). Pharmacokinetic parameters from LDHT-DCE showed significant reductions in Ktrans (P < .05) and ADC (P < .05). Separate analysis of responding (n = 12) and nonresponding (n = 8) tumors demonstrated no significant changes in R1N, ADC, or pharmacokinetic parameters in nonresponders. In responders (Fig. 3) there were significant increases in R1N (P < .01) and reduction in ADC (P < .01) and Ktrans (P < .01).
Fig. 3.

Changes in tumor volume (cm3), apparent diffusion coefficient (ADC; mm2/s), (Contrast transfer coefficient; Ktrans (min−1) and R1N (longitudinal relaxation; s−1) between responders (res) and ‘nonresponders (non). Reductions in ADC and increased values of R1N are in keeping with a decrease in the extravascular-extracellular space and decreased levels of interstitial free fluid.
Modeling results are summarized in Table 3. Binomial multivariate regression modeling to predict tumor response at 90 days showed R1N and Ktrans as the only independent significant predictors of response (Table 1). The area under the ROC curve was 0.9896, and results of the cross-validation analysis are shown in Table 2. Linear multivariate regression modeling to predict percentage change in tumor volume response at 90 days showed significant independent predictive power for baseline tumor volume (standardized beta coefficient = 5.503, P < .05) and R1N (standardized beta coefficient = − 5.844, P < .01). Calculated AUC, sensitivity and specificity for the original data and for the cross-validated (leave-one-out) dataset for the prediction of response are shown in Table 4.
Table 3.
Independent significant variables in binomial linear regression to predict response (top) and multiple linear regression to predict percentage tumor volume change (bottom)
| Explanatory Variable | Standardized β Coefficient | Std. Error | T Stat | Significance |
|---|---|---|---|---|
| Model 1: Prediction of response | ||||
| R1N (s−1) | −0.327 | 0.083 | −4.186 | P < .001 |
| Ktrans (min−1) | 0.156 | 0.083 | 1.902 | P < .05 |
| Constant | 0.6 | 0.66 | 9.057 | P < .001 |
| Model 2: Prediction of percentage volume change | ||||
| Tumor Volume (cm3) | 5.503 | 2.396 | 2.297 | P < .05 |
| R1N (s−1) | −5.844 | 2.357 | −2.479 | P < .01 |
| Constant | 10.122 | 1.727 | 5.862 | P < .001 |
Regression analyses were performed using standardized values.
Table 4.
Area under the receiver operator curve, sensitivity, and specificity of the binomial regression model for the prediction of tumor response in original data (top) and following leave-one-out cross-validation
| Prediction of Response | AUC-ROC | Sensitivity | Specificity |
|---|---|---|---|
| Data | 0.979 | 92 | 97 |
| Cross-validated | 0.894 | 83 | 87 |
Abbreviation: AUC, area under the curve; -ROC, receiver operator characteristic.
Sensitivity and specificity derived from the data are the best performance that can be expected. Leave-one-out analysis gives an approximation of how the prognostic model would be expected to behave in a larger population.
Progression on treatment was identified in 6 tumors. All 6 had been growing rapidly at presentation, 5 had shown initial response, and one did not. Binomial multivariate regression modeling did not identify any significant predictive features for the identification of tumors that progressed.
Discussion
This study has confirmed the findings of previous researchers, demonstrating shrinkage of VS in 60%, associated with hearing improvement in 33% of cases following treatment with VEGF inhibition. This is similar to the response rate cited by Plotkin et al,5 who found a hearing response in 57% and radiographic evidence of tumor shrinkage in 55% over the same time period. A later study reported lower response rates in a series of 12 patients with a radiological response in 39% and associated objective and subjective improvement of neurological symptoms in 60%.10 Previous studies have adopted the original response criteria suggested by Plotkin of a reduction of ≥20% in tumor volume. In addition they examined the duration of the volume response and the effect on hearing and other neurological symptoms. In this study we have attempted to identify characteristics of the tumor microenvironment that could identify those tumors likely to show this volumetric response. Consequently, we have chosen a more sensitive index of tumor volume change; defining response as any decrease in tumor volume >5% (or >0.125 cm³). It must also be appreciated that we have defined response purely as a volumetric reduction at 90 days and have not performed functional imaging at later time points.
Despite the small number of participants in this study, we have clearly identified phenotypic characteristics of the tumor microvasculature that are associated with subsequent response to VEGF inhibition and carry significant independent predictive power. Response was associated with larger tumor size, lower values of R1N, and high values of Ktrans at baseline. These 3 parameters showed significant cross correlations, but both R1N and Ktrans were independently and significantly predictive of tumor response. These findings suggest that baseline DCE-MRI may provide sufficient predictive power to support clinical trials and targeted therapy in this patient group, allowing identification of participants in whom volumetric response is unlikely to occur with a sensitivity of 83%–92% and a specificity of 87%–97%. Attempting to predict the resultant percentage change in tumor volume identified baseline tumor volume in addition to the same 2 predictive parameters as independent significant predictors. The expected accuracy of a predictive model based on these features cannot be assessed on such a small data sample since it will require analysis of the distribution of errors in predicted volume. However, these findings suggest that such a model could be developed with a larger dataset. Following treatment, responding tumors showed increases in R1N and reductions in Ktrans and ADC in association with volume loss. These parameters provide some insight into the mechanisms associated with tumor shrinkage. The R1N measurement inversely reflects the free water content of tissue, so that increases in the parameter following treatment are likely to reflect reductions in interstitial tumor fluid. This is supported by this and previous studies using diffusion-weighted MRI that have identified high values of ADC in solid VSs, suggesting the presence of high amounts of extracellular water in the tumor matrix.20 Furthermore, Plotkin et al.5 found high values of ADC as the only radiological feature at baseline that correlated with changing tumor volume at 3 months. We have also seen a relationship between baseline ADC and tumor shrinkage. However, ADC was a strong correlate of R1, and the inclusion of R1 in the models excluded ADC as an independent significant predictive feature. The Ktrans parameter reflects regional capillary blood flow, capillary endothelial permeability, and the surface area of the capillary endothelial membrane. Since a primary action of VEGF inhibitors is a rapid reduction in capillary endothelial membrane permeability, reduction of Ktrans following treatment is likely to reflect this mechanism. However, the possibility that treatment is associated with significant changes in tumor blood flow would provide an alternate interpretation of these findings and would also be in keeping with the concept of vascular normalization in response to antiangiogenic therapy. Previous authors11 have examined the possible therapeutic mechanisms associated with response to VEGF inhibition and concluded: “A possible explanation for the rapid effect of anti-VEGF therapy in both schwannoma size and hearing may be due to a reduction in permeability of peritumoral blood vessels and associated vasogenic edema.” A later study by Wong et al,21 using a murine model, demonstrated a 43% decrease in vascular permeability within 24 hours of treatment as well as a decrease in the surface area of vessels of 33%. It is of considerable importance that Wong et al21 found an increase in necrosis rather than apoptosis, suggesting cell death resulting from inadequate vascular supply rather than a direct cytotoxic effect. They also showed that the loss of functional Merlin resulted in downregulation in the semaphorin/neuropilin axis, which normally inhibits VEGF signaling. These authors concluded that anti-VEGF therapy most probably controls tumor growth by re-establishing a natural balance between VEGF and semaphorin 3 signaling resulting in vascular normalization. The findings of the current study are entirely in keeping with a primary mechanism of vascular normalization with reduction in intratumor or edema resulting from reductions in endothelial permeability and/or local blood flow. At a simplistic level, the findings may be interpreted as showing that tumors with a greater angiogenic drive, associated with increased endothelial permeability, local blood flow, and consequently with increased interstitial fluid, are more likely to respond and that they do so by normalization of microvascular parameters that result in reversal of each of these features.
In conclusion we have shown that initial volumetric response to anti-VEGF therapy is more likely in VSs that show high levels of intratumoral edema and high values of Ktrans, reflecting blood flow and capillary endothelial permeability. Responding tumors show reductions in both of these features that correlate with and predict volumetric tumor response. Subsequent progression of the tumor on treatment was not associated with any microenvironmental predictive feature. These findings support suggestions of previous researchers that the primary mechanism of anti-VEGF therapy occurs through vascular normalization and provide a potential selection criteria for targeted therapy.
Funding
This work was jointly funded by Cancer Research UK (CRUK) and the Engineering and Physical Sciences Research Council (EPSRC). Funding reference C8742/A18097.
Acknowledgments
This work is an output of the CRUK EPSRC Cancer Imaging Center in Cambridge and Manchester.
Conflicts of interest statement. None declared.
References
- 1.Lloyd SK, Evans DG. Neurofibromatosis type 2 (NF2): diagnosis and management. Handb Clin Neurol. 2013;115:957–967. [DOI] [PubMed] [Google Scholar]
- 2.Evans DG, Stivaros SM. Multifocality in neurofibromatosis type 2. Neuro Oncol. 2014;174:481–482. [DOI] [PMC free article] [PubMed] [Google Scholar]
- 3.Caye-Thomasen P, Baandrup L, Jacobsen GK, Thomsen J, Stangerup SE. Immunohistochemical demonstration of vascular endothelial growth factor in vestibular schwannomas correlates to tumor growth rate. Laryngoscope. 2003;113(12):2129–2134. [DOI] [PubMed] [Google Scholar]
- 4.Caye-Thomasen P, Werther K, Nalla A, et al. VEGF and VEGF receptor-1 concentration in vestibular schwannoma homogenates correlates to tumor growth rate. Otol Neurotol. 2005;26(1):98–101. [DOI] [PubMed] [Google Scholar]
- 5.Plotkin SR, Merker VL, Halpin C, et al. Bevacizumab for progressive vestibular schwannoma in neurofibromatosis type 2: a retrospective review of 31 patients. Otol Neurotol. 2012;33(6):1046–1052. [DOI] [PubMed] [Google Scholar]
- 6.Plotkin SR, Stemmer-Rachamimov AO, Barker FG, II, et al. Hearing improvement after bevacizumab in patients with neurofibromatosis type 2. N Engl J Med. 2009;361(4):358–367. [DOI] [PMC free article] [PubMed] [Google Scholar]
- 7.Hawasli AH, Rubin JB, Tran DD, et al. Antiangiogenic agents for nonmalignant brain tumors. J Neurol Surg B Skull Base. 2013;74(3):136–141. [DOI] [PMC free article] [PubMed] [Google Scholar]
- 8.Mautner VF, Nguyen R, Kutta H, et al. Bevacizumab induces regression of vestibular schwannomas in patients with neurofibromatosis type 2. Neuro Oncol. 2010;12(1):14–18. [DOI] [PMC free article] [PubMed] [Google Scholar]
- 9.Eminowicz GK, Raman R, Conibear J, Plowman PN. Bevacizumab treatment for vestibular schwannomas in neurofibromatosis type two: report of two cases, including responses after prior gamma knife and vascular endothelial growth factor inhibition therapy. J Laryngol Otol. 2012;126(1):79–82. [DOI] [PubMed] [Google Scholar]
- 10.Alanin MC, Klausen C, Caye-Thomasen P, et al. The effect of bevacizumab on vestibular schwannoma tumour size and hearing in patients with neurofibromatosis type 2. Eur Arch Otorhinolaryngol. 2014; doi:10.1007/s00405-014-3398-3. [DOI] [PubMed] [Google Scholar]
- 11.London NR, Gurgel RK. The role of vascular endothelial growth factor and vascular stability in diseases of the ear. Laryngoscope. 2014;124(8):E340–E346. [DOI] [PubMed] [Google Scholar]
- 12.Flaherty KT, Rosen MA, Heitjan DF, et al. Pilot study of DCE-MRI to predict progression-free survival with sorafenib therapy in renal cell carcinoma. Cancer Biol Ther. 2008;7(4):496–501. [DOI] [PubMed] [Google Scholar]
- 13.LaViolette PS, Cohen AD, Prah MA, et al. Vascular change measured with independent component analysis of dynamic susceptibility contrast MRI predicts bevacizumab response in high-grade glioma. Neuro Oncol. 2013;15(4):442–450. [DOI] [PMC free article] [PubMed] [Google Scholar]
- 14.Akisik MF, Sandrasegaran K, Bu G, Lin C, Hutchins GD, Chiorean EG. Pancreatic cancer: utility of dynamic contrast-enhanced MR imaging in assessment of antiangiogenic therapy. Radiology. 2010;256(2):441–449. [DOI] [PubMed] [Google Scholar]
- 15.Pope WB, Qiao XJ, Kim HJ, et al. Apparent diffusion coefficient histogram analysis stratifies progression-free and overall survival in patients with recurrent GBM treated with bevacizumab: a multi-center study. J Neurooncol. 2012;108(3):491–498. [DOI] [PMC free article] [PubMed] [Google Scholar]
- 16.Li KL, Buonaccorsi G, Thompson G, et al. An improved coverage and spatial resolution–using dual injection dynamic contrast-enhanced (ICE-DICE) MRI: a novel dynamic contrast-enhanced technique for cerebral tumors. Magn Reson Med. 2012;68(2):452–462. [DOI] [PubMed] [Google Scholar]
- 17.Zhu XP, Li KL, Kamaly-Asl ID, et al. Quantification of endothelial permeability, leakage space, and blood volume in brain tumors using combined T1 and T2* contrast-enhanced dynamic MR imaging. J Magn Reson Imaging. 2000;11(6):575–585. [DOI] [PubMed] [Google Scholar]
- 18.Tofts PS. Modeling tracer kinetics in dynamic Gd-DTPA MR imaging. J Magn Reson Imaging. 1997;7(1):91–101. [DOI] [PubMed] [Google Scholar]
- 19.Fritz-Hansen T, Rostrup E, Sondergaard L, Ring PB, Amtorp O, Larsson HB. Capillary transfer constant of Gd-DTPA in the myocardium at rest and during vasodilation assessed by MRI. Magn Reson Med. 1998;40(6):922–929. [DOI] [PubMed] [Google Scholar]
- 20.Sener RN. Diffusion magnetic resonance imaging of solid vestibular schwannomas. J Comput Assist Tomogr. 2003;27(2):249–252. [DOI] [PubMed] [Google Scholar]
- 21.Wong HK, Lahdenranta J, Kamoun WS, et al. Anti-vascular endothelial growth factor therapies as a novel therapeutic approach to treating neurofibromatosis-related tumors. Cancer Res. 2010;70(9):3483–3493. [DOI] [PMC free article] [PubMed] [Google Scholar]