

Abstract
Background
Therapeutic targeting of the immune checkpoints cytotoxic T-lymphocyte-associated molecule-4 (CTLA-4) and PD-1/PD-L1 has demonstrated tumor regression in clinical trials, and phase 2 trials are ongoing in glioblastoma (GBM). Previous reports have suggested that responses are more frequent in patients with tumors that express PD-L1; however, this has been disputed. At issue is the validation of PD-L1 biomarker assays and prognostic impact.
Methods
Using immunohistochemical analysis, we measured the incidence of PD-L1 expression in 94 patients with GBM. We categorized our results according to the total number of PD-L1-expressing cells within the GBMs and then validated this finding in ex vivo GBM flow cytometry with further analysis of the T cell populations. We then evaluated the association between PD-L1 expression and median survival time using the protein expression datasets and mRNA from The Cancer Genome Atlas.
Results
The median percentage of PD-L1-expressing cells in GBM by cell surface staining is 2.77% (range: 0%–86.6%; n = 92), which is similar to the percentage found by ex vivo flow cytometry. The majority of GBM patients (61%) had tumors with at least 1% or more PD-L1-positive cells, and 38% had at least 5% or greater PD-L1 expression. PD-L1 is commonly expressed on the GBM-infiltrating T cells. Expression of both PD-L1 and PD-1 are negative prognosticators for GBM outcome.
Conclusions
The incidence of PD-L1 expression in GBM patients is frequent but is confined to a minority subpopulation, similar to other malignancies that have been profiled for PD-L1 expression. Higher expression of PD-L1 is correlated with worse outcome.
Keywords: cancer stem cells, glioblastoma, immune suppression, PD-1, PD-L1
Immune evasion and suppression created by glioblastoma (GBM) itself is a primary factor preventing current immunotherapies from effectively fighting GBM. GBM creates an immunosuppressive microenvironment within the brain, thus facilitating the growth and malignant properties of the lesion while evading the body's immune system.1–3 Thus, there is significant interest in using immune therapeutics to counteract these effects in GBM.4 Programmed cell death 1 (PD-1) and its ligand, programmed cell death ligand 1 (PD-L1), mediate the immunosuppressive effects of tumors by promoting T cell apoptosis and the induction of Tregs.5 The PD-1 ligand, PD-L1(also known has B7-H1), has been observed to be overexpressed in GBMs and GBM-associated macrophages.6–8 Recently, PD-L1 was shown to be expressed in more than 88% of GBMs, but it was not a negative prognosticator of survival.9
Antibody therapy targeting PD-L1 and PD-1 has been shown to exert antitumor effects by reversing the immunosuppressive effects of PD-1.10 Several anti-PD-1 antibodies (eg, nivolimumab, pembrolizumab) have also been clinically tested in melanoma patients,11–13 with FDA approval of nivolimumab and pembrolizumab in 2014. Ipilimumab, co-administered with nivolumab in melanoma patients, has demonstrated an objective response rate of 47%,14 indicating that targeting both of these immune checkpoints can result in potent synergy. Antibody targeting of the PD-1/PD-L1 axis has demonstrated robust preclinical efficacy in an established murine model of glioma, including use in synergy with ipilimumab.15
Currently, Bristol-Meyers Squibb is sponsoring a phase 3 clinical trial of nivolumab and ipilimumab in GBM patients. As such, we wanted to further delineate the prognostic impact of the PD-1/PD-L1 axis in GBM patients, clarify whether the glioblastoma stem cells (GSCs) and/or the infiltrating immune cells are contributing to this mechanism of immune suppression within the GBM microevironment, and verify if GBMs possess such extraordinarily high levels of PD-L1 expression as has been previously reported.
Methods
Cell Lines
The murine glioma GL261 cell line was obtained from the National Cancer Institute-Frederick Cancer Research Tumor Repository, and the U87 cell line was obtained from ATCC. Both were maintained in Dulbecco's modified Eagle's medium (Life Technologies) supplemented with 10% fetal bovine serum (Atlanta Biologicals), 1% penicillin/streptomycin (Life Technologies), and 1% L-glutamine (Life Technologies). The cell cultures were split (1:2) every 3 days to ensure logarithmic growth. For flow cytometry, the cells were harvested, washed, and then stained for 30 minutes at 4°C (U87, M1H1; GL261, M1H5; BD Biosciences). Cell lines WM35 and HEK293 were obtained from ATCC and maintained in Roswell Park Memorial Institute medium (RPMI) 1640 GlutaMAX supplemented with 10% fetal bovine serum, 10 mm HEPES, 1 mm sodium pyruvate, and penicillin/streptomycin (Life Technologies). GSCs were cultured in Dulbecco's modified Eagle's medium F-12 containing 20 ng/mL of epidermal growth factor, basic fibroblast growth factor (Sigma), and B27 (1:50; Invitrogen) as a neural stem cell-permissive medium (neurosphere medium) and passaged every 5–7 days. The characteristics of these cells (including the cytogenetics, limiting dilution assays, tumorigenicity, CD133 expression, and immune-suppressive properties) have been previously published.16,17 GSCs were washed, disassociated with Accutase, and examined for PD-L1 expression by flow cytometry (M1H1; BD Biosceinces).
Glioma Tumor Microarrays
A GBM-specific tissue microarray (TMA) was constructed under protocol PA12-0136 and contained 99 GBMs that have been previously described.1,18 For TMA construction, two 1 mm cores were obtained per tumor sample. The rationale for using a TMA was to facilitate analysis of the largest number of tumor samples possible. The study neuropathologist (G.N.F.) gathered the tissue sections from the archived paraffin blocks and confirmed the tumor pathologic type. The time from resection to fixation was <20 minutes in all cases, in accordance with the Clinical Laboratory Improvement Amendments standard.
PD-L1 Immunohistochemistry
The antibodies used in this study included Abcam ab 58810, rabbit anti-PD-L1 polyclonal antibody, 1:200 (Abcam,); Abcam clone EPR1161(2), rabbit anti-PD-L1 monoclonal antibody (mAb), 1:100, (Abcam,); clone 7G11 mouse anti-PD-L1 mAb, 1:40, (kindly supplied by Dr. Gordon Freeman, Harvard Medical School, Boston, Massachusetts); and clone 5H1 anti-PD-L1 mAb, 1:100, (kindly supplied by The Mayo Clinic). The 4 µm paraffin-fixed TMA sections were deparaffinized in xylene and rehydrated through graded alcohols (100%, 95%–80%). Antigen retrieval was carried out using citric acid buffer (pH 6.0) for 30 minutes in a steam bath (ab 55810) or using PT Module (EPR1161(2), 7G11, 5H1; Lab Vision Corporation). Endogenous peroxidase activity was quenched by immersion in 0.3% hydrogen peroxide in methanol for 30 minutes at room temperature (ab 58810) or by 3% hydrogen peroxide for 10 minutes at room temperature (EPR1161[2], 7G11, 5H1). Nonspecific binding of the primary antibody was blocked by incubating the sections with 1:100 normal goat serum for 20 minutes at room temperature (ab 58810) or 10% normal horse serum for 30 mintues at room temperature (EPR1161[2], 7G11, 5H1). Sections were then incubated with the respective primary antibody at 4°C overnight. The next day, the slides were incubated with 1:200 secondary biotinylated horse anti-rabbit Ig antibody (ab58810, 7G11, 5H1; Vectastain ABC Kit; Vector Laboratories) at room temperature for 1 hour or with secondary biotinylated horse anti-mouse Ig/rabbit Ig antibody (EPR1161[2], RTU, Vectastain Universal Elite ABC Kit; Vector Laboratories,) at room temperature for 30 minutes. After another 1 hour incubation with the avidin-biotin peroxidase complex (ab58810, 7G11, 5H1; Vectastain ABC Kit, Vector laboratories) or 30 minutes incubation with the avidin-biotin peroxidase complex (EPR1161[2] RTU, Vectastain Universal Elite ABC Kit; Vector Laboratories), visualization was performed with the chromagen 3, 3′-diaminobenzidine (ab58810, DAB, Sigma-Aldrich Corp.; EPR1161(2), 7G11, 5H1; DAB, Dako,). The slides were counterstained with hematoxylin and cover slipped with PerMount.
Ultimately after review with the study neuropathologist (G.N.F.), we found the staining provided by ab58810, 7G11, and 5H1 to be unsatisfactory despite optimization. We proceeded with the staining provided by EPR1161(2) for our ultimate quantification and analysis. For positive controls, sections of human placenta, tonsil tissues, and HEK 293 FFPE cell blocks transfected with PD-L1 (Supplementary material, Figure S1 and Supplementary Materials and Methods) were used. Omission of the primary antibody for placenta, tonsil tissue, and HEK293 FFPE cell blocks transfected with PD-L1 was used as a negative control for staining, as well as WT HEK293 FFPE cell blocks with or without primary antibody. Positive cells showed brownish, intense membrane staining, while negative controls and unstained cells were blue.
Imaging was performed using the Perkin Elmer Vectra 2 microscope. To prevent the influence of human error and bias in tabulating our PD-L1 positivity for the survival analysis, quantitation was performed using Perkin Elmer InForm 2.1 software. In brief, an educated user trained the software to identify the various cell types of interest based on several characteristics including nuclear and cell size, shape, and intensity. Concurrently, the software, using a user-specified threshold, identified DAB-positive cells. Once the system was able to appropriately identify and count the lymphocytes and the threshold was set, a batch analysis was performed on all TMA images. After the analysis was complete, an additional review was performed to confirm that the software had properly identified the desired populations of cells. Cells identified as lymphocytes that were DAB positive were counted and compared with the total cell population.
Glioblastoma Flow Cytometry
To secondarily validate the PD-L1 findings, GBM surgery specimens were processed within 4 hours after resection. Briefly, the tumors were washed in RPMI medium and dissected to remove blood products and surrounding nontumor tissue. The tumor was then mechanically dissociated, enzymatically digested for 1 hour in Liberase at 37°C, passed sequentially through 100 and 70 micron filters, incubated in red cell lysis buffer for 15 minutes, and then spun, blocked, and stained with the PD-L1 antibody (329713; Biolegend) and CD11b antibody (555388; BD Biosciences) or isotype control for 20 minutes at 4°C. For GBM-infiltrating T cell flow cytometry, the filtrate was pelleted by centrifugation and then resuspended in Percoll at a density of 1.03 followed by a 1.095 density underlay. Fluorescence-activated cell sorting (FACS) buffer (PBS + 2% BSA) was gently overlayed on the cell suspension, and the completed gradient was centrifuged for 15 minutes at 1200 g with no brake. Cells were harvested from between the gradients and washed in FACS buffer (PBS + 2% BSA). Cells were refiltered and washed as necessary. T cells were then isolated using the BD Biosciences Human T Lymphocyte Enrichment Set. These cells were then blocked and stained with both CD4 and CD8 antibodies (eBiosciences, 17-0048-41 and 11-0086-41) and either PD-1 or PD-L1 antibodies (Biolegend, 329 905 and 329 705) or the respective isotype controls. Data acquisition was performed using the Beckman Coulter Gallios flow cytometer (Beckman Coulter). Analysis was performed using FlowJo software.
The Cancer Genome Atlas Analysis
Please see the Supplementary Materials and Methods for details on our analysis of The Cancer Genome Atlas (TCGA).
Statistics
For TCGA data analysis, statistical analyses were performed in R (version 3.0.1) (http:///www.r-project.org/), and the statistical significance was defined as a P value <.05. For immunohistochemical survival analyses, Kaplan-Meier curves were generated via GraphPad Prism 6 (Graphpad) software, and significance was evaluated using the log-rank (Mantel-Cox) test and Cox proportional hazards models via R-3.1.2 with package survival (v2.38-1). The ANOVA, 2-sided 2-sample test or paired t test, as appropriate, was used for all other data comparisons using GraphPad Prism 6 software. A threshold of P < .05 was used to determine significance in each experiment.
Results
PD-L1 Expression in Glioblastoma Is Not Ubiquitous
In order to elucidate the expression frequency and incidence in GBM of PD-L1 expression, we stained the GBM TMA with 7G11, 5H1, and ab58810 (Supplementary material, Fig. S2). This revealed heterogenous staining, with the vast majority of the cells demonstrating both membrane and cytoplasmic staining. In the case of the ab58810 antibody, >95% of the GBMs on the TMA had robust and ubiqitious expression of PD-L1. Since these results were outside the levels previously reported for other solid malignancies and since we could not secondarily validate these findings using ex vivo flow cytometry, we therefore developed an immunohistochemical approach using clone EPR1161(2). As a control, HEK293 cells were transfected with PD-L1 with an efficiency of 32.7% as examined by flow cytometry (Supplementary material, Fig. S1). On positive controls of placenta and PD-L1 transfected HEK293, we found specific membrane staining (Fig. 1A–C). EPR1161(2) staining was then conducted on the GBM TMA, which demonstrated membrane-specific staining of PD-L1 (Fig. 1D). Frequently, the PD-L1 expression was found on small round cells, which resembled lymphocytes, with lymphocytes representing up to 28.6% of the positive cells counted (mean: 6.28%) (Fig. 1D). PD-L1 has previously been shown to be expressed on T cells and to play a role in dendritic cell maturation.19 We also found cell-surface staining on other, more pleiomorphic cells within the glioblastoma (Fig. 1E). The median percentage of PD-L1-expressing cells within the glioblastoma was 2.77% (range: 0%–86.6%; n = 94). Notably, the median percentage expression of PD-L1 on lymphocytes was enriched to 69.8%. The majority of GBM patients (60.6%) had tumors with at least 1% or more PD-L1-positive cells; 38.3% had at least 5% or greater PD-L1 expression, 17% had 25% or greater expression, and 5.32% had 50% or greater PD-L1 positive cells.
Fig. 1.

(A) Representative microphotograph of immunohistochemical staining of PD-L1 using the EPR1161(2) antibody in a positive placenta control. (B) PD-L1 expression staining with the EPR1161(2) antibody on representative HEK293 cells stabily transfected with PD-L1 (right panel) versus untransfected cells (left panel). Transfection efficiency by flow cytometry was 33%–35%. (C) Representative examples of the glioblastoma (GBM) tumor stained with the EPR1161(2) antibody demonstrating distinct cell-surface staining of positive cells (100x magnification). Arrows demonstrate clusters of round cells with a morphology consistent with lymphocytes. (D) High magnification (200x) microphotograph demonstrating cell surface staining of small round cells. (E) Representative microphotograph demonstrating cell surface staining of GBM cells (left panel) and high magnification (200x) microphotograph of the same region. (F) Representative histogram demonstrating PD-L1 expression relative to isotype controls as assayed by flow cytometry in a fresh GBM specimen. Only live cells were included in the gated analysis. PD-L1 expression is represented by the solid black line, and the isotype control is the dotted grey line.
Validation of PD-L1 Expression in Glioblastoma
To determine if the PD-L1 expression was an accurate assessment, we next used a second methodology to confirm the frequency of PD-L1 positive cells in GBM. Direct ex vivo staining of GBMs by flow cytometry demonstrated a median level of 3.5% PD-L1 surface-expressing cells (range: 0.64–6.7; n = 5) (Fig. 1F and Supplementary material, Fig. S3). We next expanded this analysis to ascertain if the infiltrating lymphocytes were accouting for the the PD-L1 expression, given the morphology observed on the immunohistochemical staining. Using ex vivo flow cytometry of the GBM, the CD4 and CD8 T cell populations were sorted, and both populations were found to express PD-L1 and PD-1 (Fig. 2). To ascertain if the GSCs are a contributing population for PD-L1 expression, a panel was tested and found to have minimal expression; however, PD-L1 expression is observed in laboratory glioma cell lines such as GL261 and U87 (Fig. 3).
Fig. 2.
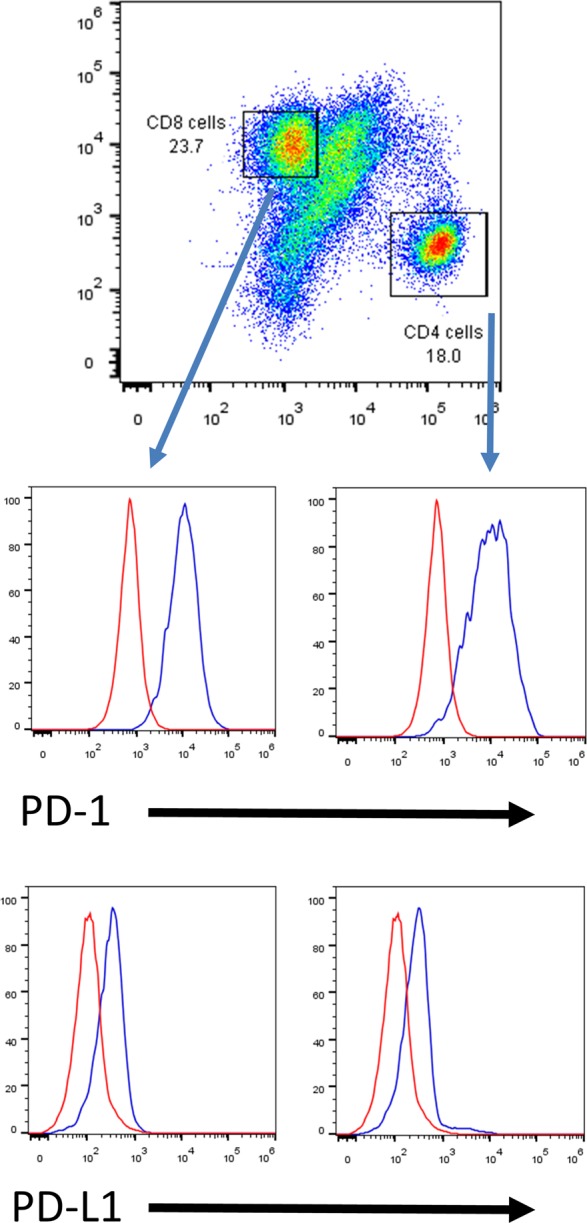
Glioblastoma (GBM) tumor infiltrating CD4+ and CD8+ T cells express both PD-1 and PD-L1. The top FACS plot shows the percentages of tumor infiltrating CD4+ and CD8+ T cells in an enriched mononuclear cell preparation by Percoll gradient isolation from a fresh GBM specimen. The histogram plots presenting positive PD-1 and PD-L1 expression on both CD4+ and CD8+ T cell subsets (red line: isotype; blue line: PD-1 or PD-L1). Replicated in n = 5 specimens with similar results.
Fig. 3.

PD-L1 expression on glioma cells. (A) Histogram plots showing expression levels of PD-L1 on glioma stem cells. (B) Histogram plots showing expression levels of PD-L1 on representative glioma cell lines. The dotted line represents the isotype control, and the black line denotes PD-L1 expression.
PD-1/PD-L1 Axis Expression Is a Negative Prognosticator for Survival in Glioblastoma
We grouped patients into percentiles based on the relative expression of PD-1 and PD-L1 mRNA and then determined cutoff points to significantly split (log-rank test P value <.05) the samples into low/high mRNA groups. For PD-L1 and PD-1, we found that high expression is associated with signicantly shorter survival (P = .023 and P = .028, respectively) (Fig. 4A). The relationship between overall survival (OS) and PD-L1 expression levels (dichotomized at cutoff point 0.37 into low and high) and age (dichotomized at 65 years into younger and older) was examined using a Cox proportional hazards model. Both factors were statistically significant via univariate regression analyses and were included in the multivariable regression model. Patients having high PD-L1 expression levels had an increased estimated risk of death when compared with those having a low relative expression (hazard ratio [HR] = 1.54; 95% CI = 1.05–2.28; P = .0231). Older patients had an increased estimated risk of death when compared with younger patients (HR = 1.7; 95% CI = 1.16–2.49; P = .006). Multivariate analysis demonstrated that both PD-L1 and age are independent factors negatively impacting survival (PD-L1 high versus low: HR = 1.52; 95% CI = 1.03–2.25; P = .0343); older versus younger: HR = 1.68; 95% CI = 1.14–2.47; P = .0084). The MGMT promoter methylation status was excluded as a covariate because it was not complete for the 152 patients.
Fig. 4.

PD-L1 expression and outcome in glioblastoma (GBM). (A) Kaplan-Meier survival estimates of patients with GBM in relation to expression levels of PD-1 and PD-L1 in the tumors based on the The Cancer Genome Atlas (TCGA) datasets. Median survival for the PD-L1 high-expressing group was was 11.42 months versus 14.9 months for the low. Median survival for the PD-1 high-expressing group was 10.63 months versus 14.68 for the low. (B) Kaplan-Meier survival estimates of patients from the GBM tissue microarray comparing high versus low PD-L1 expression by the immunohistochemistry. (C) Kaplan-Meier survival estimates of patients with GBM when accounting for both PD-1 and PD-L1 expression levels in the tumors based on the TCGA datasets. Median survival for the high group was 9.67 months versus 15.88 month for the low.
To further evaluate the prognostic influence of PD-L1 at the protein level, we analyzed the immunohistochemical expression and correlated this with survival. Using the median as a cutoff point, we found that patients with >2.77% of PD-L1 positive cells had a trend toward worse OS (P = .066) (data not shown). However, when we used 5% of positive cells as a cutoff, as has been used in numerous other studies20–22 of solid malignancies, we found that high expression was associated with significantly shorter survival (P = .0086) (Fig. 4B), validating the mRNA data. When we analyzed the mRNA for survival for the combination of low PD-1 and PD-L1 compared with high PD-1 and PD-L1 expression, we found that the combination of high expression of both was also associated with worse survival (P = .0031) (Fig. 4C). The multivariate Cox proportional hazards regression model was also used to investigate the conditional effects of PD-L1 expression to OS, given other demographic and clinical factors (Supplementary material, Table S1). In the multivariate analysis, low PD-L1 expression was still predictive of long OS (HR = 0.554; P = .018). Such an association was unchanged when the dichotomized PD-L1 expressed was replaced with continuous measure (HR = 1.016; P = .0089). None of the interactions between PD-L1 expressions with other covariates such as age, sex, KPS, and extent of resection were significant, indicating that PD-L1 is a prognostic factor for OS in the multivariate setting.
Markers of Cytolytic Activity are Associated With Expression of Immunosuppressive Factors
Recent findings have suggested that cytolytic activity is tied with the expression of immunosuppressive markers.23 As such, we evaluated surrogate markers of T cell cytotolytic activity such as granzyme A and perforin 1 on survival and specifically interacting with PD-L1 expression (Fig. 5). We found that high expression of granzyme A (Fig. 5A), perforin 1 (Fig. 5B), and PD-L1 (Fig. 4B) were indicators of poor survival relative to patients with low expression, including in combination (Fig. 5C and D). These results are likely because of the strong co-associated expression as demonstrated with perforin 1 (PRF1) to PD-L1 (CD274)(r = 0.34; P < .0001; Fig. 6A); perforin 1 with PD-1 (PDCD1) (r = 0.37; P < .0001; Fig. 6B); granzyme A (GZMA) and PD-1 (r = 0.54; P > .0001; Fig. 6C) and granzyme A with perforin (r = 0.55; P < .001; Fig. 6D). We also examined the association between PD-1 and PD-L1 with T cell markers such as CD3, CD4, and CD8. As expected, PD-1 was associated with all markers of T cell subsets including CD3, CD4, and CD8. Interestingly—and confirmatory of the immunohistochemistry and ex vivo flow cytometry—was an association of PD-L1 with CD3 (r = 0.21; P = .0099) and CD4 (r = 0.33; P < .001) (Supplementary material, Fig. S4) indicating the association with suppressed/exhausted T cells and/or Tregs.
Fig. 5.

Expression of markers of cytotoxicity and outcome in glioblastoma (GBM). (A) Kaplan-Meier survival estimates of patients with a GBM in relation to expression levels of Granzyme A (GZMA). Median survival for the high-expressing group was 10.54 months versus 14 months for the low. (B) Kaplan-Meier survival estimates of patients with GBM in relation to expression levels of PRF1. Median survival for the high-expressing was 10.63 months versus 15.08 for the low. (C) Kaplan-Meier survival estimates of patients from the TCGA dataset when expression of both GZMA and PRF1 are high (median survival: 5.38 mo) compared with low expression (median survival: 14.59 mo). (D) Kaplan-Meier survival estimates show a difference in survival when there is co-associated high expression of GZMA, PRF1 and PD-L1 (median survival: 5.54 mo) relative to low expression (median survival:16.73 mo) or other combinations of expression.
Fig. 6.

Correlation of markers of cytotoxicity and immunosuppression in glioblastoma. (A) High expression of PRF1 is correlated positively with PD-L1. (B) High expression of PD-1 is positively correlated with PRF1 and (C) GZMA. (D) GZMA and PRF1 expression are positively correlated with each other.
Discussion
Precision medicine, in which a therapeutic is matched to the genetic features of a malignancy,24 will become increasingly more common, even in the context of immune therapeutics. The precedent for this type of strategy in GBM was set by the selection of patients with GBM tumors that express the epidermal growth factor receptor variant III to receive rindopepimut.25–27 Currently, there is an active phase 2 clinical trial of a PD-1 inhibitor in GBM patients that does not require a specified expression level of PD-L1 (NCT02017717). An analysis of PD-L1 expression in GBM tumors has recently been published, in which 88% of newly diagnosed GBMs demonstrated robust, diffuse, and near-ubiquitous staining.9 By the investigators’ own admission, this was acknowledged as being highly relative to other types of tumors such as melanoma and non–small cell lung carcinoma, in which only about 30% have PD-L1 expression.28,29 In the previous GBM PD-L1 expression study, the investigators used the noncommercial 5H1 anti-PD-L1 antibody,28 which was used to correlate the clinical response in the melanoma clinical trial. However, this correlation has recently been called into question.30,31 Notably, Bristol-Meyers Squibb is using the 28-8 antibody for the Phase 3 GBM clinical trial, for which the commercial kit should be available soon from AbCam. The challenges of companion biomarkers, including their sensitivity and specificity, staining methods, and antibodies used (including their intrinsic abilities to detect various levels of PD-L1 expression, their cutpoints for being declared positive, and variability, among other limitations) have been previously documented32 and provide signficiant logistical challenges for the implementation of precision medicine.
Because the incidence of PD-L1 expression on GBM was unclear using different immunohistochemical analysis, 2 methods were used here to define PD-L1 expression in GBM. The ex vivo flow cytometry and immunohistochemical analysis both yielded modest but consistently positive PD-L1 expression in most GBM samples, further supporting the validity of these methods. While the total number of PD-L1 positive-staining cells was not routinely high, we used a stringent immunohistochemical testing protocol validated with a PD-L1-expressing U293 cell line. Our reported PD-L1 expression frequency is consistent with the descriptions of PD-L1 expression by other groups.20
Given the discrepancy between the findings of Berghoff et al and our group reporting a median percentage of PD-L1 expressing cells of 2.7%, there may be a significant difference of anticipated benefit to checkpoint blockade therapeutics and need for stratification. Multiple steps are required for an optimized antitumor immune response including the presence of an antigenic target, immune cell activation, trafficking of lymphocytes to the tumor microenvironment, and maintenance of the effector function. It is possible that a small amount of PD-L1 expression could be sufficient to restrain the immune system and that the clinical responders will be the subset of patients with antigen-enriched tumors in which there are preexisting T cells within the GBM microenvironment indicative of immune activation and trafficking. However, if we accept the adaptive resistance model proposed in melanoma, where brisk T cell infiltrates induce PD-L1 expression through mediators such as IFN-γ,33,34 it is possible that the relatively low PD-L1 expression found here could be indicative of relatively low T cell infiltration, specifically of CD8+ cells and their associated pro-inflammatory cytokines in the tumor microenvironment, which would mean that most GBMs would not respond to PD-1 blockade therapy. This is also akin to recent data emerging on EGFR- and ALK-driven non–small cell lung cancers, in which relatively low levels of T cell infiltrates and PD-L1 expression on tumor cells were found compared with more mutated smoking-related lung cancers.35 In fact, the possiblility of PD-1 blockade being contraindicated in these lung cancers versus more highly mutated smoking-related lung cancer is now being debated, and this may also need to be considered in GBM.
Preclinical testing of immune checkpoint efficacy has been conducted in clonotypic model systems.2,15 Given the heterogeneity and lower levels of PD-L1 in human GBM relative to the clonotypic cell lines, the therapeutic benefit in patients may be lower than that observed within these models. We found that commonly used glioma cell lines demonstrated robust expression of PD-L1. However, GSCs do not express appreciable levels of PD-L1. Testing the therapeutic effects of checkpoint inhibitors would be challenging in humanized GSC xenograft murine models. However, PD-L1 knockout glioma cell lines could be created and mixed with the PD-L1-expressing parental lines to determine the threshold level of expression that correlates with a therapeutic effect. This expression level could then be validated in a prospective manner in the clinical trial. Alternatively, the threshold level of PD-L1 expression and clinical response may be identified in a retrospective manner in ongoing clinical trials. On a final note, our study used an automated system for non-biased quantification of PD-L1 positive status. Once the computer is properly trained, multiple slides can be quantified quickly, easily, and reproducibly, allowing for reliable stratification of patients in clinical trials.
In contrast to the previously reported modest improvement in survival across various tumor types with high expression of cytolytic factors,23 we found the opposite result in GBM patients. High expression of GZMA and PRF1 were significantly associated with lower survival in GBM patients. This discrepancy can be reconciled if negative prognostic, immune suppression predominates and overrides the effector responses. By both immunohistochemistry and flow cytometry, tumor-infiltrating lymphocytes expressed PD-L1. PD-L1 expression has been previously documented on suppressed T cells,36,37 and our findings would support the notion that PD-L1 expression on T cells within the GBM microenvironment may be another immune-suppressive mechanism operational in these patients. PD-L1 may operate through an alternative T cell suppressive signaling pathway based on studies showing that CD80 can interact with PD-L1. In this case, inhibition occurs because CD80 has a higher affinity for binding PD-L1 than for CD28; thus, PD-L1 on tumor-infiltrating T cells may sequester CD80 away from CD28 and prevent CD28 co-stimulation, thereby inhibiting T cell activation.38–40 This is a unique mechanism of T cell suppression that has not been considered enough in tumor immunology due to the field's overwhelming fixation on the PD-1-PD-L1 axis. Our findings would support the notion that the T cells within the GBM microenvironment may represent a highly suppression-prone phenotype, especially since the simultaneous expression of GZMA/PRF1 with PD-1 may be a marker for these cells.41 Finally, the operational mechanisms of immune suppression may be different in various GBM subsets since PD-L1 expression has been shown to be more pronounced in the mesenchymal GBM type, which has also been shown to have a higher inflammatory effector signature relative to other subtypes.42
In the survival analysis using both the TCGA and TMA data sets, our study found that high PD-L1 expression is a statistically significant negative prognosticator. When the TCGA dataset was analyzed using a multivariant assessment of PD-1 and PD-L1 expression, significant impact was found on outcome. The Bergoff et al study found no prognostic impact of PD-L1 expression in GBM patients. However, they used level 2 Agilent microarray gene expression data for their analysis. Indeed, when we reviewed that same data, we did not find any survival difference between high- and low-expressing groups, but we did find differences when using the RNASeq data, which were consistent with the outcomes obtained from the GBM TMA. Previous studies have shown that the 2 Agilent and the RNASeq data are often discordant.43
Conclusion
PD-L1 expression in GBM patients is frequent but is largely confined to a minority subpopulation—similar to other malignancies that have been profiled for PD-L1 expression. Higher expression of PD-L1 is correlated with worse outcome, and proper stratification of PD-L1-positive and -negative patients may become an important criterion for high-quality immunotherapeutic trials in GBM. Expression of PD-L1 on infiltrating lymphocytes also suggests that a unique immune-suppressive pathway may operate in GBM.
Supplementary Material
Funding
The Dr. Marnie Rose Foundation and the National Institutes of Health CA1208113, P50 CA093459, P50 CA127001 and P30 CA016672.
Supplementary Material
Acknowledgments
The authors would like to acknowledge the Flow Cytometry and Cellular Imaging Core Facility at the MD Anderson Cancer Center, funded by the National Cancer Institute # CA16672, for their assistance with flow cytometry data acquisition and Dr. Gordon Freeman, Dana Farber Cancer Institute, Harvard University, Boston, MA 02215, for provision of the 7G11 mAb clone. Special thanks to David Wildrick, Lamonne Crutcher, and Audria Patrick for their editorial and administrative support and to Yongjie Ji for her technical assistance.
Conflicts of interest statement. None declared.
References
- 1.Heimberger AB, Abou-Ghazal M, Reina-Ortiz C, et al. Incidence and prognostic impact of FoxP3+ regulatory T cells in human gliomas. Clin Cancer Res. 2008;14(16):5166–5172. [DOI] [PubMed] [Google Scholar]
- 2.Fecci PE, Mitchell DA, Whitesides JF, et al. Increased regulatory T-cell fraction amidst a diminished CD4 compartment explains cellular immune defects in patients with malignant glioma. Cancer Res. 2006;66(6):3294–3302. [DOI] [PubMed] [Google Scholar]
- 3.El Andaloussi A, Lesniak MS. An increase in CD4+CD25+FOXP3+ regulatory T cells in tumor-infiltrating lymphocytes of human glioblastoma multiforme. Neuro Oncol. 2006;8(3):234–243. [DOI] [PMC free article] [PubMed] [Google Scholar]
- 4.Thomas AA, Ernstoff MS, Fadul CE. Immunotherapy for the treatment of glioblastoma. Cancer J. 2012;18(1):59–68. [DOI] [PMC free article] [PubMed] [Google Scholar]
- 5.Intlekofer AM, Thompson CB. At the bench: preclinical rationale for CTLA-4 and PD-1 blockade as cancer immunotherapy. J Leukoc Biol. 2013;94(1):25–39. [DOI] [PMC free article] [PubMed] [Google Scholar]
- 6.Parsa AT, Waldron JS, Panner A, et al. Loss of tumor suppressor PTEN function increases B7-H1 expression and immunoresistance in glioma. Nat Med. 2007;13(1):84–88. [DOI] [PubMed] [Google Scholar]
- 7.Bloch O, Crane CA, Kaur R, Safaee M, Rutkowski MJ, Parsa AT. Gliomas promote immunosuppression through induction of B7-H1 expression in tumor-associated macrophages. Clin Cancer Res. 2013;19(12):3165–3175. [DOI] [PMC free article] [PubMed] [Google Scholar]
- 8.Liu Y, Carlsson R, Ambjorn M, et al. PD-L1 expression by neurons nearby tumors indicates better prognosis in glioblastoma patients. J Neurosci. 2013;33(35):14231–14245. [DOI] [PMC free article] [PubMed] [Google Scholar]
- 9.Berghoff AS, Kiesel B, Widhalm G, et al. Programmed death ligand 1 expression and tumor-infiltrating lymphocytes in glioblastoma. Neuro Oncol. 2015;17(8):1064–1075. [DOI] [PMC free article] [PubMed] [Google Scholar]
- 10.Hirano F, Kaneko K, Tamura H, et al. Blockade of B7-H1 and PD-1 by monoclonal antibodies potentiates cancer therapeutic immunity. Cancer Res. 2005;65(3):1089–1096. [PubMed] [Google Scholar]
- 11.Hamid O, Robert C, Daud A, et al. Safety and tumor responses with lambrolizumab (anti-PD-1) in melanoma. N Engl J Med. 2013;369(2):134–144. [DOI] [PMC free article] [PubMed] [Google Scholar]
- 12.Robert C, Ribas A, Wolchok JD, et al. Anti-programmed-death-receptor-1 treatment with pembrolizumab in ipilimumab-refractory advanced melanoma: a randomised dose-comparison cohort of a phase 1 trial. Lancet. 2014;384(9948):1109–1117. [DOI] [PubMed] [Google Scholar]
- 13.Topalian SL, Sznol M, McDermott DF, et al. Survival, durable tumor remission, and long-term safety in patients with advanced melanoma receiving nivolumab. J Clin Oncol. 2014;32(10):1020–1030. [DOI] [PMC free article] [PubMed] [Google Scholar]
- 14.Wolchok JD, Kluger HM, Callahan MK, et al. Safety and clinical activity of nivolumab (anti-PD-1, BMS-936558, ONO-4538) in combination with ipilimumab in patients (pts) with advanced melanoma (MEL). Paper presented at: 2013 ASCO Annual Meeting; June 2013; Chicago, IL. [Google Scholar]
- 15.Wainwright DA, Chang AL, Dey M, et al. Durable therapeutic efficacy utilizing combinatorial blockade against IDO, CTLA-4 and PD-L1 in mice with brain tumors. Clin Cancer Res. 2014;2020:5290–5301. [DOI] [PMC free article] [PubMed] [Google Scholar]
- 16.Wei J, Barr J, Kong LY, et al. Glioma-associated cancer-initiating cells induce immunosuppression. Clin Cancer Res. 2010;16(2):461–473. [DOI] [PMC free article] [PubMed] [Google Scholar] [Retracted]
- 17.Wu A, Wei J, Kong LY, et al. Glioma cancer stem cells induce immunosuppressive macrophages/microglia. Neuro Oncol. 2010;12(11):1113–1125. [DOI] [PMC free article] [PubMed] [Google Scholar]
- 18.Abou-Ghazal M, Yang DS, Qiao W, et al. The incidence, correlation with tumor-infiltrating inflammation, and prognosis of phosphorylated STAT3 expression in human gliomas. Clin Cancer Res. 2008;14(24):8228–8235. [DOI] [PMC free article] [PubMed] [Google Scholar]
- 19.Talay O, Shen CH, Chen L, Chen J. B7-H1 (PD-L1) on T cells is required for T-cell-mediated conditioning of dendritic cell maturation. Proc Natl Acad Sci USA. 2009;106(8):2741–2746. [DOI] [PMC free article] [PubMed] [Google Scholar]
- 20.Grosso J, Inzunza D, Wu Q, et al. Programmed death-ligand 1 (PD-L1) expression in various tumor types. J ImmunoTher Cancer. 2013;1(Suppl 1):P53. [Google Scholar]
- 21.Choueiri TK, Fay AP, Gray KP, et al. PD-L1 expression in nonclear-cell renal cell carcinoma. Ann Oncol. 2014;25(11):2178–2184. [DOI] [PMC free article] [PubMed] [Google Scholar]
- 22.D'Incecco A, Andreozzi M, Ludovini V, et al. PD-1 and PD-L1 expression in molecularly selected non-small-cell lung cancer patients. Br J Cancer. 2015;112(1):95–102. [DOI] [PMC free article] [PubMed] [Google Scholar]
- 23.Rooney MS, Shukla SA, Wu CJ, Getz G, Hacohen N. Molecular and genetic properties of tumors associated with local immune cytolytic activity. Cell. 2015;160(1–2):48–61. [DOI] [PMC free article] [PubMed] [Google Scholar]
- 24.Collins FS, Varmus H. A new initiative on precision medicine. N Engl J Med. 2015;3729:793–795. [DOI] [PMC free article] [PubMed] [Google Scholar]
- 25.Sampson JH, Aldape KD, Archer GE, et al. Greater chemotherapy-induced lymphopenia enhances tumor-specific immune responses that eliminate EGFRvIII-expressing tumor cells in patients with glioblastoma. Neuro Oncol. 2011;13(3):324–333. [DOI] [PMC free article] [PubMed] [Google Scholar]
- 26.Sampson JH, Heimberger AB, Archer GE, et al. Immunologic escape after prolonged progression-free survival with epidermal growth factor receptor variant III peptide vaccination in patients with newly diagnosed glioblastoma. J Clin Oncol. 2010;28(31):4722–4729. [DOI] [PMC free article] [PubMed] [Google Scholar]
- 27.Schuster J, Lai RK, Recht LD, et al. A phase II, multicenter trial of rindopepimut (CDX-110) in newly diagnosed glioblastoma: the ACT III study. Neuro Oncol. 2015;17(6):854–861. [DOI] [PMC free article] [PubMed] [Google Scholar]
- 28.Velcheti V, Schalper KA, Carvajal DE, et al. Programmed death ligand-1 expression in non-small cell lung cancer. Lab Invest. 2014;94(1):107–116. [DOI] [PMC free article] [PubMed] [Google Scholar]
- 29.Weber J, Hamid O, Amin A, et al. Randomized phase I pharmacokinetic study of ipilimumab with or without one of two different chemotherapy regimens in patients with untreated advanced melanoma. Cancer Immun. 2013;13:7. [PMC free article] [PubMed] [Google Scholar]
- 30.Taube JM, Klein A, Brahmer JR, et al. Association of PD-1, PD-1 ligands, and other features of the tumor immune microenvironment with response to anti-PD-1 therapy. Clin Cancer Res. 2014;20(19):5064–5074. [DOI] [PMC free article] [PubMed] [Google Scholar]
- 31.Weber JS, Kudchadkar RR, Yu B, et al. Safety, efficacy, and biomarkers of nivolumab with vaccine in ipilimumab-refractory or -naive melanoma. J Clin Oncol. 2013;31(34):4311–4318. [DOI] [PMC free article] [PubMed] [Google Scholar]
- 32.Kern SE. Why your new cancer biomarker may never work: recurrent patterns and remarkable diversity in biomarker failures. Cancer Res. 2012;72(23):6097–6101. [DOI] [PMC free article] [PubMed] [Google Scholar]
- 33.Spranger S, Spaapen RM, Zha Y, et al. Up-regulation of PD-L1, IDO, and T(regs) in the melanoma tumor microenvironment is driven by CD8(+) T cells. Sci Transl Med. 2013;5(200):200ra116. [DOI] [PMC free article] [PubMed] [Google Scholar]
- 34.Taube JM, Anders RA, Young GD, et al. Colocalization of inflammatory response with B7-h1 expression in human melanocytic lesions supports an adaptive resistance mechanism of immune escape. Sci Transl Med. 2012;4(127):127ra137. [DOI] [PMC free article] [PubMed] [Google Scholar]
- 35.Rosell R, Palmero R. PD-L1 expression associated with better response to EGFR tyrosine kinase inhibitors. Cancer Biol Med. 2015;12(2):71–73. [DOI] [PMC free article] [PubMed] [Google Scholar]
- 36.Latchman YE, Liang SC, Wu Y, et al. PD-L1-deficient mice show that PD-L1 on T cells, antigen-presenting cells, and host tissues negatively regulates T cells. Proc Natl Acad Sci USA. 2004;101(29):10691–10696. [DOI] [PMC free article] [PubMed] [Google Scholar]
- 37.Tendeiro R, Foxall RB, Baptista AP, et al. PD-1 and its ligand PD-L1 are progressively up-regulated on CD4 and CD8 T-cells in HIV-2 infection irrespective of the presence of viremia. AIDS. 2012;26(9):1065–1071. [DOI] [PubMed] [Google Scholar]
- 38.Butte MJ, Keir ME, Phamduy TB, Sharpe AH, Freeman GJ. Programmed death-1 ligant 1 interacts specifically with the B7–1 costimulatory molecule to inhibit T cell responses. Immunity. 2007;27(1):111–122. [DOI] [PMC free article] [PubMed] [Google Scholar]
- 39.Butte MJ, Pena-Cruz V, Kim MJ, Freeman GJ, Sharpe AH. Interaction of human PD-L1 and B7–1. Mol Immunol. 2008;45(13):3567–3572. [DOI] [PMC free article] [PubMed] [Google Scholar]
- 40.Paterson AM, Brown KE, Keir ME, et al. The programmed death-1 ligand 1:B7–1 pathway restrains diabetogenic effector T cells in vivo. J Immunol. 2011;187(3):1097–1105. [DOI] [PMC free article] [PubMed] [Google Scholar]
- 41.Twyman-Saint Victor C, Rech AJ, Maity A, et al. Radiation and dual checkpoint blockade activate non-redundant immune mechanisms in cancer. Nature. 2015;520(7547):373–377. [DOI] [PMC free article] [PubMed] [Google Scholar]
- 42.Doucette TA, Rao G, Rao A, et al. Immune heterogeneity of glioblastoma subtypes: extrapolation from the cancer genome atlas. Cancer Immunol Res. 2013;1(2):112–122. [DOI] [PMC free article] [PubMed] [Google Scholar]
- 43.Guo Y, Sheng Q, Li J, Ye F, Samuels DC, Shyr Y. Large scale comparison of gene expression levels by microarrays and RNAseq using TCGA data. PLoS One. 2013;8(8):e71462. [DOI] [PMC free article] [PubMed] [Google Scholar]
Associated Data
This section collects any data citations, data availability statements, or supplementary materials included in this article.