

Abstract
Perfluorinated compounds (PFCs) have been widely used in industrial applications and consumer products. Their persistent nature and potential health impacts are of concern. Given the high cost of collecting serum samples, this study is to understand whether we can quantify PFC serum concentrations using factors extracted from questionnaire responses and indirect measurements, and whether a single serum measurement can be used to classify an individual’s exposure over a one-year period. The study population included three demographic groups: young children (2–8 years old) (N=67), parents of young children (<55 years old) (N=90), and older adults (>55 years old) (N=59). PFC serum concentrations, house dust concentrations, and questionnaires were collected. The geometric mean of perfluorooctane sulfonic acid (PFOS) was highest for the older adults. In contrast, the geometric mean of perfluorooctanoic acid (PFOA) was highest for children. Serum concentrations of the parent and the child from the same family were moderately correlated (Spearman correlation (r)=0.26–0.79, p<0.05), indicating common sources within a family. For adults, age, having occupational exposure or having used fire extinguisher, frequencies of consuming butter/margarine, pork, canned meat entrées, tuna and white fish, freshwater fish, and whether they ate microwave popcorn were significantly positively associated with serum concentrations of individual PFCs. For children, residential dust concentrations, frequency of wearing waterproof clothes, frequency of having canned fish, hotdogs, chicken nuggets, French fries, and chips, and whether they ate microwave popcorn were significant positive predictors of individual PFC serum concentrations. In addition, the serum concentrations collected in a subset of young children (N=20) and the parents (N=42) one year later were strongly correlated (r=0.68–0.98, p<0.001) with the levels measured at the first visits, but showed a decreasing trend. Children had moderate correlation (r=0.43) between serum and dust concentrations of PFOS, indicating indoor sources contribute to exposure. In conclusion, besides food intake, occupational exposure, consumer product use, and exposure to residential dust contribute to PFC exposure. The downward temporal trend of serum concentrations reflects the reduction of PFCs use in recent years while the year-to-year correlation indicates that a single serum measurement could be an estimate of exposure relative to the population for a one-year period in epidemiology studies.
Keywords: Perfluorinated compounds, Serum, Children, Within-family correlation, Temporal variation
1. Introduction
Perfluorinated compounds (PFCs) have been widely used in industrial applications and consumer products, such as water- and stain-resistant coatings for textiles, oil-resistant coatings for food packaging and cookware, fire-fighting foams, paints, waxes and polishes (Renner, 2001; Seacat et al., 2002). The strong carbon–fluorine bond gives the PFCs their stable and persistent nature in the environment (Blake et al., 1997). PFCs have been detected in human and animals, and have fairly long elimination half-lives (3–9 years) in the body (Olsen et al., 2007). PFCs bind to proteins and are distributed mainly to the blood serum, kidney, and liver (Lau et al., 2007). They have been associated with increased cholesterol and uric acid (Costa et al., 2009; Sakr et al., 2007; Steenland et al., 2010), thyroid disruption (Emmett et al., 2006; Melzer et al., 2010), immune system effects (Fairley et al., 2007; Grandjean et al., 2012; Yang et al., 2002), neurological effects, such as attention deficit hyperactivity disorder (ADHD) among children (Hoffman et al., 2010); reduced human fertility (Joensen et al., 2009), and cancer (Alexander et al., 2003; Gilliland and Mandel, 1993, 2005a). In particular, some PFCs, depending on their chemical structures, can cross the placenta and result in exposure for fetus (Apelberg et al., 2007; Inoue et al., 2004; Kim et al., 2011; Olsen et al., 2009).
In recent years, as manufacturers have voluntarily eliminated or modified the production of PFOS and PFOA, the concentrations of these PFCs have been decreasing in people and in the ecosystem (CDC, 2012; Lindstrom et al., 2011). For example, perfluorooctane sulfonic acid (PFOS) was phased out in the United States in 2002. Since then, a decreasing trend in the concentrations of this compound in the general population has been observed. However, other PFCs are being used to replace PFOS and PFOA.
There have been a number of studies to quantify the distribution of serum PFC levels in adults, including the National Health and Nutrition Examination Survey (NHANES) and studies of American Red Cross adult blood donors (Kato et al., 2011a; Olsen et al., 2011). However, there is less data available on children, a sensitive population (Kato et al., 2009; Mondal et al., 2012; Olsen et al., 2004). There is no information on similarities in PFC exposure between family members within the general population, with the only study focusing on mother–child pairs in a U.S. community known to have contaminated water (Mondal et al., 2012).
Studies examining temporal trends in the population have found levels for some compounds having reached their highest levels and now going down over time (i.e. PFOS), while levels of other compounds have been increasing (i.e. PFNA) (Kato et al., 2011a). The long half-lives of PFCs in the human body indicate that an individual’s serum levels are thought not likely to change substantively within one or two years relative to other members of the population, enabling one to use a single serum measure as an estimate of exposure for such a time period in an epidemiology study. However, there is limited information to date evaluating change over time within individuals in a non-occupational exposed population.
The contribution of various food categories to serum PFC levels has been evaluated using both exposure models utilizing food intake levels combined with measured data on concentrations using a market basket approach and through correlation between food intake rates and serum levels within a population. Fish and other seafood are thought to be major contributors to serum PFCs, especially in populations with high consumption of seafood (Haug et al., 2010; Noorlander et al., 2011; Zhang et al., 2011). Meat is another important contributor in many countries and regions, e.g. Denmark, Norway, and Sweden (Halldorsson et al., 2008; Jain, 2014; Tittlemier et al., 2007; Vestergren et al., 2012). Popcorn and snacks are also identified as important predictors of serum PFCs, likely due to the transfer of PFCs from food packaging (Halldorsson et al., 2008; Ji et al., 2012). Other food types have been identified less consistently, such as, vegetable and potato in Korean population (Ji et al., 2012), and cereals and dairy products, vegetables and fruit in Swedish population (Vestergren et al., 2012). However, the contribution of specific food types to serum PFCs concentrations varies by geographical region, population characteristics, and also varies between specific PFC compounds (Jain, 2014; Zhang et al., 2011). Information on dietary predictors in U.S. is still limited (Jain, 2014).
While food has been identified as the major pathway for the majority of the population in several studies that modeled PFC exposure through multiple pathways (Egeghy and Lorber, 2011; Trudel et al., 2008; Vestergren et al., 2012), dust ingestion was postulated to be important for children and potentially for adults with considerable use of consumer products (Egeghy and Lorber, 2011; Haug et al., 2011; Shoeib et al., 2011). Recently, there have been a number of studies measuring concentrations in indoor dust and air (D’Hollander et al., 2010; Ericson Jogsten et al., 2012; Haug et al., 2011; Knobeloch et al., 2012; Shoeib et al., 2011). Two studies found a correlation between indoor environmental measurements and serum levels among adult populations (Fraser et al., 2011; Haug et al., 2011). More data are needed to determine the relative contributions of food and dust to serum PFCs for both adult and child populations.
The goals of this study were twofold. First, examine the relationship in PFCs concentrations between family members and temporal change of PFC serum levels both in the context of understanding exposures and providing information useful for evaluating the needed measurements in an epidemiology study. Second, determine the relationship between serum concentration of PFCs and questionnaire responses on factors including housing characteristics, food intake frequency, and use of consumer products, as well as PFC concentrations measured in residential dust.
2. Methods
2.1. Study population
Study of Use of Products and Exposure-Related Behavior (SUPERB) collected information on consumer product use, food consumption patterns, and time-activity patterns, by surveys and house visits. Briefly, 499 homes with young children born between 2000 and 2005 were identified through birth certificate records in northern California counties, and 156 households with older adults were selected randomly from housing units in the southern portion of California’s Central Valley.
A total of 139 households were recruited into this sub-study to determine biomarker levels and indoor levels of a suite of organic compounds. Households were contacted randomly until the specified sample size was obtained. From the 90 northern California households, we included both a parent (98% under 55 years) and a young child under the age of 8 years (93% under 5 years). In the 49 households from California’s Central Valley, the study participants were older adults (96% over 55 years); from 10 households we obtained samples for both the husband and wife. After the first study visit, 42 households with a parent-child pair were visited a second time approximately one-year later (mean: 341 days; range: 225–505 days). During this second visit, participants provided a second serum sample to determine the temporal variability of the concentrations of PFCs. Neither of these study regions is known to have elevated environmental contamination from local industrial sources.
SUPERB had a higher fraction of female participants, 82% among the parents of the young children group and 65% among the older adult group. As a result, in this study, we had a female versus male ratio of 9:1 for the parents of young children and a ratio of 7:3 for older adults. Young children’s sex ratio is 1:1. In addition, although SUPERB tried to over-sample participants without a high school diploma, the participating households still had a higher education level than the general population, suggesting higher socioeconomic level of our study participants. Specifically, for the sub-study, education levels were even higher, with 99% of the adults having ≥12 years of education. Demographic information is presented in the supplementary materials (Table S1). Additional details on the recruitment for SUPERB can be found in Hertz-Picciotto et al. (2010). The demographic characteristics should be noted when interpreting results.
All recruitment and data collection protocols were approved by the institutional review boards at the University of California at Davis and the Centers for Disease Control and Prevention (CDC), and informed consent for participation was obtained upon enrollment into the study.
2.2. Data collection
Field staff visited participants’ homes to collect blood samples between December 2007 and November 2009. Trained phlebotomy staff collected blood into a 10 ml red top Vacutainer™ (Becton-Dickinson, Rutherford, NJ) with no anticoagulant, and transported the blood tubes on ice for processing and storage. Blood was allowed to clot for at least 2 h after collection prior to processing. Then, it was centrifuged at 2400 rpm for 15 min. To obtain maximum serum yield, a second centrifugation was performed for 10 min, if needed. Serum was divided into aliquots for analysis; 1 ml was placed in a 2 ml Nalgene® cryovial (Sigma-Aldrich Co. LLC., St Louis, MO) for PFC measurements. All the sample preparation and processing procedures were conducted under a chemical fume hood. Aliquots were stored at −80 °C until shipping overnight on dry ice to CDC for analysis. Blood was not successfully collected from some young children (N=23) because they were not cooperative.
Dust samples were collected at the same visit by a field staff during the home visit using a high volume small surface sampler (HVS3) (CS3 Industries, OR) following a standard protocol (ASTM, 1994). The sampling area is approximately 3600 in2 (~2.3 m2) of carpet or area rug in the main living area of the home. However, in some households, the amount of dust yielded was insufficient for chemical analysis. Samples were stored at −20 °C until analysis.
A home walk-through questionnaire was completed by field staff at the home visit. Participants were asked the age and size of the home, and whether they rented or owned their home.
A phone interview was conducted within one month following the home visit, collecting further information on housing characteristics, activities that may result in contact to PFCs (e.g., general frequency of floor polishing, surface coating, using fire-fighting foam, using stain- or water-repellant product, using nonstick cookware, and wearing stain-repellant garments), and a food frequency questionnaire for commonly consumed food items thought to have a high content of PFCs (Domingo, 2012; Schecter et al., 2010), including butter or margarine, fast food, beef, pork, dairy fat, tuna and white fish, fresh water fish, potatoes, crackers, cookies, and microwave popcorn. The length of breastfeeding for children was also asked. We note that not all participants answered all questions. Sample sizes are listed for each analysis.
A second visit approximately one year later included a blood draw and dust collection.
2.3. Sample analysis
Eight PFCs, perfluorohexane sulfonic acid (PFHxS), perfluorooctane sulfonic acid (PFOS), perfluorooctanoic acid (PFOA), perfluorononanoic acid (PFNA), perfluorodecanoic acid (PFDA), perfluorooctane sulfonamide (PFOSA), 2-(N-methyl-perfluorooctane sulfonamide) acetic acid (Me-PFOSA-ACOH), and 2-(N-ethyl-perfluorooctane sulfonamide) acetic acid (Et-PFOSA-AcOH) were measured at the CDC using online solid-phase extraction coupled to reversed-phase high-performance liquid chromatography–isotope dilution tandem mass spectrometry as described before (Kato et al., 2011b). The limits of detection (LOD) can be found in the supplementary materials (Table S2). In addition to the calibration standards, blanks and quality control (QC) materials, prepared in calf serum, were analyzed along with each batch of samples to ensure the accuracy and reliability of the data. The concentrations of the QCs were evaluated using standard statistical probability rules (Caudill et al., 2008).
Dust samples were extracted and analyzed following the methods of Strynar and Lindstrom (2008) and updated in Reiner et al. (2013) (Caudill et al., 2008). Dust was sieved to ≤150 μm and 100+/−5 mg of dust was analyzed. The PFC concentrations were determined by LC/MS/MS. PFOS, PFHxS, PFOA, PFNA, and PFDA were quantified in the dust samples. The overall precision was 12.4% (relative standard deviation), calculated based on 40 duplicate samples.
2.4. Data analysis
As the serum concentrations of PFCs were log-distributed, geometric mean and geometric standard deviation were calculated. The PFC concentrations below the LOD were replaced by the LOD divided by √2 for the analyzes. The natural log-transformed serum concentrations were compared among the three demographic groups using ANOVA. We also calculated the Spearman correlation coefficients between the serum concentrations of the parent and the child from the same household. Among the older couples, sex differences and correlation within the couple were also quantified using ANOVA based on natural log-transformed data and Spearman correlation coefficients.
To seek potential predictors of serum concentrations of PFCs collected at the first visit in a multiple regression model, a number of variables were examined: housing characteristics, food intake, occupational exposure, and other factors including use of nonstick cookware, stain-repellent for furniture and carpet, and fire-fighting foams. The tested housing variables included dwelling type (apartment vs. single family house), ownership (rent vs. own), age of the house (built before or after 1977 when the California Title 24 was implemented which results in better insulated houses tending to have lower air exchange rates (CEC, 2005)), housing value, and housing size. The age and size of the home were confirmed using publicly available data.
Food intake frequency was recorded in categorical format, including choices of “Never”, “Less than once per week”, “Once per week”, “2–3 times per week”, “4–6 times per week”, “Once per day”, and “More than once per day”, and they were converted into a numeric format in times per week, with values of 0, 0.5, 1, 2.5, 5, 7, 14 respectively. We note that the portion size was not collected in this study.
Consumer products examined were: frequency of using nonstick cookware, frequency of using stain-repellant products, having used a fire extinguisher, having used house-care products that potentially contain PFCs (e.g., polishing and coating), frequency of wearing waterproof clothing, and frequency of wearing stain-resistant clothing. Frequencies were also recorded in categorical format, such as “Never”, “Once a week or more”, “1–3 times per month”, “3–11 times per month”, “Once or twice per year”, “Once every 2–5 years”, “Less than once every 5 years”, and “Don’t know”. Categories were regrouped based on the distribution of individual variables.
The modeling was conducted in two stages. At the first stage, variables were screened to determine if they should be included in the second stage of modeling. For housing variables and consumer product use, each group of related factors were included as independent variables in a mixed-effect multiple regression model for each PFC to predict natural log-transformed serum concentration of the PFC. All of the three demographic groups were in the same model. A random effect for household was included to account for similarities in study participants from the same household. Variables with p<0.10 were included in the second stage model. For food intake frequency variables, a traditional stepwise selection method was used to screen variables for adults and children, respectively, where effects entering a multiple linear regression model at the significance level of 0.15 and staying in the model at the significance level of 0.10. The selected model is chosen to yield the minimum Akaike information criterion (AIC) value. At the second stage, variables with p<0.10 in the first stage of modeling were considered potential contributors to PFC exposure. A second stage multiple linear regression model, including all factors selected in the first stage, was used to determine their impact on serum concentrations for each PFC. At this stage, adults and children were modeled separately and occupational exposure variables were only included in the model for adults.
Temporal variability in the serum concentrations of PFCs was examined in a subset of the participating households with young children, including 42 adults and 19 children. Temporal change and Spearman correlation coefficients were calculated between the serum PFC concentrations obtained in these two visits. Year-to-year difference was expressed as
The distribution of dust concentrations was calculated for the households with young children in Northern California and the households of older adults in central California, respectively. The dust concentrations were matched with participants’ PFC serum concentration by household. Spearman correlation coefficients between dust and serum concentrations were calculated. Data below LOQ were replaced by the LOD divided by √2. Dust concentrations were evaluated in the second stage of the multiple regression modeling, in predicting PFC serum concentrations.
All statistical analyzes were conducted using SAS 9.2 for Windows® (SAS Institute Inc., Cary, NC, USA). Statistical significance was set as α=0.05 (two-sided).
3. Results
3.1. Distribution of serum concentrations
The geometric mean serum concentrations of PFCs are presented in Table 1. Two PFCs, PFOSA and Et-PFOSA-AcOH, were detected in <4% of the samples, and thus were not shown in the table and were not included in the following analysis. The older adult population had the highest PFOS geometric mean, and children had slightly higher levels than the parents. In contrast, for PFOA, a chemical still used in commerce, children had the highest geometric mean, while the adults’ concentrations were much lower (p<0.001). Concentrations of PFOA, PFNA, PFDA, and Me-PFOSA-AcOH were generally higher in children than both adult groups, while for PFOS and PFHxS, older adults had the highest concentrations (Table S3).
Table 1.
Distribution of serum concentrations of PFCs (ng/ml) in Californian children and adults (2008–2009).
| Chemical | GM | GSD | AM | SD | Med | 75th % | 95th % | Max | %>LOD |
|---|---|---|---|---|---|---|---|---|---|
| Children’s (N=68) | |||||||||
| Me-PFOSA-AcOH | 0.35 | 2.72 | 0.57 | 0.66 | 0.35 | 0.70 | 2.01 | 3.14 | 78 |
| PFDA | 0.27 | 1.89 | 0.34 | 0.28 | 0.30 | 0.40 | 0.60 | 2.00 | 82 |
| PFHxS | 1.30 | 1.98 | 1.65 | 1.37 | 1.25 | 2.15 | 3.40 | 9.80 | 100 |
| PFNA | 1.84 | 1.67 | 2.17 | 1.74 | 1.70 | 2.10 | 4.80 | 11.20 | 100 |
| PFOA | 4.46 | 1.50 | 4.87 | 2.40 | 4.50 | 6.15 | 7.40 | 19.50 | 100 |
| PFOS | 6.28 | 1.67 | 7.22 | 4.44 | 6.15 | 8.85 | 13.10 | 26.70 | 100 |
| Parents of young children (N=90) | |||||||||
| Me-PFOSA-AcOH | 0.18 | 2.24 | 0.25 | 0.23 | 0.09 | 0.35 | 0.78 | 1.05 | 49 |
| PFDA | 0.21 | 1.90 | 0.26 | 0.19 | 0.20 | 0.30 | 0.60 | 1.10 | 67 |
| PFHxS | 0.58 | 2.38 | 0.88 | 1.31 | 0.60 | 0.90 | 2.20 | 11.0 | 98 |
| PFNA | 1.04 | 1.69 | 1.19 | 0.60 | 1.00 | 1.60 | 2.20 | 3.30 | 100 |
| PFOA | 1.86 | 1.94 | 2.30 | 1.57 | 1.90 | 3.00 | 5.60 | 7.80 | 100 |
| PFOS | 4.73 | 2.19 | 6.11 | 4.47 | 4.65 | 8.10 | 14.1 | 28.8 | 100 |
| Older adults (N=59) | |||||||||
| Me-PFOSA-AcOH | 0.25 | 2.54 | 0.39 | 0.38 | 0.26 | 0.52 | 1.40 | 1.66 | 68 |
| PFDA | 0.22 | 1.96 | 0.27 | 0.24 | 0.20 | 0.40 | 0.70 | 1.60 | 66 |
| PFHxS | 1.58 | 2.04 | 2.03 | 1.66 | 1.70 | 2.30 | 6.30 | 9.40 | 100 |
| PFNA | 1.46 | 1.50 | 1.58 | 0.60 | 1.50 | 1.90 | 3.00 | 3.40 | 100 |
| PFOA | 2.98 | 1.64 | 3.33 | 1.49 | 3.30 | 4.30 | 6.30 | 7.20 | 100 |
| PFOS | 10.8 | 1.87 | 12.5 | 5.88 | 11.6 | 15.5 | 24.0 | 24.9 | 100 |
GM: geometric mean; GSD: geometric standard deviation; AM: arithmetic mean; SD: standard deviation.
Serum concentrations of the parent and the child from the same family were weakly correlated for most of the PFCs (Table 2). When including only the households with the mothers (N=61), the parent-child correlation coefficients increased slightly. A fairly high correlation was observed for Me-PFOSA-AcOH. This high correlation for Me-PFOSA-AcOH remains even when the samples with undetected levels are excluded (R=0.76, N=54). The concentrations within the two members of the older couple from the same household were not statistically correlated for several PFCs, with significant correlations only observed for PFOS and Me-PFOSA-AcOH. Among our small sample population, older males had higher, though not statistically significant, concentrations of PFOS (p=0.09), PFOA (p=0.10), and PFNA (p=0.10) than their female spouses. The wife of one older couple was a nurse. Though no occupational exposure activities were reported, this woman had high serum concentrations of PFOA and PFHxS (both above the 95th percentile of the older adults’ distribution). After removing this household, PFOA became significantly higher among males than females (p=0.04).
Table 2.
Spearman correlation coefficient (R) of PFCs serum concentrations between parent and child from the same family as well as between husband and wife from the same family (California, USA, 2008–2009).
| Parent vs. child (N=68)
|
Mother vs. child (N=61)
|
Within older couple (N=10)
|
||||
|---|---|---|---|---|---|---|
| R | 95% CIs | R | 95% CIs | R | 95% CIs | |
| Me-PFOSA-AcOH | 0.79 | (0.68, 0.86) | 0.79 | (0.27, 0.87) | 0.79 | (0.27, 0.94) |
| PFDA | 0.31 | (0.07, 0.51) | 0.27 | (0.02, 0.49) | 0.47 | (−0.25, 0.84) |
| PFHxS | 0.32 | (0.09, 0.52) | 0.43 | (0.19, 0.61) | 0.58 | (−0.11, 0.88) |
| PFNA | 0.26 | (0.02, 0.47) | 0.27 | (0.01, 0.48) | 0.27 | (−0.45, 0.76) |
| PFOA | 0.30 | (0.06, 0.50) | 0.32 | (0.07, 0.52) | 0.24 | (−0.47, 0.75) |
| PFOS | 0.30 | (0.06, 0.50) | 0.32 | (0.07, 0.53) | 0.64 | (−0.02, 0.90) |
The serum concentrations of all PFCs within a person were statistically correlated (Table 3). Moderate to strong correlations were observed among PFOS, PFOA, PFNA, and PFHxS, while Me-PFOSA-AcOH was less correlated with the other compounds.
Table 3.
Pairwise correlations of serum concentrations of five PFCs (N=217) (California, USA, 2008–2009).
| Me-PFOSA-AcOH | PFDA | PFHxS | PFNA | PFOA | |
|---|---|---|---|---|---|
| PFDA | 0.15* | ||||
| PFHxS | 0.31** | 0.24** | |||
| PFNA | 0.30** | 0.67** | 0.53** | ||
| PFOA | 0.34** | 0.58** | 0.54** | 0.75** | |
| PFOS | 0.38** | 0.37** | 0.67** | 0.52** | 0.50** |
p<0.05.
p<0.01.
3.2. Association with dust level in the main living area
Concentrations of five PFCs in dust samples were not statistically different between the houses with young children and the houses of older adults (Table 4). PFOA had highest dust concentrations among the five chemicals.
Table 4.
PFC concentrations in residential dust in California, USA (2008–2009) (ng/g).
| Chemical | % Detected | GM | GSD | AM | SD | Med | 75th % | 95th % | Max |
|---|---|---|---|---|---|---|---|---|---|
| Parents of young children (N=82) | |||||||||
| PFOS | 87 | 29.0 | 5.23 | 195 | 772 | 18.6 | 83.7 | 846 | 6670 |
| PFOA | 89 | 41.4 | 4.54 | 149 | 367 | 37.1 | 120 | 560 | 2360 |
| PFHxS | 51 | 3.47 | 29.0 | 142 | 837 | 5.30 | 11.3 | 289 | 7490 |
| PFDA | 69 | 8.51 | 9.11 | 67.7 | 289 | 8.75 | 22.3 | 211 | 2520 |
| PFNA | 65 | 13.3 | 4.31 | 67.4 | 243 | 9.70 | 24.7 | 213 | 1910 |
| Older adults (N=42) | |||||||||
| PFOS | 85 | 34.6 | 5.01 | 118 | 215 | 34.05 | 97.7 | 439 | 1040 |
| PFOA | 91 | 45.0 | 3.96 | 105 | 152 | 48.05 | 121 | 355 | 728 |
| PFHxS | 52 | 3.77 | 24.8 | 55.0 | 181 | 5.55 | 19.2 | 124 | 1050 |
| PFDA | 70 | 7.76 | 11.5 | 37.4 | 76.7 | 8.20 | 21.7 | 224 | 355 |
| PFNA | 72 | 14.7 | 4.12 | 58.5 | 157 | 11.85 | 24.3 | 226 | 883 |
GM: geometric mean; GSD: geometric standard deviation; AM: arithmetic mean; SD: standard deviation.
One dust sample for each household; duplicate samples not included.
The correlation between serum and dust concentrations was generally low. Statistically significant correlations were observed for PFOS among children (R=0.44, p=0.001) and for PFDA among children (R=0.26, p=0.04) and parents (R=0.27, p=0.02). Dust concentrations of PFOA were marginally correlated to older adults’ serum concentration (R=0.26, p=0.06). No other statistically significant correlations were observed.
3.3. Predictor analysis
3.3.1. Variables screening stage
Multiple linear regression models were run for each category of variables (housing variables, consumer product use, and food intake). As can be seen in Table 1, PFC serum concentrations were significantly different among the three demographic groups. We include the participants’ actual age in all regression models. Housing variables were not significantly associated with the concentration of serum PFCs (see results in Table S4).
Intake frequencies of different food categories were identified as significant predictors for adults and children, respectively. For adults, intake of butter/margarine, pork, canned meat entrées (e.g., stews, chili, ravioli), tuna and white fish, freshwater fish, French fries, and graham crackers as well as microwave popcorn were associated with elevated serum concentrations of individual PFCs (Table S5). The intake of canned meat, canned fish and crackers other than graham crackers were negatively associated with PFC serum concentrations, but the reasons are unclear. For children, intake of poultry, canned fish, hotdogs, and chicken nuggets as well as microwave popcorn were associated with elevated serum concentrations of individual PFCs (Table S6). In addition, the length for which a child was breastfed was associated with the serum concentrations of PFOS and PFHxS, with the children breastfed more than 6 months having higher serum concentrations than those breastfed less than 1.5 months.
For factors related to consumer product use, we observed significantly higher concentrations of PFOS (p=0.04) and marginally significantly higher concentrations of PFDA (p=0.07), PFOA (p=0.07) and PFHxS (p=0.05) for participants wearing stain-repellant clothes once per week or more (N=9 among 119 individuals responding). In addition, a questionnaire asked if the participant or others in their work environment used products likely to contain PFCs including stain-repellant (like Scotchgard) for sealants or stains (N=1), waxes (N=4), lubricants (N=6), polishes (N=4), fast food packaging (like French fry boxes and paper wrappings) (N=3), paint (N=4), lacquer or varnish (N=2), floor treatments (N=2), or any sort of water- or soil-repellant (N=1). Only half of the participants (9 out of 17) who reported having occupation exposure based on a positive response to use of any of the products above had higher serum concentrations observed (defined as >70th percentile). The occupations of those nine reporting occupational exposure and also having high serum PFC levels included some professions that seemed to plausibly come in contact with these chemicals (tile setter, farmer, house cleaner and dental hygienist) while for others the use was less obvious from the job title (such as elementary school teacher, training supervisor, marriage counselor). Two of these participants did not report their job titles. We suspect it is difficult for participants to identify occupational exposure. We created a variable to label the participants who reported occupational exposure and had elevated serum PFC concentrations as well as participants who had used firefighting foams (N=4, likely nonoccupational exposure as three were employed in office environments and one was retired), as that exposure may confound the impact of other variables. Higher concentrations were observed among people with such exposure. No correlation was observed with the use of non-stick cookware (N=100 among 138 households responding) or the use of stain-repellant for carpet or furniture (N=28 among 139 households responding).
3.3.2. Second stage model
Results of the second stage models for adults and children are shown in Tables 5 and 6, respectively. For adults, age is positively associated with serum concentrations for all PFCs except PFDA, and having occupational exposure or having used fire extinguisher is a significant predictor for all PFCs except Me-PFOSA-AcOH. Significant food predictors were basically consistent with the model that only included food. The dust concentration was not statistically significant when included in the models with food and other exposures, suggesting that it was not a major exposure route for the adult population. The variance explained by the second stage model (R-square) ranges from 0.20 to 0.51 for different PFCs, much improved from the food-only model with R-square of 0.13–0.44.
Table 5.
Regression analysis of predicting natural log-transformed serum concentrations of PFCs for adults in California, USA (2008–2009).
| Nb | PFOS
|
PFOA
|
PFNA
|
PFDA
|
PFHxS
|
Me-PFOSA-AcOH
|
||||||
|---|---|---|---|---|---|---|---|---|---|---|---|---|
| 128
|
132
|
128
|
132
|
128
|
128
|
|||||||
| Effect | Slope (SE) | p | Slope (SE) | p | Slope (SE) | p | Slope (SE) | p | Slope (SE) | p | Slope (SE) | p |
| Intercept | 0.01 (0.21) | 0.95 | −0.11 (0.17) | 0.51 | −0.79 (0.16) | <.01 | −1.73 (0.13) | <.01 | −1.95 (0.25) | <.01 | −2.65 (0.27) | <.01 |
| Adults’ age (year) | 0.03 (0.04) | <.01 | 0.02 (0.03) | <.01 | 0.01 (0.003) | <.01 | 0.04 (0.005) | <.01 | 0.02 (0.005) | <.01 | ||
| Occupational exposure or having used fire extinguisher (yes/no) | 0.64 (0.18) | <.01 | 0.67 (0.16) | <.01 | 0.48 (0.13) | <.01 | 0.30 (0.17) | 0.08 | 0.80 (0.23) | <.01 | ||
| Frequency of having pre-packaged candy or bakery items (ref=never) | ||||||||||||
| <1 Time/week | 0.38 (0.18) | 0.04 | ||||||||||
| ≥1 Time/week | −0.14 (0.17) | 0.39 | ||||||||||
| Frequency of eating (time/week) | ||||||||||||
| Butter or margarine | 0.04 (0.02) | 0.02 | 0.06 (0.02) | 0.01 | ||||||||
| Dairy fat | −0.01 (0.01) | 0.10 | 0.03 (0.01) | <.01 | ||||||||
| Pork | 0.07 (0.04) | 0.09 | 0.05 (0.03) | 0.09 | 0.11 (0.04) | 0.01 | ||||||
| Beef | 0.08 (0.03) | 0.03 | −0.09 (0.04) | 0.04 | ||||||||
| Canned meat | −0.81 (0.17) | <.01 | −0.32 (0.13) | 0.01 | −0.38 (0.17) | 0.02 | −0.51 (0.21) | 0.02 | ||||
| Canned meat entrée | 0.18 (0.07) | 0.01 | 0.19 (0.08) | 0.02 | 0.20 (0.08) | 0.02 | ||||||
| Canned fish | −0.15 (0.07) | 0.03 | −0.12 (0.06) | 0.04 | −0.12 (0.07) | 0.10 | ||||||
| Fresh tuna and white fish | 0.08 (0.05) | 0.08 | 0.15 (0.06) | 0.02 | 0.17 (0.08) | 0.05 | ||||||
| Freshwater fish | 0.50 (0.14) | 0.00 | ||||||||||
| Graham crackers | 0.21 (0.13) | 0.09 | −0.38 (0.20) | 0.07 | 0.42 (0.21) | 0.05 | ||||||
| Crackers (not including graham crackers) | −0.06 (0.02) | 0.01 | −0.05 (0.03) | 0.10 | ||||||||
| Microwave popcorn | 0.19 (0.11) | 0.09 | ||||||||||
| R-square | 0.51 | 0.28 | 0.33 | 0.20 | 0.41 | 0.24 | ||||||
Slope (SE): estimated regression coefficient (standard error).
The serum concentrations of PFCs were natural log-transformed.
The total sample size for the adult population is 149. The actual number of observations used is influenced by the predictors selected, which varied by compound.
Table 6.
Regression analysis of predicting natural log-transformed serum concentrations of PFCs for children in California, USA (2008–2009).
| Nb | PFOS
|
PFOA
|
PFNA
|
PFDA
|
PFHxS
|
Me-PFOSA-AcOH
|
||||||
|---|---|---|---|---|---|---|---|---|---|---|---|---|
| 52
|
58
|
53
|
63
|
62
|
59
|
|||||||
| Effect | Slope (SE) | p | Slope (SE) | p | Slope (SE) | p | Slope (SE) | p | Slope (SE) | p | Slope (SE) | p |
| Intercept | 1.31 (0.18) | <.01 | 1.18 (0.14) | <.01 | 0.07 (0.16) | 0.67 | −0.99 (0.15) | <.01 | −0.28 (0.25) | 0.28 | −1.79 (0.21) | <.01 |
| Child’s age (year) | 0.04 (0.04) | 0.27 | 0.09 (0.04) | 0.04 | ||||||||
| HVS3 dust concentration (ng/g) | 0.0001 (0.00006) | 0.05 | 0.0008 (0.0002) | <.01 | ||||||||
| Frequency of wearing waterproof clothes (time/week) | 0.01 (0.003) | <.01 | 0.01 (0.004) | 0.01 | ||||||||
| Frequency of having pre-packaged candy or bakery items (ref=never) | ||||||||||||
| <1 Time/week | −0.02 (0.24) | 0.94 | ||||||||||
| ≥1 Time/week | −0.41 (0.18) | 0.03 | ||||||||||
| Frequency of eating (time/week) | ||||||||||||
| Canned meat entrées | −0.31 (0.16) | 0.06 | ||||||||||
| Canned fish | 0.66 (0.22) | <.01 | ||||||||||
| Fresh tuna and white fish | 0.08 (0.06) | 0.19 | −0.15 (0.07) | 0.03 | ||||||||
| Hotdogs | 0.22 (0.08) | 0.01 | 0.39 (0.17) | 0.03 | ||||||||
| Nuggets | 0.11 (0.09) | 0.19 | ||||||||||
| French fries | −0.17 (0.08) | 0.05 | ||||||||||
| Crackers other than graham crackers | −0.03 (0.01) | 0.06 | ||||||||||
| Chips | 0.07 (0.03) | 0.01 | ||||||||||
| Microwave popcorn | 0.40 (0.22) | 0.08 | ||||||||||
| Breastfeeding (ref=none to 1.5 months) | ||||||||||||
| Breastfed for 3–6 months | −0.08 (0.20) | 0.71 | 0.08 (0.18) | 0.65 | 0.13 (0.32) | 0.69 | ||||||
| Breastfed for 6–12 months | 0.11 (0.15) | 0.47 | 0.23 (0.15) | 0.13 | 0.61 (0.27) | 0.03 | ||||||
| Breastfed for > 12 months | 0.36 (0.16) | 0.03 | 0.47 (0.16) | 0.01 | 0.63 (0.28) | 0.03 | ||||||
| R-square | 0.51 | 0.21 | 0.46 | 0.13 | 0.14 | 0.25 | ||||||
Slope (SE): estimated regression coefficient (standard error).
The serum concentrations of PFCs were natural log-transformed.
The total sample size for the child population is 68. The actual number of observations used is influenced by the predictors selected, which varied by compound.
For children, age is only positively associated with serum concentrations of PFNA, but not related to other PFCs. The dust concentration and the frequency of wearing waterproof clothes were positive predictors for PFOS and PFNA. Having been breastfed for a longer time period is significantly positively associated with PFOS, PFOA, and PFHxS serum concentrations, and positive associations with frequencies of food items varied by compound. The variance explained as indicated by the R-square values improved from 0.05–0.36 for the model with only food variables to 0.13–0.51 for the second stage model, indicating the influence of exposure through residential dust and wearing waterproof clothes.
3.4. Temporal variability of PFC serum concentrations
The serum correlations between the two concentrations measured one year apart from the same individual were highly correlated for most of the PFCs, especially for parents of young children, who had correlations of 0.83–0.98 between two measurements for the concentrations of different compounds. Temporal correlations for children were slightly lower but also significant (r=0.68–0.95).
The distributions of the percent of change in serum concentrations over a one-year interval for young children and their parents are presented in Fig. 1. Overall, serum concentrations decreased for most of the PFCs, and a greater decreasing trend was observed for young children than their parents. More than half of the young children (47–79% varied by compound) had a >15% decrease in serum concentrations. Compared to children, parents’ serum PFC concentrations were more consistent over time, with 31–64% of the participants having <15% change in serum concentrations from one year to the next. In particular, a significant decreasing trend was observed for PFOA, with 79% of the young children and 64% of the parents showing a >15% decrease in concentrations over the one year period.
Fig. 1.
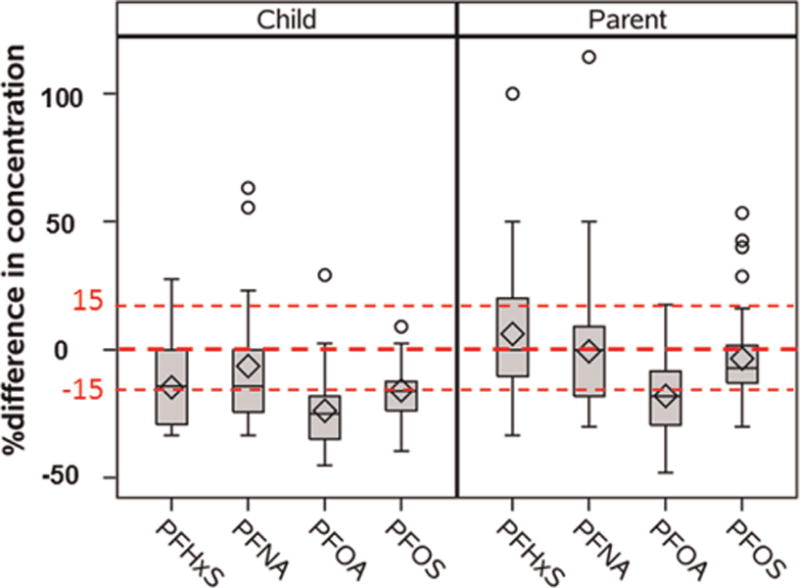
Percent of change of PFCs concentrations between year for young children (N=19) and parents of young children (N=39).
4. Discussion
This study updates the existing knowledge on human exposure levels to PFCs. In particular, it provides valuable data on young children exposure to PFCs, correlations between PFC serum concentrations of family members, and temporal trend of PFC serum levels, which have rarely been reported before. This study also provides new evidences on the contribution of food and consumer products to PFC exposure.
Compared with previous studies, we observe much lower serum concentrations of PFOS for all demographic groups, consistent with the decreasing trend over time observed in other studies resulting after the phase-out of this compound (Kato et al., 2011a; Vestergren and Cousins, 2009). The PFOA concentrations we observed for parents of young children were also lower than the NHANES 2007–2008 (GM=4.13 ng/ml) and American Red Cross blood donors’ concentrations in 2006 (GM=3.44 ng/ml) (Olsen et al., 2011), while our older adults’ concentrations were close to American Red Cross blood donors’ average. Further, we observed a significant decrease of PFOA serum concentrations over one year interval in our study. In contrast, there has been an increasing trend in PFNA concentrations since 2000. The geometric mean of PFNA concentrations for the older adults in our study was 0.97 ng/ml, consistent with the American Red Cross blood donors’ concentrations in 2006 (GM=0.97 ng/ml) and NHANES 2007–2008 (GM=1.49 ng/ml) (Olsen et al., 2011). Our PFHxS concentrations of older adults were similar to NHANES 2007–2008 (GM=1.96 ng/ml), but parents of young children were much lower. We note that the older adult participants were recruited in a different region from the households with young children. There is no known environmental source of contamination in either region.
Limited serum data of PFCs for young children in the United States are available. Based on measurements on children ages 2–12 years between 1994 and 1995, Olsen et al. (2004) reported the geometric mean concentrations of PFOS and PFHxS at 37.5 ng/ml and 4.5 ng/ml. The children in our study were mainly born after PFOS was phased out, and thus the concentrations we observed were 6 times and 3.4 times lower than those observed by Olsen et al. for PFOS and PFHxS respectively. For PFOA which continued to be used after 2002, our observed concentrations were similar to the concentration (4.9 ng/ml) reported by Olsen et al. Our concentrations were in the same range as those observed in Texas children in 2009 (Schecter et al., 2012). Gump et al. (2011) reported higher PFOS concentration but lower concentrations of PFOA, PFNA, and PFDA than our observations in a study in New York State.
Comparing the distribution of serum PFC concentration across the three demographic groups, we find that older adults had the highest levels for PFOS and PFHxS, and that children had the highest levels for all others, with parents always having the lowest levels. It is important to note that the majority of our parents were female, and they delivered one of their children between 2000 and 2005. It has been found that females generally have lower levels of PFCs than males (Kato et al., 2011a), and child birth and breastfeeding could further greatly reduce women’s body burden of PFCs (Brantsæter et al., 2013; Fei et al., 2007; Mondal et al., 2012). Having recently been pregnant, combined with the phase-out of PFOS in 2002 and recent reductions in PFOA means that their body burden would not be likely to return to the same level as before pregnancy for these two compounds. Children often have higher exposure levels than adults, particularly if one route of exposure is through dermal and non-dietary intake, or if exposure through breast milk contributes. This would explain why children had the highest levels for many of the compounds. Children had lower levels of PFOS than older adults, likely because children were not alive for the full use period of PFOS coupled with the relatively long half-life of this compound (4.8 years, Olsen et al., 2007). Children’s serum PFOS concentrations were found significantly associated with PFOS concentration in residential dust, indicating the contribution from indoor exposure and the durability of this chemical in the environment. There have been two studies which have measured the half-life in the body of PFHxS as compared to other PFCs, and while the actual value varied significantly between the studies, both found PFHxS to have the longest half-life (Olsen et al., 2007; Zhang et al., 2013). This could explain why children had lower levels than older adults. It was thought that family members, who share the same indoor environment and eat similar food, may have similar serum concentrations of PFCs. However, except for Me-PFOSA-AcOH we only found moderate correlation for other PFCs between young children and their parents. For all compounds, the geometric means of the children’s serum levels were higher than the parents. This is expected since children come in more contact with their environment and eat more food relative to their bodyweight. Also, there may be differences in the mechanism of excretion and accumulation of PFCs between household members.
Similar to findings that males across the population had higher levels than females (Calafat et al., 2007; Fromme et al., 2009; Ji et al., 2012; Kato et al., 2011a), we observed higher PFC concentrations among males than females within an older couple from the same family, though not statistically significant, providing additional data on sex-related differences in PFC concentrations.
Also, we reported temporal variation of serum concentrations of the same participants. The high correlation between the two measurements one year apart for children and parents of young children suggests that a single serum concentration might be a good indicator of the relative rank of PFC exposure among a population. We observed a general decreasing trend for many of the compounds, likely due to a reduction in exposure as these compounds are phased out. However, due to the relatively long half-life in the human body, reductions in serum levels are gradual, and thus the relative ranking of an individual remains relatively stable. The change of serum concentrations we observed results from the reduced external sources and subsequent decay of the internal dose. PFOA was undergoing significant reductions in production and use by the manufacturers during the time period of sample collection, resulting in the greatest decreases in serum concentrations compared to other PFCs we examined. The half-life of PFOA has been reported to be between 2.3 and 3.5 years (Brede et al., 2010; Olsen et al., 2007; Zhang et al., 2013), which would correspond to a drop in one year between 18% and 26% with removal of all sources, consistent with the observed decreases of 18% and 24% for adults and children. PFOS has a longer half-life and although no longer in commerce, remains in the environment and has a slightly smaller year-to-year decrease. PFHxS and PFNA are both still actively in commerce and have relatively longer biological half-lives and are relatively constant in adults (Zhang et al., 2013). There were decreases in these compounds for the children, likely due to the children growing and reduced exposure per unit body weight as they age.
Dietary intake has been confirmed as a major pathway of exposure to certain PFCs (Tittlemier et al., 2007; Trudel et al., 2008; Vestergren and Cousins, 2009). We observed that consumption of butter or margarine was significantly associated with PFNA and PFDA serum concentrations, probably because the packaging is usually oil-resistant and contains PFCs. Consumption of beef and pork was associated with PFOS and PFDA respectively, consistent with previous findings about red meat. Red meat, animal fats, fish, pizza, fast food, and snacks (e.g., popcorn, potato chips) were found associated with PFOS and/or PFOA body burden in previous work (Domingo, 2012; Halldorsson et al., 2008; Tittlemier et al., 2006). Our study also found that consumption of microwave popcorn was a significant predictor of serum concentration of PFOS. In addition, fish has been identified as a major contributor of PFOS and PFOA exposure especially among populations with high fish consumption (Clarke et al., 2010; Haug et al., 2010; Noorlander et al., 2011). However, our study participants had relatively low fish consumption rate, and significant associations were observed between freshwater fish and PFOS, between tuna and white fish and PFHxS and PFDA but not PFOS or PFOA.
It is also noted that many foods predict PFC serum concentrations of adults and children groups differently. For instance, pork, beef, butter/margarine, and freshwater fish were significantly associated with several serum PFCs for adults but not for any PFCs children. The reason might be due to the different diet of adults and children. Another example is microwave popcorn, which predicts PFOS concentrations among adults but predicts Me-PFOSA-AcOH among children. The reason for this difference remains unclear.
The PFC dust concentrations vary widely in a wide range worldwide, with the mean PFOS and PFOA concentrations (ng/g) ranging from 7 to 310 and 10 to 300, respectively (Ericson Jogsten et al., 2012; Goosey and Harrad, 2011; Haug et al., 2011; Shoeib et al., 2011). Our observations were comparable with two studies in North America, yet with lower PFOS levels. A study conducted in 39 Wisconsin homes in 2008 reported median residential dust concentrations of PFOS and PFOA at 47 ng/g and 44 ng/g (Knobeloch et al., 2012). Shoeib et al. (2011) reported median residential dust concentrations of PFOS and PFOA at 71 ng/g and 30 ng/g in Vancouver, Canada. Dust has been reported to be a significant contributor in some populations and in some countries (Haug et al., 2011; Shoeib et al., 2011). However, in U.S., dust has been estimated to be a minor source compared to food intake (Egeghy and Lorber, 2011; Vestergren et al., 2012), and our study results echo these findings in adults. Dust concentrations were, however, significant predictors for PFOS and PFNA serum concentrations of children, indicating that indoor exposures may be more important for children.
The results of this study are subject to several limitations. First, our study population has higher education levels than the general population, and the parents of the young children who participated in our study are predominantly females who had delivered a child recently. So far, there is limited information on the impact of education level as a marker of socioeconomic status on PFC exposure level. Therefore, caution needs to be taken when comparing our results with other studies. The correlations of serum concentrations between parent and child from the same family also need validation in further studies. Second, the sample sizes for the older couple group were small and replication in a larger cohort study would be useful. Third, even though we identified a number of significant predictors of serum concentrations of PFCs, these variables only explain a modest portion of the variance of serum PFC concentrations. One reason might be that the responses to use frequencies of consumer products and food intake frequencies were categorical and thus may not be able to quantify exposure precisely. For children, the R2 was lower likely because non-dietary ingestion plays a role.
5. Conclusions
The concentrations and the decreasing trend we observed in this study reflect the reduction of production and use of PFOS and PFOA in recent years. The temporal trend of PFC serum levels suggests single serum measurement could be an estimate of exposure relative to other members of the population for a longer time period in epidemiology studies. The correlations between PFC serum concentrations of family members are weak to moderate, indicating that there is some commonality of sources of exposure within a family. Finally, the variables we examined related to food intake frequency, consumer use, and occupational exposure, only explain a portion of the variation of PFC exposure. Further studies are required to identify more predictors.
Supplementary Material
Acknowledgments
We acknowledge the technical assistance of B. Basden, C. Dunbar and T. Jia (CDC, Atlanta, GA) for measuring the PFCs in serum. This study would not have been possible without the participants who patiently gave their time.
Funding sources: This research was funded by a Science to Achieve Results (STAR) grant #RD-83154001 from the U.S. Environmental Protection Agency (US EPA). Environmental sample analysis was conducted by the U.S. EPA’s Office of Research and Development’s National Exposure Research Laboratory, and blood sample analysis was conducted by the Centers for Disease Control and Prevention Laboratory (CDC). Data analysis was conducted with funding from Autism Speaks.
All recruitment and data collection protocols were approved by the institutional review boards at the University of California at Davis and the CDC, and informed consent for participation was obtained upon enrollment into the study.
Appendix A. Supplementary material
Supplementary data associated with this article can be found in the online version at http://dx.doi.org/10.1016/j.envres.2014.09.026.
Footnotes
Disclaimer
The manuscript has been subjected to the CDC and the U.S.EPA administrative review and approved for publication. The findings and conclusions in this manuscript are those of the authors and do not necessarily represent the official position of the CDC or the U.S.EPA.
Contributor Information
Deborah H. Bennett, Email: dhbennett@ucdavis.edu.
Antonia M. Calafat, Email: aic7@cdc.gov.
Kayoko Kato, Email: ktk2@cdc.gov.
Mark Strynar, Email: Strynar.Mark@epa.gov.
Erik Andersen, Email: andersen.erik@epa.gov.
Rebecca E. Moran, Email: rmoran@ucdavis.edu.
Daniel J. Tancredi, Email: djtancredi@ucdavis.edu.
Nicolle S. Tulve, Email: Tulve.Nicolle@epa.gov.
Irva Hertz-Picciotto, Email: ihp@ucdavis.edu.
References
- Alexander B, Olsen G, Burris J, Mandel J, Mandel J. Mortality of employees of a perfluorooctanesulphonyl fluoride manufacturing facility. Occup Environ Medi. 2003;60(10):722–729. doi: 10.1136/oem.60.10.722. [DOI] [PMC free article] [PubMed] [Google Scholar]
- Apelberg BJ, Goldman LR, Calafat AM, Herbstman JB, Kuklenyik Z, Heidler J, Needham LL, Rolf U, Witter FR. Determinants of fetal exposure to polyfluoroalkyl compounds in Baltimore, Maryland. Environ Sci Technol. 2007;41(11):3891–3897. doi: 10.1021/es0700911. [DOI] [PubMed] [Google Scholar]
- ASTM. Annual Book of ASTM Standards. Philidelphia, PA: 1994. [Google Scholar]
- Blake D, Howell RD, Criddle CS. Fluorinated organics in the biosphere. Environ Sci Technol. 1997;31:2445–2454. [Google Scholar]
- Brantsæter A, Whitworth K, Ydersbond T, Haug L, Haugen M, Knutsen H, Thomsen C, Meltzer H, Becher G, Sabaredzovic A. Determinants of plasma concentrations of perfluoroalkyl substances in pregnant Norwegian women. Environ Int. 2013;54:74–84. doi: 10.1016/j.envint.2012.12.014. [DOI] [PMC free article] [PubMed] [Google Scholar]
- Brede E, Wilhelm M, Göen T, Müller J, Rauchfuss K, Kraft M, et al. Two-year follow-up biomonitoring pilot study of residents’ and controls’ PFC plasma levels after PFOA reduction in public water system in Arnsberg, Germany. Int J Hyg Environ Health. 2010;213:217–223. doi: 10.1016/j.ijheh.2010.03.007. [DOI] [PubMed] [Google Scholar]
- Caudill S, Schleicher R, Pirkle J. Multi-rule quality control for the age-related eye disease study. Stat Med. 2008;27:4094–4106. doi: 10.1002/sim.3222. [DOI] [PubMed] [Google Scholar]
- CDC. Fourth National Reporton Human Exposureto Environmental Chemicals, Updated Tables. 2012 [Google Scholar]
- CEC. Efficiency Standards, California Code of Regulations, Title 24, Part 6, 2005, Building Efficiency Standards for Residential and Nonresidential Buildings. California Energy Commission; Sacromento, CA: 2005. [Google Scholar]
- Costa G, Sartori S, Consonni D. Thirty years of medical surveillance in perfluooctanoic acid production workers. J Occup Environ Medi. 2009;51(3):364–372. doi: 10.1097/JOM.0b013e3181965d80. [DOI] [PubMed] [Google Scholar]
- Calafat AM, Kuklenyik Z, Reidy JA, Caudill SP, Tully JS, Needham LL. Serum concentrations of 11 polyfluoroalkyl compounds in the US population: data from the National Health and Nutrition Examination Survey (NHANES) 1999–2000. Environ Sci Technol. 2007;41(7):2237–2242. doi: 10.1021/es062686m. [DOI] [PubMed] [Google Scholar]
- Clarke DB, Bailey V, Routledge A, Lloyd A, Hird S, Mortimer D, Gem M. Dietary intake estimate for perfluorooctanesulphonic acid (PFOS) and other perfluorocompounds (PFCs) in UK retail foods following determination using standard addition LC–MS/MS. Food Addit Contam. 2010;27(4):530–545. doi: 10.1080/19440040903476590. [DOI] [PubMed] [Google Scholar]
- Domingo JL. Health risks of dietary exposure to perfluorinated compounds. Environ Int. 2012;40:187–195. doi: 10.1016/j.envint.2011.08.001. [DOI] [PubMed] [Google Scholar]
- D’Hollander W, Roosens L, Covaci A, Cornelis C, Reynders H, Campenhout KV, Voogt Pd, Bervoets L. Brominated flame retardants and perfluorinated compounds in indoor dust from homes and offices in Flanders, Belgium. Chemosphere. 2010;81(4):478–487. doi: 10.1016/j.chemosphere.2010.07.043. [DOI] [PubMed] [Google Scholar]
- Egeghy PP, Lorber M. An assessment of the exposure of Americans to perfluorooctane sulfonate: a comparison of estimated intake with values inferred from NHANES data. J Expo Sci Environ Epidemiol. 2011;21:150–168. doi: 10.1038/jes.2009.73. [DOI] [PubMed] [Google Scholar]
- Emmett EA, Zhang H, Shofer FS, Freeman D, Rodway NV, Desai C, et al. Community exposure to perfluorooctanoate: relationships between serum levels and certain health parameters. J Occup Environ Med/Am Coll Occup Environ Med. 2006;48:771–779. doi: 10.1097/01.jom.0000233380.13087.37. [DOI] [PMC free article] [PubMed] [Google Scholar]
- Ericson Jogsten I, Nadal M, van Bavel B, Lindström G, Domingo JL. Per-and polyfluorinated compounds (PFCs) in house dust and indoor air in Catalonia, Spain: Implications for human exposure. Environ Int. 2012;39(1):172–180. doi: 10.1016/j.envint.2011.09.004. [DOI] [PubMed] [Google Scholar]
- Fairley KJ, Purdy R, Kearns S, Anderson SE, Meade B. Exposure to the immunosuppresant, perfluorooctanoic acid, enhances the murine IgE and airway hyperreactivity response to ovalbumin. Toxicol Sci. 2007;97(2):375–383. doi: 10.1093/toxsci/kfm053. [DOI] [PubMed] [Google Scholar]
- Fei C, McLaughlin JK, Tarone RE, Olsen J. Perfluorinated chemicals and fetal growth: a study within the Danish National Birth Cohort. Environ Health Persp. 2007;115(11):1677–1682. doi: 10.1289/ehp.10506. [DOI] [PMC free article] [PubMed] [Google Scholar]
- Fraser AJ, Webster TF, Watkins DJ, Nelson JW, Stapleton HM, Calafat AM, et al. Polyfluorinated compounds in serum linked to indoor air in office environments. Environ Sci Technol. 2011;46:1209–1215. doi: 10.1021/es2038257. [DOI] [PMC free article] [PubMed] [Google Scholar]
- Fromme H, Tittlemier SA, Volkel W, Wilhelm M, Twardella D. Perfluorinated compounds - Exposure assessment for the general population in western countries. Int J Hygiene Environ Health. 2009;212(3):239–270. doi: 10.1016/j.ijheh.2008.04.007. [DOI] [PubMed] [Google Scholar]
- Gilliland FD, Mandel JS. Mortality among employees of a perfluorooctanoic acid production plant. J Occup Medi: Offic Public Ind Medi Assoc. 1993;35(9):950. doi: 10.1097/00043764-199309000-00020. [DOI] [PubMed] [Google Scholar]
- Goosey E, Harrad S. Perfluoroalkyl compounds in dust from Asian, Australian, European, and North American homes and UK cars, classrooms, and offices. Environ Int. 2011;37(1):86–92. doi: 10.1016/j.envint.2010.08.001. [DOI] [PubMed] [Google Scholar]
- Grandjean P, Andersen EW, Budtz-Jørgensen E, Nielsen F, Mølbak K, Weihe P, Heilmann C. Serum vaccine antibody concentrations in children exposed to perfluorinated compounds. JAMA. 2012;307(4):391–397. doi: 10.1001/jama.2011.2034. [DOI] [PMC free article] [PubMed] [Google Scholar]
- Gump BB, Wu Q, Dumas AK, Kannan K. Perfluorochemical (PFC) exposure in children: associations with impaired response inhibiti. Environ Sci Technol. 2011;45:8151–8159. doi: 10.1021/es103712g. [DOI] [PMC free article] [PubMed] [Google Scholar]
- Halldorsson TI, Fei C, Olsen J, Lipworth L, Mclaughlin JK, Olsen SF. Dietary predictors of perfluorinated chemicals: a study from the Danish National Birth Cohort. Environ Sci Technol. 2008;42:8971–8977. doi: 10.1021/es801907r. [DOI] [PubMed] [Google Scholar]
- Haug LS, Thomsen C, Brantsæter AL, Kvalem HE, Haugen M, Becher G, Alexander J, Meltzer HM, Knutsen HK. Diet and particularly seafood are major sources of perfluorinated compounds in humans. Environ Int. 2010;36(7):772–778. doi: 10.1016/j.envint.2010.05.016. [DOI] [PubMed] [Google Scholar]
- Haug LS, Huber S, Schlabach M, Becher G, Thomsen C. Investigation on per-and polyfluorinated compounds in paired samples of house dust and indoor air from Norwegian homes. Environ Sci Technol. 2011;45:7991–7998. doi: 10.1021/es103456h. [DOI] [PubMed] [Google Scholar]
- Hertz-Picciotto I, Cassady D, Lee K, Bennett DH, Ritz B, Vogt R. Study of use of products and exposure-related behaviors (SUPERB): study design, methods, and preliminary results. Environ Health. 2010;9:54. doi: 10.1186/1476-069X-9-54. [DOI] [PMC free article] [PubMed] [Google Scholar]
- Hoffman K, Webster TF, Weinberg J, Vieira VM, Weisskopf MG. Exposure to polyfluoroalkyl chemicals and attention deficit/hyperactivity disorder in US children 12–15 years of age. Environ Health Perspect. 2010;118:1762–1767. doi: 10.1289/ehp.1001898. [DOI] [PMC free article] [PubMed] [Google Scholar]
- Inoue K, Okada F, Ito R, Kato S, Sasaki S, Nakajima S, Uno A, Saijo Y, Sata F, Yoshimura Y. Perfluorooctane sulfonate (PFOS) and related perfluorinated compounds in human maternal and cord blood samples: assessment of PFOS exposure in a susceptible population during pregnancy. Environ Health Perspect. 2004;112(11):1204. doi: 10.1289/ehp.6864. [DOI] [PMC free article] [PubMed] [Google Scholar]
- Jain RB. Contribution of diet and other factors to the levels of selected polyfluorinated compounds: data from NHANES 2003–2008. Int J Hyg Environ Health. 2014;217:52–61. doi: 10.1016/j.ijheh.2013.03.008. [DOI] [PubMed] [Google Scholar]
- Ji K, Kim S, Kho Y, Paek D, Sakong J, Ha J, et al. Serum concentrations of major perfluorinated compounds among the general population in Korea: dietary sources and potential impact on thyroid hormones. Environ Int. 2012;45:78–85. doi: 10.1016/j.envint.2012.03.007. [DOI] [PubMed] [Google Scholar]
- Joensen UN, Bossi R, Leffers H, Jensen AA, Skakkebak NE, Jorgensen N. Do perfluoroalkyl compounds impair human semen quality? Environ Health Perspect. 2009;117:923–927. doi: 10.1289/ehp.0800517. [DOI] [PMC free article] [PubMed] [Google Scholar]
- Kato K, Calafat AM, Wong LY, Wanigatunga AA, Caudill SP, Needham LL. Polyfluoroalkyl compounds in pooled sera from children participating in the National Health and Nutrition Examination Survey 2001–2002. Environ Sci Technol. 2009;43:2641–2647. doi: 10.1021/es803156p. [DOI] [PubMed] [Google Scholar]
- Kato K, Wong LY, Jia LT, Kuklenyik Z, Calafat AM. Trends in exposure to polyfluoroalkyl chemicals in the US population: 1999–2008. Environ Sci Technol. 2011a;45:8037–8045. doi: 10.1021/es1043613. [DOI] [PubMed] [Google Scholar]
- Kato K, Basden BJ, Needham LL, Calafat AM. Improved selectivity for the analysis of maternal serum and cord serum for polyfluoroalkyl chemicals. J Chromatogr A. 2011b;1218:2133–2137. doi: 10.1016/j.chroma.2010.10.051. [DOI] [PubMed] [Google Scholar]
- Kim SK, Lee KT, Kang CS, Tao L, Kannan K, Kim KR, Kim CK, Lee JS, Park PS, Yoo YW. Distribution of perfluorochemicals between sera and milk from the same mothers and implications for prenatal and postnatal exposures. Environ Pollut. 2011;159(1):169–174. doi: 10.1016/j.envpol.2010.09.008. [DOI] [PubMed] [Google Scholar]
- Knobeloch L, Imm P, Anderson H. Perfluoroalkyl chemicals in vacuum cleaner dust from 39 Wisconsin homes. Chemosphere. 2012;88:779–783. doi: 10.1016/j.chemosphere.2012.03.082. [DOI] [PubMed] [Google Scholar]
- Lau C, Anitole K, Hodes C, Lai D, Pfahles-Hutchens A, Seed J. Perfluoroalkyl acids: a review of monitoring and toxicological findings. Toxicol Sci. 2007;99:366–394. doi: 10.1093/toxsci/kfm128. [DOI] [PubMed] [Google Scholar]
- Lindstrom AB, Strynar MJ, Libelo EL. Polyfluorinated compounds: past, present, and future. Environ Sci Technol. 2011;45:7954–7961. doi: 10.1021/es2011622. [DOI] [PubMed] [Google Scholar]
- Melzer D, Rice N, Depledge MH, Henley WE, Galloway TS. Association between serum perfluorooctanoic acid (PFOA) and thyroid disease in the US National Health and Nutrition Examination Survey. Environ Health Perspect. 2010;118:686–692. doi: 10.1289/ehp.0901584. [DOI] [PMC free article] [PubMed] [Google Scholar]
- Mondal D, Lopez-Espinosa MJ, Armstrong B, Stein CR, Fletcher T. Relationships of perfluorooctanoate and perfluorooctane sulfonate serum concentrations between mother–child pairs in a population with perfluorooctanoate exposure from drinking water. Environ Health Perspect. 2012;120:752–757. doi: 10.1289/ehp.1104538. [DOI] [PMC free article] [PubMed] [Google Scholar]
- Noorlander CW, van Leeuwen SP, te Biesebeek JD, Mengelers MJ, Zeilmaker MJ. Levels of perfluorinated compounds in food and dietary intake of PFOS and PFOA in the Netherlands. J Agric Food Chem. 2011;59(13):7496–7505. doi: 10.1021/jf104943p. [DOI] [PubMed] [Google Scholar]
- Olsen GW, Burris JM, Ehresman DJ, Froehlich JW, Seacat AM, Butenhoff JL, et al. Half-life of serum elimination of perfluorooctanesulfonate, perfluorohexanesulfonate, and perfluorooctanoate in retired fluorochemical production workers. Environ Health Perspect. 2007;115:1298. doi: 10.1289/ehp.10009. [DOI] [PMC free article] [PubMed] [Google Scholar]
- Olsen GW, Butenhoff JL, Zobel LR. Perfluoroalkyl chemicals and human fetal development: an epidemiologic review with clinical and toxicological perspectives. Reprod Toxicol. 2009;27:212–230. doi: 10.1016/j.reprotox.2009.02.001. [DOI] [PubMed] [Google Scholar]
- Olsen GW, Church TR, Hansen KJ, Burris JM, Butenhoff JL, Mandel JH, et al. Quantitative evaluation of perfluorooctanesulfonate (PFOS) and other fluorochemicals in the serum of children. J Child’s Health. 2004;2:53–76. [Google Scholar]
- Olsen GW, Ellefson ME, Mair DC, Church TR, Goldberg CL, Herron RM, et al. Analysis of a homologous series of perfluorocarboxylates from American Red Cross adult blood donors, 2000–2001 and 2006. Environ Sci Technol. 2011;45:8022–8029. doi: 10.1021/es1043535. [DOI] [PubMed] [Google Scholar]
- Reiner JL, Blaine AC, Higgins CP, Huset C, Jenkins TM, Kwadijk CJ, et al. Polyfluorinated substances in abiotic standard reference materials. Anal Bioanal Chem. 2013:1–9. doi: 10.1007/s00216-013-7330-2. [DOI] [PubMed] [Google Scholar]
- Renner R. Growing concern over perfluorinated chemicals. Environ Sci Technol. 2001;35:154–160. doi: 10.1021/es012317k. [DOI] [PubMed] [Google Scholar]
- Sakr CJ, Kreckmann KH, Green JW, Gillies PJ, Reynolds JL, Leonard RC. Cross-sectional study of lipids and liver enzymes related to a serum biomarker of exposure (ammonium perfluorooctanoate or APFO) as part of a general health survey in a cohort of occupationally exposed workers. J Occup Environ Medi. 2007;49(10):1086–1096. doi: 10.1097/JOM.0b013e318156eca3. [DOI] [PubMed] [Google Scholar]
- Schecter A, Colacino J, Haffner D, Patel K, Opel M, Päpke O, et al. Perfluorinated compounds, polychlorinated biphenyls, and organochlorine pesticide contamination in composite food samples from Dallas, Texas, USA. Environ Health Perspect. 2010;118:796–802. doi: 10.1289/ehp.0901347. [DOI] [PMC free article] [PubMed] [Google Scholar]
- Schecter A, Malik-Bass N, Calafat AM, Kato K, Colacino JA, Gent TL, et al. Polyfluoroalkyl compounds in Texas children from birth through 12 years of age. Environ Health Perspect. 2012;120:590–594. doi: 10.1289/ehp.1104325. [DOI] [PMC free article] [PubMed] [Google Scholar]
- Seacat AM, Thomford PJ, Hansen KJ, Olsen GW, Case MT, Butenhoff JL. Subchronic toxicity studies on perfluorooctanesulfonate potassium salt in cynomolgus monkeys. Toxicol Sci. 2002;68:249–264. doi: 10.1093/toxsci/68.1.249. [DOI] [PubMed] [Google Scholar]
- Shoeib M, Harner TM, Webster G, Lee SC. Indoor sources of poly-and perfluorinated compounds (PFCS) in Vancouver, Canada: implications for human exposure. Environ Sci Technol. 2011;45:7999–8005. doi: 10.1021/es103562v. [DOI] [PubMed] [Google Scholar]
- Steenland K, Tinker S, Shankar A, Ducatman A. Association of perfluorooctanoic acid (PFOA) and perfluorooctane sulfonate (PFOS) with uric acid among adults with elevated community exposure to PFOA. Environ Health Perspect. 2010;118(2):229–233. doi: 10.1289/ehp.0900940. [DOI] [PMC free article] [PubMed] [Google Scholar]
- Strynar MJ, Lindstrom AB. Perfluorinated compounds in house dust from Ohio and North Carolina, USA. Environ Sci Technol. 2008;42:3751–3756. doi: 10.1021/es7032058. [DOI] [PubMed] [Google Scholar]
- Tittlemier SA, Pepper K, Edwards L. Concentrations of perfluorooctanesulfonamides in Canadian total diet study composite food samples collected between 1992 and 2004. J Agric Food Chem. 2006;54(21):8385–8389. doi: 10.1021/jf061713p. [DOI] [PubMed] [Google Scholar]
- Tittlemier SA, Pepper K, Seymour C, Moisey J, Bronson R, Cao XL, Dabeka RW. Dietary exposure of Canadians to perfluorinated carboxylates and perfluorooctane sulfonate via consumption of meat, fish, fast foods, and food items prepared in their packaging. J Agric Food Chem. 2007;55(8):3203–3210. doi: 10.1021/jf0634045. [DOI] [PubMed] [Google Scholar]
- Trudel D, Horowitz L, Wormuth M, Scheringer M, Cousins IT, Hungerbuhler K. Estimating consumer exposure to PFOS and PFOA. Risk Anal. 2008;28(2):251–269. doi: 10.1111/j.1539-6924.2008.01017.x. [DOI] [PubMed] [Google Scholar]
- Vestergren R, Berger U, Glynn A, Cousins IT. Dietary exposure to perfluoroalkyl acids for the Swedish population in 1999, 2005 and 2010. Environ Int. 2012;49:120–127. doi: 10.1016/j.envint.2012.08.016. [DOI] [PubMed] [Google Scholar]
- Vestergren R, Cousins IT. Tracking the pathways of human exposure to perfluorocarboxylates. Environ Sci Technol. 2009;43:5565–5575. doi: 10.1021/es900228k. [DOI] [PubMed] [Google Scholar]
- Yang Q, Xie Y, Alexson SEH, Dean Nelson B, DePierre JW. Involvement of the peroxisome proliferator-activated receptor alpha in the immunomodulation caused by peroxisome proliferators in mice. Biochemical pharmacology. 2002;63(10):1893–1900. doi: 10.1016/s0006-2952(02)00923-1. [DOI] [PubMed] [Google Scholar]
- Zhang T, Sun H, Lin Y, Wang L, Zhang X, Liu Y, et al. Perfluorinated compounds in human blood, water, edible freshwater fish, and seafood in China: daily intake and regional differences in human exposures. J Agric Food Chem. 2011;59:11168–11176. doi: 10.1021/jf2007216. [DOI] [PubMed] [Google Scholar]
- Zhang Y, Beesoon S, Zhu L, Martin J. Biomonitoring of perfluoroalkyl acids in human urine and estimates of biological half-life. Environ Sci Technol. 2013;47:10619–10627. doi: 10.1021/es401905e. [DOI] [PubMed] [Google Scholar]
Associated Data
This section collects any data citations, data availability statements, or supplementary materials included in this article.