

Abstract
Background
Racial/ethnic and socioeconomic disparities persist in part because our understanding of the care provided to minority and disadvantaged populations is limited. We evaluated the quality of breast cancer care in two large states to understand the disparities experienced by African-American, Hispanic, Asian/Pacific Islander (API), and Medicaid-enrollees and to prioritize remediation strategies.
Methods
Statewide cancer registry data for 80,436 NY and 121,233 CA women diagnosed 2004-2009 with stage 0-III breast cancer were used to assess underuse and overuse of surgery, radiation, chemotherapy, and hormone therapy based on 34 quality measures. Concordance values were compared across racial/ethnic and Medicaid-enrollment groups. Multivariable models quantified disparities across groups for each treatment in each state.
Results
Overall concordance was 76% for underuse and 87% for overuse measures. The proportions of patients who received care concordant with all relevant measures were 35% in NY and 33% in CA. Compared to whites, African-Americans were less likely to receive recommended surgery, radiation, and hormone therapy; Hispanics and APIs were usually more likely to receive recommended chemotherapy. Across states, the same racial/ethnic groups did not always experience the same disparities. Medicaid enrollment was associated with decreased likelihood of receiving all recommended treatments, except chemotherapy, in both states. Overuse was evident for hormone therapy and axillary surgery, but was not associated with race/ethnicity or Medicaid enrollment.
Conclusions
Patient-level measures of quality identify substantial problems with care quality and meaningful disparities. Remediating these problems will require prioritizing low-performing measures and targeting high-risk populations, possibly in different ways for different regions.
Keywords: Breast cancer, quality, disparities, Medicaid
Background
A number of studies have identified problems with the quality of breast cancer care in the United States (US).1-4 Still more have suggested that these quality problems disproportionally affect minority racial/ethnic and economically disadvantaged groups.5-8 For example, African-American women are more likely to be diagnosed at a later stage and to experience early breast cancer mortality compared to white women. These disparities have been attributed to lower rates of screening, differences in tumor biology, and underuse of recommended therapies.9-14 Considering that tens of thousands of racial/ethnic minority and economically disadvantaged women are diagnosed with breast cancer each year, figuring out how to address these disparities is a high priority for our health care system.
Unfortunately, there remains much that we do not know about breast cancer disparities. Since most studies have focused on the experiences of African-Americans, we know relatively little about the experiences of other racial/ethnic groups, such as Hispanics and Asian/ Pacific Islanders (API). Few studies have evaluated the interplay between racial/ethnicity, socioeconomic status (SES), and geography. Perhaps all minority/disadvantaged populations experience the same quality problems; alternatively, the type or magnitude of quality problems could vary from group to group. Without fully understanding the pattern and magnitude of disparities experienced by these groups it is hard to determine whether improvement efforts should target high-risk patients, specific treatments, or some combination of factors.
The limitations of existing quality improvement programs are evidenced by the observation that over the past two decades breast cancer mortality among whites has declined dramatically, whereas among African Americans it has remained roughly constant.15 A growing disparity has developed despite the creation and implementation of many breast cancer quality measures.16 Past decisions regarding which quality measures should be the focus of improvement efforts have often been based on expert opinion and feasibility. Using actual practice performance data to identify which patient subgroups and treatments should be the focus of improvement efforts could help direct resources to those aspects of care that offer the greatest potential to reduce disparities.17
Previously, we developed a set of quality measures to evaluate the appropriate use of recommended treatments and the inappropriate use of unnecessary treatments for women with newly diagnosed, non-metastatic breast cancer.17 Using the Surveillance Epidemiology and End Results (SEER)/Medicare linked dataset, we identified significant gaps in quality.18 However, these analyses included only a small proportion of non-white and economically disadvantaged women, and all patients were >65 years old. Recently, the Departments of Health from New York (NY) and California (CA), in collaboration with Schrag and colleges19, merged their state tumor registry files with Medicaid and Medicare data to create a novel linked dataset. NY and CA are populous states with substantial numbers of non-white individuals; they maintain robust Medicaid programs that ensure access to health insurance for large numbers of economically disadvantaged patients; and they support high-quality tumor registries. This provided an ideal opportunity to assess care quality for large numbers of patients belonging to traditionally under-represented groups.
Our primary goals were to use statewide cancer registry data to describe the nature and extent of the quality problems experienced by different groups (i.e., Hispanics, APIs, and the economically disadvantaged) of women with newly diagnosed, non-metastatic breast cancer; to determine if the same quality problems affect all minority/disadvantaged populations or if substantial differences in the magnitude or type of quality problems exist; and to identify which patient/disease/treatment characteristics are best able to identify high-priority targets for quality improvement efforts that will address disparities.
Methods
The data for this analysis came from the state cancer registries of NY and CA.19 Registry files provided patient characteristics, cancer diagnoses, and treatments for adult women diagnosed 2004-9 with stage 0-III breast cancer. Patients were excluded if they developed another primary cancer ≤12 months after or died ≤6 months after their incident breast cancer diagnosis; or if cancer stage or race/ethnicity were unknown. Race/ethnicity was categorized as white, African-American, API, Hispanic, or other. The population size of the county of residence at diagnosis was used to categorize urbanicity as very large metropolitan (>500,000), suburban and large urban (300,000-500,000), urban (100,000-300,000), or rural (<100,000). Census tract data were used to derive median household income and percent with less than a high school diploma, categorized into quintiles using CA data. Treatment variables included breast surgery type, lymph node surgery, chemotherapy, radiation therapy, and hormone therapy.
Using administrative data from state and federal insurance programs, which had previously been merged with cancer registry files19, we identified patients enrolled in Medicaid within 6 months of their breast cancer diagnosis. Our cohort included patients with all types of health care coverage and the uninsured, but enrollment data were only available for Medicaid and Medicare. Analyses were stratified by state to account for potential differences in the Medicaid programs, and by age at diagnosis (≤64 or ≥65) to account for Medicare eligibility. Quality of care was evaluated using 34 measures developed from evidence- and consensus-based clinical practice guidelines promulgated by the National Comprehensive Cancer Network (NCCN).17 These measures evaluated recommendations, in place at the time of diagnosis, pertaining to each component of initial breast cancer treatment: breast surgery, lymph node surgery, chemotherapy, radiation therapy, and hormonal therapy (see Supplemental Table). Twenty-four measures evaluated recommendations for proven therapies (underuse); ten evaluated recommendations against unnecessary therapies (overuse). Underuse and overuse measures were identified for all treatment modalities, except breast surgery, where measures only evaluated underuse.
Registry data were used to assign patients to measures and to determine whether or not recommended care was delivered. Billing claims were not used to supplement registry data, because they were not available for all patients and our goal was to assess quality for the entire population. Historically, concerns about the completeness and accuracy of registry data led to caution when using these data to assess care quality, but more recent studies have demonstrated improvements in registry data20-24 and investigators are now using them to measure quality.25, 26 Still, we excluded measures that could not be ascertained from registry data (e.g., use of tumor markers or imaging studies). A concordance value was derived for each measure using the overall percentage method27, where concordance equals the number of patients who receive recommended care divided by the number eligible for each measure. For measures that recommend treatment, higher concordance meant more patients received therapy; whereas for measure that recommend against treatment, higher concordance meant more patients did not receive therapy.
Using all 34 quality measures, concordance values were derived for patient subgroups based on race/ethnicity and Medicaid status, as well as age, marital status and other attributes. Among patients who were eligible for at least one measure, those who received fully concordant care (i.e., all pertinent measures were concordant) were compared with those who did not using the Chi-square test. Overall concordance values were calculated for each county based on the patient's residence at diagnosis.
Measures were grouped into nine sets based on treatment modality and whether they represented overuse or underuse. Overall concordance was calculated for each set using all of the measures in that set. While a patient could be eligible for more than one measure in the overall analysis, she could only be represented once in each measure-set. To determine whether the type or magnitude of quality problem varied by race/ethnicity or Medicaid-enrollment status, we derived separate concordance values for each racial/ethnic group and for Medicaid vs. non-Medicaid patients. Correlations and R2 values were used to compare patterns of concordance for whites versus African-Americans, Hispanics, and APIs; and for Medicaid versus non-Medicaid patients.28
Multivariable logistic regression models were fit to assess the relative importance of race/ethnicity and Medicaid-enrollment on concordance after controlling for other covariates.28 Separate models were created for each measure-set, because we anticipated that factors associated with concordance could differ between sets. The following covariates were included in all models: race/ethnicity, Medicaid enrollment status, age, marital status, urbanicity, median income, education, treatment type, and recommendation type (overuse/underuse). Model outputs included the adjusted odds of concordance for blacks vs. whites, Hispanics vs. whites, APIs vs. whites; and Medicaid vs. non-Medicaid patients. Parameter estimates were reported with 95% confidence intervals (CI). Analyses were conducted using SAS version 9.2 (SAS Institute Inc, Cary, NC). The Institutional Review Board at Dana-Farber Cancer Institute provided oversight for this project.
Results
We identified 80,436 women with stage 0-III breast cancer in NY and 121,233 in CA (Table 1). Each state contributed sizeable numbers of African-American, Hispanic, and API patients. In NY, the largest non-white racial/ethnic group was African-Americans (13%), and in CA it was Hispanics (15%). Within 6 months of diagnosis, 14% of the NY cohort and 11% of the CA cohort were enrolled in Medicaid. Patients resided in predominantly non-rural areas. The distribution of cancer characteristics (stage, hormone-receptor status and grade) was relatively similar across the two states. Most patients had breast conserving surgery (64% in NY; 61% in CA); many received radiation therapy (50% in NY; 48% in CA).
Table 1. Patient and Tumor Characteristics for All New York and California Breast Cancer Patients and Those Who Received Care Concordant with All Applicable Quality Measures*.
| New York | California | |||||||||
|---|---|---|---|---|---|---|---|---|---|---|
| All Patients | Concordant Patients | Proportion Concordant (Row %) | All Patients | Concordant Patients | Proportion Concordant (Row %) | |||||
| No. | Column % | No. | Column % | No. | Column % | No. | Column % | |||
| Total Patients | 80436 | 100 | 27851 | 100 | 35 | 121233 | 100 | 40232 | 100 | 33 |
|
| ||||||||||
| Age | ||||||||||
|
| ||||||||||
| ≤44 | 11366 | 14 | 4628 | 17 | 41 | 15682 | 13 | 6392 | 16 | 41 |
| 45-54 | 21191 | 26 | 8221 | 29 | 39 | 31259 | 26 | 11811 | 29 | 38 |
| 55-64 | 19704 | 25 | 7357 | 26 | 37 | 31419 | 26 | 11044 | 28 | 35 |
| 65-74 | 15140 | 19 | 4933 | 18 | 33 | 23616 | 19 | 7219 | 18 | 31 |
| 75+ | 13035 | 16 | 2712 | 10 | 21 | 19257 | 16 | 3766 | 9 | 20 |
|
| ||||||||||
| Race / Ethnicity# | ||||||||||
|
| ||||||||||
| White | 59794 | 74 | 20680 | 74 | 35 | 80599 | 67 | 26128 | 65 | 32 |
| African-American | 10860 | 13 | 3623 | 13 | 33 | 7630 | 6 | 2416 | 6 | 32 |
| Hispanic | 6066 | 8 | 2121 | 8 | 35 | 18094 | 15 | 6029 | 15 | 33 |
| Asian/Pacific Isl. | 3716 | 5 | 1427 | 5 | 38 | 14910 | 12 | 5659 | 14 | 38 |
|
| ||||||||||
| Marital Status | ||||||||||
|
| ||||||||||
| Not married | 35191 | 44 | 10926 | 39 | 31 | 48248 | 40 | 14426 | 36 | 30 |
| Married | 43094 | 53 | 16332 | 59 | 38 | 70631 | 58 | 25215 | 63 | 36 |
| Unknown | 2151 | 3 | 593 | 2 | 28 | 2354 | 2 | 591 | 1 | 25 |
|
| ||||||||||
| Median Income ($US, Quintiles)† | ||||||||||
|
| ||||||||||
| 1st (<38,000) | 11786 | 15 | 3854 | 14 | 33 | 24253 | 20 | 7493 | 19 | 31 |
| 2nd (38,000-51,000) | 14736 | 18 | 5013 | 18 | 34 | 24248 | 20 | 7807 | 19 | 32 |
| 3rd (51,000-64,000) | 15267 | 19 | 5269 | 19 | 35 | 24247 | 20 | 8017 | 20 | 33 |
| 4th (64,000-85,000) | 16915 | 21 | 6041 | 22 | 36 | 24236 | 20 | 8311 | 21 | 34 |
| 5th (85,000-250,000) | 21193 | 26 | 7475 | 27 | 35 | 24249 | 20 | 8604 | 21 | 35 |
| Unknown | 539 | 1 | 199 | 1 | 37 | |||||
|
| ||||||||||
| Educated ≤ High School (%, Quintiles)† | ||||||||||
|
| ||||||||||
| 1st (<34%) | 27342 | 34 | 9626 | 35 | 35 | 24245 | 20 | 7640 | 19 | 32 |
| 2nd (34%-47%) | 22646 | 28 | 7983 | 29 | 35 | 24249 | 20 | 7935 | 20 | 33 |
| 3rd (47%-59%) | 18574 | 23 | 6348 | 23 | 34 | 24241 | 20 | 7973 | 20 | 33 |
| 4th (59%-74%) | 9907 | 12 | 3225 | 12 | 33 | 24249 | 20 | 8184 | 20 | 34 |
| 5th (74%-100%) | 1462 | 2 | 480 | 2 | 33 | 24249 | 20 | 8500 | 21 | 35 |
| Unknown | 505 | 1 | 189 | 1 | 37 | |||||
|
| ||||||||||
| Insurance Coverage | ||||||||||
|
| ||||||||||
| Medicaid | 11294 | 14 | 3402 | 12 | 30 | 13278 | 11 | 3843 | 10 | 29 |
| No Medicaid | 69142 | 86 | 24449 | 88 | 35 | 107955 | 89 | 36389 | 90 | 34 |
|
| ||||||||||
| Urbanicity of Residence | ||||||||||
|
| ||||||||||
| Very Large Metro | 29287 | 36 | 9366 | 34 | 32 | 50198 | 41 | 15693 | 39 | 31 |
| Suburb & Large Urban | 20994 | 26 | 7462 | 27 | 36 | 37221 | 31 | 12851 | 32 | 35 |
| Urban | 15150 | 19 | 5733 | 20 | 38 | 19937 | 16 | 6949 | 17 | 35 |
| Not Urban, Rural, Unknown | 15005 | 19 | 5290 | 19 | 35 | 13877 | 12 | 4739 | 12 | 34 |
|
| ||||||||||
| Year of Diagnosis | ||||||||||
|
| ||||||||||
| 2004 | 12538 | 16 | 4289 | 16 | 34 | 19257 | 16 | 6838 | 17 | 36 |
| 2005 | 12733 | 16 | 4218 | 15 | 33 | 19867 | 17 | 6759 | 17 | 34 |
| 2006 | 13371 | 17 | 4394 | 16 | 33 | 19622 | 16 | 6697 | 17 | 34 |
| 2007 | 13669 | 17 | 4547 | 16 | 33 | 20327 | 17 | 6961 | 17 | 34 |
| 2008 | 14047 | 17 | 5371 | 19 | 38 | 21092 | 17 | 6678 | 16 | 32 |
| 2009 | 14078 | 17 | 5032 | 18 | 36 | 21068 | 17 | 6299 | 16 | 30 |
|
| ||||||||||
| Tumor sizeˆ | ||||||||||
|
| ||||||||||
| T0 | 10625 | 13 | 4432 | 16 | 42 | 6161 | 5 | 2741 | 7 | 44 |
| T1a-b | 23320 | 29 | 10011 | 36 | 43 | 33698 | 28 | 13969 | 35 | 41 |
| T1c | 23828 | 30 | 6823 | 24 | 29 | 39909 | 33 | 10857 | 27 | 27 |
| T2 | 18134 | 23 | 5554 | 20 | 31 | 33721 | 28 | 10802 | 27 | 32 |
| T3-T4 | 4099 | 5 | 837 | 3 | 20 | 7467 | 6 | 1836 | 4 | 25 |
| Tx | 430 | <1 | 194 | 1 | 45 | 277 | <1 | 27 | <1 | 10 |
|
| ||||||||||
| Nodal statusˆ | ||||||||||
|
| ||||||||||
| N0 | 61647 | 77 | 22720 | 82 | 37 | 89755 | 74 | 32235 | 80 | 36 |
| N1 | 12877 | 16 | 5019 | 18 | 39 | 21405 | 18 | 7824 | 20 | 37 |
| N2-N3 | 5851 | 7 | 111 | <1 | 2 | 9895 | 8 | 163 | <1 | 2 |
| Nx | 61 | 0 | 1 | <1 | -- | 178 | <1 | 10 | <1 | 6 |
|
| ||||||||||
| Stageˆ | ||||||||||
| 0 | 20207 | 25 | 9684 | 35 | 48 | 24287 | 20 | 13089 | 32 | 54 |
| I | 31298 | 39 | 10141 | 36 | 32 | 47572 | 39 | 13897 | 35 | 29 |
| II | 21077 | 26 | 7583 | 27 | 36 | 36243 | 30 | 12487 | 31 | 34 |
| III | 7854 | 10 | 443 | 2 | 6 | 13131 | 11 | 759 | 2 | 6 |
|
| ||||||||||
| Hormone receptor status | ||||||||||
|
| ||||||||||
| ER &/or PR positive | 53495 | 66 | 16078 | 58 | 30 | 87904 | 72 | 24231 | 60 | 28 |
| ER & PR negative | 12035 | 15 | 5791 | 21 | 48 | 20041 | 17 | 9841 | 25 | 49 |
| Unknown or missing | 14906 | 19 | 5982 | 21 | 40 | 13288 | 11 | 6160 | 15 | 46 |
|
| ||||||||||
| Grade / Differentiation | ||||||||||
|
| ||||||||||
| Well/Moderate (1-2) | 41809 | 52 | 12954 | 47 | 31 | 71446 | 59 | 20147 | 50 | 28 |
| Poor (3) | 26422 | 33 | 11209 | 40 | 42 | 40830 | 34 | 17135 | 43 | 42 |
| Other/unknown | 12205 | 15 | 3688 | 13 | 30 | 8957 | 7 | 2950 | 7 | 33 |
|
| ||||||||||
| Histology | ||||||||||
|
| ||||||||||
| Ductal and/or lobular | 77835 | 97 | 26093 | 94 | 34 | 117533 | 97 | 37640 | 94 | 32 |
| Other | 2267 | 3 | 1461 | 5 | 64 | 3133 | 3 | 2077 | 5 | 66 |
| Unknown | 334 | 0 | 297 | 1 | 89 | 567 | <1 | 515 | 1 | 91 |
|
| ||||||||||
| Definitive Surgery | ||||||||||
|
| ||||||||||
| Breast conserving | 51637 | 64 | 16808 | 60 | 33 | 74238 | 61 | 22561 | 56 | 30 |
| Mastectomy | 26055 | 32 | 11043 | 40 | 42 | 44309 | 37 | 17671 | 44 | 40 |
| None | 1941 | 3 | 0 | 0 | --@ | 2617 | 2 | 0 | 0 | --@ |
| Unknown | 803 | 1 | 0 | 0 | --@ | 69 | <1 | 0 | 0 | --@ |
|
| ||||||||||
| Radiation Therapy | ||||||||||
|
| ||||||||||
| Yes | 40479 | 50 | 17771 | 64 | 44 | 58063 | 48 | 23938 | 60 | 41 |
| No | 38907 | 49 | 10056 | 36 | 26 | 63157 | 52 | 16292 | 40 | 26 |
| Unknown | 1050 | 1 | 24 | <1 | 2 | 13 | <1 | 2 | <1 | --@ |
|
| ||||||||||
| Lymph Node Sampling | ||||||||||
|
| ||||||||||
| Yes | 60312 | 75 | 20989 | 75 | 35 | 98714 | 82 | 31139 | 77 | 32 |
| No | 19430 | 24 | 6854 | 25 | 35 | 22414 | 18 | 9086 | 23 | 41 |
| Unknown | 694 | 1 | 8 | <1 | --@ | 105 | <1 | 7 | <1 | --@ |
A patient was considered to have received concordant care if she received care that was consistent with each quality measure applicable to her tumor type. Each patient could be eligible for 1 or more measure. For example, a patient with stage III, ER positive cancer could be eligible for more measures than a patient with stage 0, ER negative cancer. For each patient subgroup in both NY and in CA, the comparison of total patients with concordant patients was statistically significantly different (P<.0001).
Patients who reported Hispanic ethnicity were categorized as Hispanic regardless of their reported race
Derived from census tract-level data as compiled by the tumor registries of NY and CA.
Staging according to American Joint Committee on Cancer, version 6.
Proportions for cells with sample sizes <10 are not presented due to the small numbers.
Only 35% of NY and 33% of CA patients received fully concordant care (Table 1). Those who did were more likely to be young, married, and to live outside very large metropolitan areas. Women enrolled in Medicaid were less likely to receive fully concordant care than those not enrolled in Medicaid (30% vs. 35% in NY [P<.0001]; 29% vs. 34% in CA [P<.0001]). The proportion of patients who received concordant care was ≥3% higher for APIs than for all other racial/ethnic groups in both states. County-by-county analyses identified geographic variation in both states (Supplemental Figure).
Concordance values for the nine measure-sets demonstrated similar performance patterns in NY and CA (Spearman correlation 0.99), whether <65 or ≥65 years old at diagnosis (Table 2). Breast and lymph node surgery were almost always performed as recommended (>92%). Among patients for whom lymph node surgery was not recommended (i.e., those with ductal carcinoma in situ treated with lumpectomy), 16%-19% had it anyway. There was underuse of chemotherapy (51%-53% concordance), but little overuse (96% concordance). Chemotherapy concordance was lowest for HR-positive, node-negative and highest for HR-negative, node-positive breast cancer (supplemental table). Underuse of radiation occurred to a similar extent after breast conserving surgery and mastectomy. Low hormone therapy concordance may have been partly attributable to incomplete cancer registry data capture, but a separate analysis of Medicaid-enrollees showed that even after registry data were supplemented with insurance claims, hormone therapy use increased <6% and significant underuse persisted.29
Table 2. Concordance with Quality Measures Assessing Breast Cancer Treatment Underuse and Overuse Based on Tumor Registry Data from New York and California*.
| New York Women with Breast Cancer (2004-9) | California Women with Breast Cancer (2004-9) | ||||
|---|---|---|---|---|---|
| Treatment Modality | Type of Recommendation | Eligible (#) | Concordance (%) | Eligible (#) | Concordance (%) |
| ALL PATIENTS | |||||
|
| |||||
| Breast surgery | Recommend for | 80422 | 96.6 | 121216 | 97.8 |
|
| |||||
| Lymph node surgery | Recommend for | 50346 | 92.7 | 82986 | 95.2 |
| Recommend against | 14942 | 83.9 | 17457 | 80.9 | |
|
| |||||
| Chemotherapy | Recommend for | 40416 | 53.4 | 70674 | 51.4 |
| Recommend against | 33208 | 96.3 | 43314 | 96.5 | |
|
| |||||
| Radiation therapy | Recommend for | 54891 | 65.7 | 81827 | 64.7 |
| Recommend against | 14604 | 93.3 | 24797 | 94.5 | |
|
| |||||
| Hormone therapy | Recommend for | 30623 | 47.1 | 55478 | 48.9 |
| Recommend against | 13012 | 57.2 | 19034 | 58.3 | |
|
| |||||
| PATIENTS <65 | |||||
|
| |||||
| Breast surgery | Recommend for | 52249 | 96.9 | 78347 | 98.0 |
|
| |||||
| Lymph node surgery | Recommend for | 31202 | 96.2 | 52242 | 97.8 |
| Recommend against | 10576 | 84.3 | 11829 | 80.0 | |
|
| |||||
| Chemotherapy | Recommend for | 26138 | 68.3 | 46439 | 65.3 |
| Recommend against | 22062 | 95.2 | 27564 | 95.4 | |
|
| |||||
| Radiation therapy | Recommend for | 34982 | 67.3 | 52462 | 66.9 |
| Recommend against | 10011 | 92.6 | 16124 | 93.7 | |
|
| |||||
| Hormone therapy | Recommend for | 19284 | 46.6 | 35435 | 47.8 |
| Recommend against | 7514 | 55.5 | 10802 | 56.2 | |
|
| |||||
| PATIENTS 65+ | |||||
|
| |||||
| Breast surgery | Recommend for | 28173 | 96.0 | 42869 | 97.4 |
|
| |||||
| Lymph node surgery | Recommend for | 19144 | 87.0 | 30744 | 90.8 |
| Recommend against | 4366 | 83.1 | 5628 | 82.9 | |
|
| |||||
| Chemotherapy | Recommend for | 14278 | 26.1 | 24235 | 25.0 |
| Recommend against | 11146 | 98.3 | 15750 | 98.5 | |
|
| |||||
| Radiation therapy | Recommend for | 19909 | 63.0 | 29365 | 60.6 |
| Recommend against | 4593 | 94.8 | 8673 | 96.0 | |
|
| |||||
| Hormone therapy | Recommend for | 11339 | 47.8 | 20043 | 50.8 |
| Recommend against | 5498 | 59.6 | 8232 | 60.9 | |
Measures categorized by treatment modality and recommendation type, and stratified by age at diagnosis. Concordance derived using registry data only, because claims were not available for all patients.
There were relatively high degrees of correlation between the concordance values for whites and those for African-Americans, Hispanics, and APIs in NY and CA (Figure 1a); and between Medicaid and non-Medicaid enrollees for patients < and ≥65 (Figure 1b). More variation was seen for measures with low performance compared to those with high performance (i.e., there was more clustering in the top right versus bottom left of the scatter plots). The absolute differences in concordance (Figure 2) demonstrated that the largest deficiencies between racial/ethnic groups involved chemotherapy, followed by hormone therapy and radiation therapy; and the largest deficiencies between Medicaid-enrollment groups involved radiation therapy and hormone therapy.
Figure 1. Comparisons of Concordance with Breast Cancer Quality Measures Across Racial/Ethnic and Medicaid-Enrollment Groups.
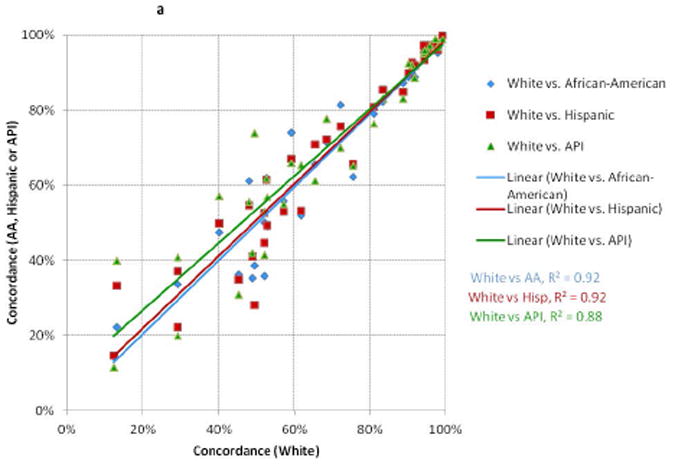
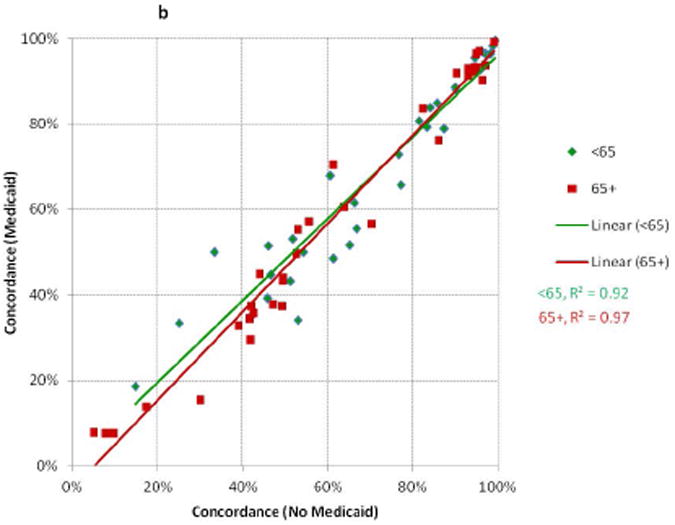
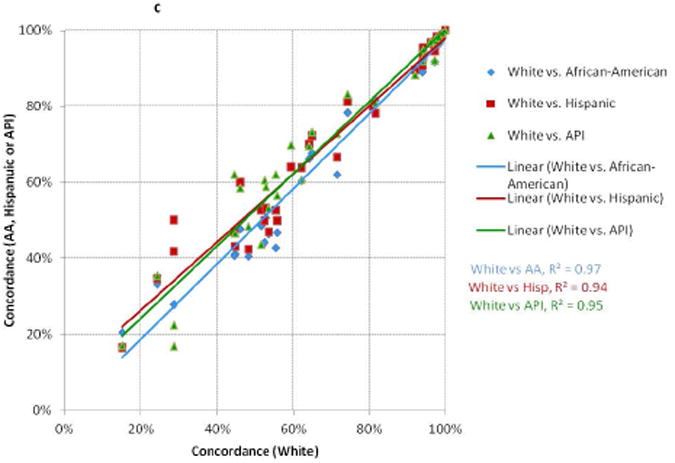
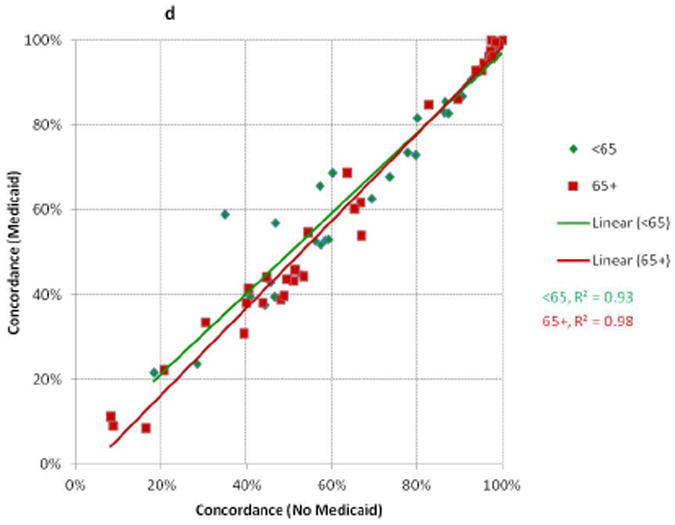
Each point represents performance on one quality measure for two patient groups. Each line represents the linear best-fit solution for a two-group comparison using data from all 34 quality measures. R2 is the coefficient of determination for each two-group comparison.
A: Whites compared to African-Americans, Hispanics, and Asian-Pacific Islanders (NY)
B: Medicaid enrollees Compared to Non-Enrollees, Stratified by Age at Diagnosis (NY)
C: Whites compared to African-Americans, Hispanics, and Asian-Pacific Islanders (CA)
D: Medicaid enrollees Compared to Non-Enrollees, Stratified by Age at Diagnosis (CA)
Figure 2. Absolute Differences in Concordance with Breast Cancer Quality Measures in NY and CA.
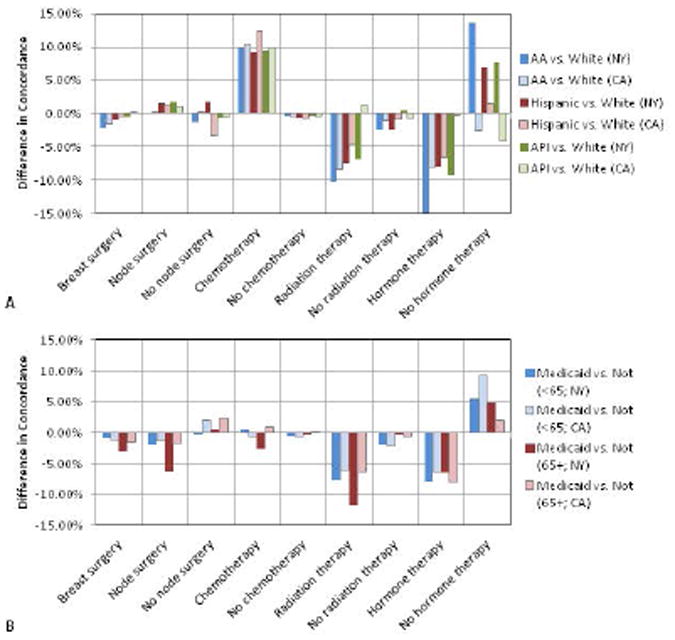
Measures of quality are evaluated using 9 groups defined by the type of treatment (breast surgery, node surgery, chemotherapy, radiation therapy, or hormone therapy) and type of recommendation (for or against treatment).
A: White versus other racial/ethnic groups
B: Medicaid enrollees vs. non-enrollees stratified by age at diagnosis
Multivariable regression revealed lower odds of receiving recommended breast surgery, radiation therapy, and hormone therapy for African-Americans versus whites in both states (Figure 3a). Hispanics in CA demonstrated disparities similar to those seen with African-Americans, whereas Hispanics in NY had similar odds of receiving recommended treatments compared to whites. APIs in CA had greater odds of receiving recommended breast surgery, radiation, and hormone therapy; whereas APIs in NY had odds that were similar to whites. Interestingly, whites usually had lower odds of receiving recommended chemotherapy in both states. Medicaid-insured patients across all ages from both states were less likely to receive recommended breast surgery, lymph node surgery, radiation therapy, and hormone therapy (except those <65 in CA; Figure 3b). Medicaid enrollees did not experience a consistent pattern of deficiency for chemotherapy. Recommendations with the largest disparities on multivariable analysis (surgery and radiation therapy) were different from those with the biggest absolute concordance differences (chemotherapy and hormone therapy). Odds of overuse were similar across racial/ethnic groups and for Medicaid versus non-Medicaid enrollees.
Figure 3. Adjusted Odds of Receiving Concordant Care for Newly Diagnosed Breast Cancer in NY and CA (2004-9).
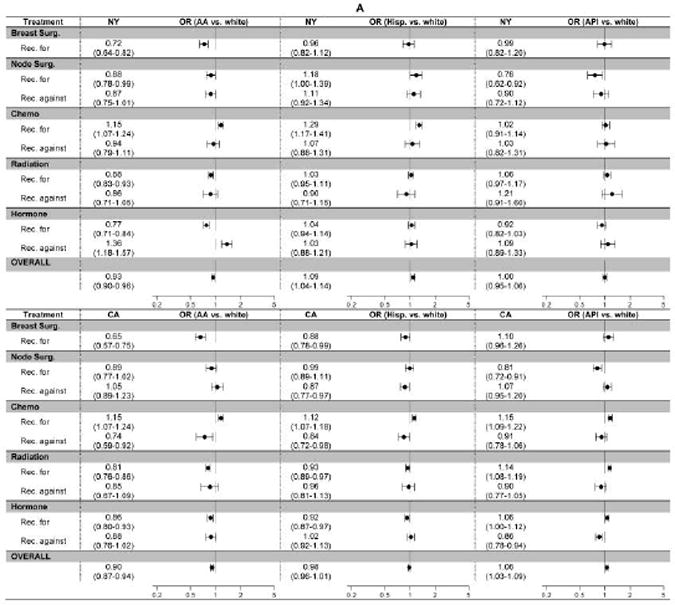
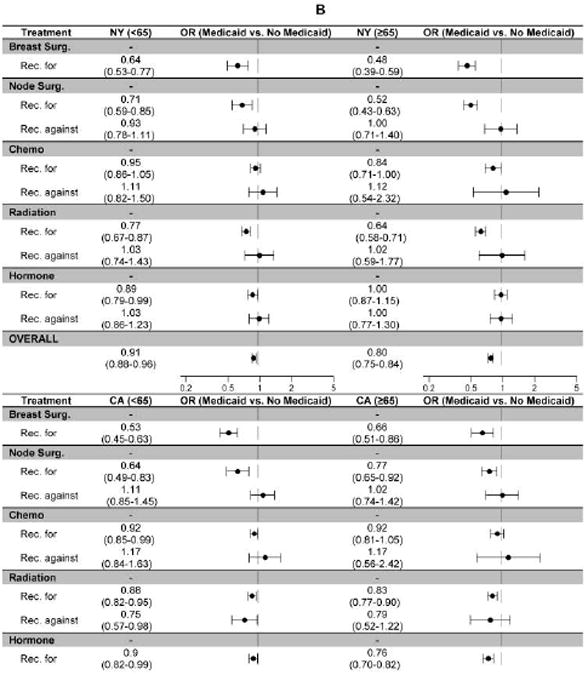
The figure displays the adjusted odds of receiving concordant care (i.e., getting the recommended treatment [Rec. for] or avoiding an unnecessary treatment [Rec. against]) for each of nine measure-sets defined by treatment modality (breast surgery, lymph node surgery, chemotherapy, radiation therapy, and hormone therapy) and type of recommendation (for or against therapy). All models control for age, race/ethnicity, marital status, Medicaid enrollment, urbanicity, median income, education, treatment type, and recommendation type.
A: White vs. other racial/ethnic groups
B: Medicaid enrollees vs. non-enrollees, stratified by age at diagnosis to account for potential Medicare eligibility
To better understand the extent to which Medicaid-enrollment and race/ethnicity explained the observed variation in concordance, we calculated the incremental increase in the C-statistic when these covariates were added to the model. Adding both covariates increased the C-statistics 5.2% and 3.7% for NY women <65 and ≥65, and 23% and 4.1% for CA women <65 and ≥65 (respectively). So, after controlling for other factors, race/ethnicity and Medicaid enrollment usually accounted for a relatively small proportion of the observed variation in concordance. The relatively modest impact of these covariates on concordance was also evidenced by the high correlation between (Figure 1) and relatively modest absolute difference separating (Figure 2) concordance values for different patient subgroups.
Discussion
We evaluated the quality of curative breast cancer treatment by calculating 34 underuse and overuse measures for women with incident stage 0-III breast cancer reported to the population-based cancer registries of NY and CA. Linking Medicaid enrollment records to cancer registry data allowed us to evaluate how Medicaid coverage relates to care quality. Using data from the NY and CA state cancer registries, we were able to assess quality for racial/ethnic groups not addressed in many previous studies. Our results provide a high level overview of care quality among important population subgroups that will facilitate the prioritization and implementation of cancer control efforts in these and other states.
Approximately two-thirds of breast cancer patients received care that was in some way non-concordant. After controlling for a range of factors, including race/ethnicity, income, education, and urbanicity, Medicaid enrollees and African-Americans experienced lower odds of receiving concordant care across age-groups and states (OR 0.80-0.91 and 0.90-0.93, respectively; Figure 3). In contrast, Hispanics and APIs did not experience overarching disparities relative to whites. Racial/ethnic and socio-economic disparities did not impact all treatments equally. African-Americans were less likely than whites to receive recommended surgery, radiation therapy, and hormone therapy, but more likely to receive recommended chemotherapy. In NY, Hispanic and white women had similar patterns-of-care, whereas in CA Hispanic and African-American women experienced similar disparities. APIs in CA, but not NY, had superior quality relative to whites. Problems with overuse were identified, but were not associated with race/ethnicity or Medicaid-enrollment.
The disparities experienced by Medicaid-enrollees affected patients whether or not they were eligible for Medicare (i.e., <65 vs. ≥65 years old); there was a high degree of correlation between the concordance values for Medicaid-enrollees and non-enrollees. Considering that the NY and CA Medicaid programs provide generous benefits with few non-financial barriers to enrollment, these findings suggest that the quality problems were not due to limited access to health insurance. Rather, other factors, such as geographic variation, hospital/provider characteristics, patient preferences, or difficulty accessing health-care services for those who have insurance likely play an important role in explaining this unwarranted variation.30-34
A previous population-based study found that SES was a key driver of the outcomes disparity experienced by breast cancer patients.35 Our results demonstrated the impact of Medicaid enrollment, likely a surrogate for SES, on process-based quality measures. Some of the treatments included in our analysis were assessed by Freedman and colleagues in a study of breast cancer patients diagnosed 1998-2005 using the National Cancer Data Base.36 The rates of treatment and patterns of results for local-regional therapy and hormone therapy were similar, but some of the associations in our analysis were of greater magnitude; our study did not identify disparities in the use of chemotherapy whereas theirs did.
While all patient subgroups experienced quality problems, different patient subgroups did not always experience disparities with the same treatments, or encounter the same disparities in different parts of the country. These findings suggest that quality improvement efforts should target treatment modalities and high-risk populations, rather than race/ethnic or Medicaid-enrollment subgroups. Interventions that target measures with the worst overall performance will offer the maximum potential benefit, because most patient subgroups experience problems with these recommendations. Interventions should also target at-risk populations (e.g., the uninsured, non-English speakers) who are likely to require assistance with multiple treatment modalities.37 Lastly, overuse warrants more attention, but this problem does not selectively impact race/ethnic or socioeconomic groups, so improvement efforts should be directed at providers rather than patients.
A principle limitation of this analysis was its reliance on treatment information as reported to cancer registries, which may under-ascertain some aspects of care. We could not supplement registry files with claims data, because our goal was to assess the entire population and claims were not available for all patients. To address this limitation we assessed measure performance among Medicaid-enrollees, because registry data could be supplemented with claims for this subset. After adding claims to registry data, measures of quality changed <1% for surgery, <2.5% for chemotherapy and radiation therapy, and <5% for hormonal therapy, confirming the high-quality nature of the registry data available from these states. Also, including claims when measuring quality had no impact on patterns of concordance across race/ethnic groups. That quality varied by urbanicity and other socio-demographic attributes further suggests that incomplete care ascertainment was not the only explanation for our findings.
Our quality measures were based on national guidelines in effect at the time patients were treated. Most remain unchanged today. However, in some cases the strength of the recommendation has diminished over time (e.g., chemotherapy for HR-positive, node-negative breast cancer). Lower rates of chemotherapy use among whites versus African-Americans could reflect earlier adoption of a new technology (gene-expression profile testing) that helped identify who was unlikely to benefit from chemotherapy; or it could reflect biologic differences not accounted for by the model. It is reassuring that patterns of concordance by race/ethnicity were the same for women with HR-positive, node-negative and HR-positive, node-positive breast cancer (data not shown). Other limitations of our analysis include the lack of a co-morbidity score and individual-level markers of SES. While these limitations (i.e., missing clinical factors, data-quality issues, and changing practice patterns) challenge efforts to assess quality relative to complex metrics and suggest that the “best case” concordance value may be something <100%, significant variation in practice performance by race/ethnicity, socio-demographic status and geographic region re-enforce the assertion that improvements to the current state are warranted.
Addressing the disparities outlined above will not ameliorate all of the differences in outcomes experienced by women with breast cancer. Differences in baseline health, co-morbid medical conditions, and biologic features still exist and account for a meaningful proportion of the observed variation in outcomes.35 That said, addressing process deficiencies through the efficient application of patient-centered quality measures at the population and organizational levels offers substantial potential to improve outcomes. To be effective, these efforts are dependent on valid and reliable data systems. Cancer registries are the foundation of population-based cancer control and enable states/health care-systems to satisfy this need. To strategically target interventions to their maximal potential benefit investments in cancer registry systems must be a priority.
Supplementary Material
Summary.
Using 34 quality measures spanning all aspects of initial breast cancer care, we assessed the underuse of recommended therapies and the overuse of unnecessary therapies for large numbers of African-American, Hispanic, Asian/Pacific Islander, and Medicaid-enrollees. Remediation strategies should focus on socioeconomically disadvantaged populations, but also must consider regional variations in practice performance.
Acknowledgments
Supported by a Susan G. Komen for the Cure Career Catalyst Award (Dr. Hassett), and National Cancer Institute R01CA131847 (Dr. Schrag)
We gratefully acknowledge the support provided by the state of California and its Cancer Registry. The sponsors had no direct influence on the design of the study, analysis of the data, interpretation of the results, or writing of the manuscript.
Footnotes
Conflicts of Interest: All authors declare no conflicts
Contributor Information
Maria J. Schymura, Email: maria.schymura@health.ny.gov.
Kun Chen, Email: kun_chen@dfci.harvard.edu.
Francis P. Boscoe, Email: francis.boscoe@health.ny.gov.
Foster C. Gesten, Email: foster.gesten@health.ny.gov.
Deborah Schrag, Email: deb_schrag@dfci.harvard.edu.
References
- 1.Malin JL, Schneider EC, Epstein AM, Adams J, Emanuel EJ, Kahn KA. Results of the National Initiative for Cancer Care Quality: How Can We Improve the Quality of Cancer Care in the United States? Journal of Clinical Oncology. 2006;24:626–634. doi: 10.1200/JCO.2005.03.3365. [DOI] [PubMed] [Google Scholar]
- 2.Moher D, Schachter HM, Mamaladze V, et al. Measuring the quality of breast cancer care in women. Evidence Report: Technology Assessment (Summary) 2004:1–8. doi: 10.1037/e439592005-001. [DOI] [PMC free article] [PubMed] [Google Scholar]
- 3.Du XL, Key CR, Osborne C, Mahnken JD, Goodwin JS. Discrepancy between consensus recommendations and actual community use of adjuvant chemotherapy in women with breast cancer. Annals of Internal Medicine. 2003;138:90–97. doi: 10.7326/0003-4819-138-2-200301210-00009. [see comment][erratum appears in Ann Intern Med. 2003 Nov 18;139(10):873][summary for patients in Ann Intern Med. 2003 Jan 21;138(2):I16; PMID: 12529113] [DOI] [PMC free article] [PubMed] [Google Scholar]
- 4.Harlan LC, Abrams J, Warren JL, Clegg L, Stevens J, Ballard-Barbash R. Adjuvant therapy for breast cancer: practice patterns of community physicians. Journal of Clinical Oncology. 2002;20:1809–1817. doi: 10.1200/JCO.2002.07.052. [DOI] [PubMed] [Google Scholar]
- 5.Bickell NA, Wang JJ, Oluwole S, et al. Missed opportunities: racial disparities in adjuvant breast cancer treatment. Journal of Clinical Oncology. 2006;24:1357–1362. doi: 10.1200/JCO.2005.04.5799. [DOI] [PubMed] [Google Scholar]
- 6.Du XL, Lin CC, Johnson NJ, Altekruse S. Effects of individual-level socioeconomic factors on racial disparities in cancer treatment and survival: findings from the National Longitudinal Mortality Study, 1979-2003. Cancer. 2011;117:3242–3251. doi: 10.1002/cncr.25854. [DOI] [PMC free article] [PubMed] [Google Scholar]
- 7.Field TS, Buist DS, Doubeni C, et al. Disparities and survival among breast cancer patients. J Natl Cancer Inst Monogr. 2005:88–95. doi: 10.1093/jncimonographs/lgi044. [DOI] [PubMed] [Google Scholar]
- 8.Haas JS, Earle CC, Orav JE, et al. Racial segregation and disparities in breast cancer care and mortality. Cancer. 2008;113:2166–2172. doi: 10.1002/cncr.23828. [DOI] [PMC free article] [PubMed] [Google Scholar]
- 9.Bigby J, Holmes MD. Disparities across the breast cancer continuum. Cancer Causes & Control. 2005;16:35–44. doi: 10.1007/s10552-004-1263-1. [DOI] [PubMed] [Google Scholar]
- 10.Bach PB, Schrag D, Brawley OW, Galaznik A, Yakren S, Begg CB. Survival of blacks and whites after a cancer diagnosis. JAMA. 2002;287:2106–2113. doi: 10.1001/jama.287.16.2106. see comment. [DOI] [PubMed] [Google Scholar]
- 11.Berry DA, Cronin KA, Plevritis SK, et al. Effect of screening and adjuvant therapy on mortality from breast cancer. New England Journal of Medicine. 2005;353:1784–1792. doi: 10.1056/NEJMoa050518. see comment. [DOI] [PubMed] [Google Scholar]
- 12.Chlebowski RT, Chen Z, Anderson GL, et al. Ethnicity and breast cancer: factors influencing differences in incidence and outcome. J Natl Cancer Inst. 2005;97:439–448. doi: 10.1093/jnci/dji064. see comment. [DOI] [PubMed] [Google Scholar]
- 13.Newman LA, Griffith KA, Jatoi I, Simon MS, Crowe JP, Colditz GA. Meta-analysis of survival in African American and white American patients with breast cancer: ethnicity compared with socioeconomic status. Journal of Clinical Oncology. 2006;24:1342–1349. doi: 10.1200/JCO.2005.03.3472. see comment. [DOI] [PubMed] [Google Scholar]
- 14.Tammemagi CM, Nerenz D, Neslund-Dudas C, Feldkamp C, Nathanson D. Comorbidity and survival disparities among black and white patients with breast cancer. JAMA. 2005;294:1765–1772. doi: 10.1001/jama.294.14.1765. [DOI] [PubMed] [Google Scholar]
- 15.Society AC. Breast Cancer Facts & Figures 2011-2012. Atlanta, GA: 2011. [Google Scholar]
- 16.Schachter HM, Mamaladze V, Lewin G, et al. Evidence Report/Technology Assessment No 105. Rockville, MD: Agency for Healthcare Research and Quality; 2004. Measuring the quality of breast cancer care in women. [DOI] [PMC free article] [PubMed] [Google Scholar]
- 17.Hassett MJ, Hughes ME, Niland JC, et al. Selecting high priority quality measures for breast cancer quality improvement. Medical Care. 2008;46:762–770. doi: 10.1097/MLR.0b013e318178ead3. see comment. [DOI] [PMC free article] [PubMed] [Google Scholar]
- 18.Hassett MJ, Weeks J. Identifying High Priority Quality Measures for Breast Cancer Quality Improvement Using Data From a Nationally Representative Sample. Journal of Clinical Oncology. 2009;27 abstract 6507. [Google Scholar]
- 19.Boscoe FP, Schrag D, Chen K, Roohan PJ, Schymura MJ. Building capacity to assess cancer care in the Medicaid population in New York State. Health Serv Res. 2011;46:805–820. doi: 10.1111/j.1475-6773.2010.01221.x. [DOI] [PMC free article] [PubMed] [Google Scholar]
- 20.Jagsi R, Abrahamse P, Hawley ST, Graff JJ, Hamilton AS, Katz SJ. Underascertainment of radiotherapy receipt in Surveillance, Epidemiology, and End Results registry data. Cancer. 2012;118:333–341. doi: 10.1002/cncr.26295. [DOI] [PMC free article] [PubMed] [Google Scholar]
- 21.Silva A, Rauscher GH, Ferrans CE, Hoskins K, Rao R. Assessing the quality of race/ethnicity, tumor, and breast cancer treatment information in a non-SEER state registry. J Registry Manag. 2014;41:24–30. [PubMed] [Google Scholar]
- 22.Malin JL, Kahn KL, Adams J, Kwan L, Laouri M, Ganz PA. Validity of cancer registry data for measuring the quality of breast cancer care. J Natl Cancer Inst. 2002;94:835–844. doi: 10.1093/jnci/94.11.835. [DOI] [PubMed] [Google Scholar]
- 23.Mallin K, Palis BE, Watroba N, et al. Completeness of American Cancer Registry Treatment Data: implications for quality of care research. J Am Coll Surg. 2013;216:428–437. doi: 10.1016/j.jamcollsurg.2012.12.016. [DOI] [PubMed] [Google Scholar]
- 24.German RR, Wike JM, Bauer KR, et al. Quality of cancer registry data: findings from CDC-NPCR's Breast and Prostate Cancer Data Quality and Patterns of Care Study. J Registry Manag. 2011;38:75–86. [PubMed] [Google Scholar]
- 25.Wolfson JA, Sun CL, Wyatt LP, Hurria A, Bhatia S. Impact of care at comprehensive cancer centers on outcome: Results from a population-based study. Cancer. 2015 doi: 10.1002/cncr.29576. [DOI] [PMC free article] [PubMed] [Google Scholar]
- 26.Inwald EC, Koller M, Klinkhammer-Schalke M, et al. Adjuvant endocrine therapy in pre- versus postmenopausal patients with steroid hormone receptor-positive breast cancer: results from a large population-based cohort of a cancer registry. J Cancer Res Clin Oncol. 2015 doi: 10.1007/s00432-015-2025-z. [DOI] [PMC free article] [PubMed] [Google Scholar]
- 27.Reeves D, Campbell SM, Adams J, Shekelle PG, Kontopantelis E, Roland MO. Combining multiple indicators of clinical quality: an evaluation of different analytic approaches. Med Care. 2007;45:489–496. doi: 10.1097/MLR.0b013e31803bb479. [DOI] [PubMed] [Google Scholar]
- 28.Fiscella K, Burstin HR, Nerenz DR. Quality measures and sociodemographic risk factors: to adjust or not to adjust. Jama. 2014;312:2615–2616. doi: 10.1001/jama.2014.15372. [DOI] [PubMed] [Google Scholar]
- 29.Yung RL, Hassett MJ, Chen K, et al. Initiation of adjuvant hormone therapy by Medicaid insured women with nonmetastatic breast cancer. J Natl Cancer Inst. 2012;104:1102–1105. doi: 10.1093/jnci/djs273. [DOI] [PMC free article] [PubMed] [Google Scholar]
- 30.Bickell NA, Weidmann J, Fei K, Lin JJ, Leventhal H. Underuse of breast cancer adjuvant treatment: patient knowledge, beliefs, and medical mistrust. J Clin Oncol. 2009;27:5160–5167. doi: 10.1200/JCO.2009.22.9773. [DOI] [PMC free article] [PubMed] [Google Scholar]
- 31.Bickell NA, LePar F, Wang JJ, Leventhal H. Lost opportunities: physicians' reasons and disparities in breast cancer treatment. J Clin Oncol. 2007;25:2516–2521. doi: 10.1200/JCO.2006.09.5539. [DOI] [PubMed] [Google Scholar]
- 32.Masi CM, Gehlert S. Perceptions of breast cancer treatment among African-American women and men: implications for interventions. J Gen Intern Med. 2009;24:408–414. doi: 10.1007/s11606-008-0868-6. [DOI] [PMC free article] [PubMed] [Google Scholar]
- 33.Chen JY, Diamant AL, Thind A, Maly RC. Determinants of breast cancer knowledge among newly diagnosed, low-income, medically underserved women with breast cancer. Cancer. 2008;112:1153–1161. doi: 10.1002/cncr.23262. [DOI] [PubMed] [Google Scholar]
- 34.Keating NL, Kouri E, He Y, Weeks JC, Winer EP. Racial differences in definitive breast cancer therapy in older women: are they explained by the hospitals where patients undergo surgery? Med Care. 2009;47:765–773. doi: 10.1097/MLR.0b013e31819e1fe7. [DOI] [PubMed] [Google Scholar]
- 35.Silber JH, Rosenbaum PR, Clark AS, et al. Characteristics associated with differences in survival among black and white women with breast cancer. JAMA. 2013;310:389–397. doi: 10.1001/jama.2013.8272. [DOI] [PubMed] [Google Scholar]
- 36.Freedman RA, Virgo KS, He Y, et al. The association of race/ethnicity, insurance status, and socioeconomic factors with breast cancer care. Cancer. 2011;117:180–189. doi: 10.1002/cncr.25542. [DOI] [PubMed] [Google Scholar]
- 37.Dohan D, Schrag D. Using navigators to improve care of underserved patients: current practices and approaches. Cancer. 2005;104:848–855. doi: 10.1002/cncr.21214. [DOI] [PubMed] [Google Scholar]
Associated Data
This section collects any data citations, data availability statements, or supplementary materials included in this article.