Abstract
Objectives
To examine the changes in bacteria in hospitalized preterm infants over the first month of life.
Methods
Rectal swabs were collected daily from 12 preterm infants. DNA was extracted from swabs from day of birth and weekly thereafter. Bacterial taxa were identified with next generation sequencing using universal bacterial primers targeted at the 16S rDNA on a 454 Roche titanium platform. Sequences were clustered into operational taxonomic units (OTUs), and taxonomy was assigned against the Greengenes databank using Qiime1.4. Quantitative PCR was used to determine the abundance of Bifidobacterium spp. Functional assessment of the microbiome was performed with PICRUSt.
Results
Average birth weight and gestational age were 1055g and 28 weeks, respectively. There were 6-35 different bacterial families identified in the day of birth samples, unrelated to mode of delivery. Richness decreased over hospitalization (week 1: 16.9±7.7 vs. weeks 3-5: 10.7±3.4, p<0.001). The Shannon diversity index demonstrated lowest diversity at birth, an increase at week 2, followed by a rapid decline at weeks 3-5, suggesting development of a more uniform microbiota composition after 2 weeks of NICU stay. Enterobacteriaceae, Staphylococcaceae, and Enterococcaceae constituted the majority of the bacterial families. Bifidobacterium spp. were infrequently detected at very low levels. PICRUSt analysis revealed enhancement of peroxisome, PPAR and adipocytokine signaling; plant-pathogen interaction; and aminobenzoate degradation pathways in week 1 samples.
Conclusions
Our results suggest that while preterm infants have individualized microbiota that are detectable at birth, the differences decrease during the neonatal intensive care unit hospitalization with increasing prominence of pathogenic microbiota.
Keywords: neonatal intensive care unit, NICU, bacteria, prematurity, VLBW infant, microbiota, PICRUSt
INTRODUCTION
Very low birth weight infants (VLBW, birth weight <1500g) are at increased risk for infectious morbidities, such as sepsis and necrotizing enterocolitis (NEC). The gut microbiota of VLBW infants has been shown to differ from that of full term healthy infants, with slower colonization and lower diversity (1) and may influence the morbidities which these infants experience (2-4). Therefore, there has been significant interest in understanding the determinants of the gut microbiota in preterm infants and its relation to disease (2-7). These studies have consisted of cross-sectional or longitudinal feces-based analyses in preterm infants. We sought to examine the changes in bacteria in hospitalized preterm infants over the first month of life using rectal swabs. We performed 16S pyrosequencing in serial rectal swab specimens in order to analyze the overall structure of the microbiota during the first 30 days of neonatal intensive care unit (NICU) stay and to specifically target Bifidobacterium spp. using quantitative polymerase chain reaction (qPCR). Additionally, we sought to characterize the microbiota functionality with PICRUSt (Phylogenetic Investigation of Communities by Reconstruction of Unobserved States) (8).
MATERIALS and METHODS
Subjects and samples
This was a non-randomized prospective pilot study of 12 preterm infants admitted to the Rush University Medical Center NICU between February and December 2009. Infants were eligible if the gestational age was < 35 weeks, the birth weight was < 2000 grams, and in the absence of significant congenital anomaly or chromosomal abnormality. This study was approved by the Rush University Institutional Review Board. Signed informed consent was obtained from a parent/guardian of all enrolled subjects. Perinatal and infant demographic, feeding and clinical data were collected prospectively. Infant feedings were per NICU protocol and attending neonatologist's discretion and were not influenced by study participation. Infant samples were collected using sterile swabs that were inserted rectally daily for the first 30 days of life (or until discharge if NICU stay less than 30 days) and at initiation and completion of an antibiotic course after the first 30 days. The samples were placed in sterile cryovials and snap frozen in liquid nitrogen at the time of collection. The samples were stored in a −70 °C freezer until time of analysis. Weekly samples were selected for each infant for analysis to obtain a longitudinal view of his/her gut microbiota in relation to clinical and nutritional events. Samples were available from day of birth for 7/12 infants and within 3 days of birth for 11/12 VLBW infants.
Sequencing
DNA was extracted using a commercially available kit, FastDNA Spin Kit for Soil, (MP Biomedicals, Solon, OH 44139 USA), using the manufacturer's recommended protocol. 5’GAGTTTGATCNTGGCTCAG3’ forward primer and 5’GNTTTACNGCGGCKGCTG3’ reverse primers were used to pyrosequence the 16S rDNA on a 454 GS FLX platform, with barcoding, using titanium kits (9).
Sequence processing
For taxonomic composition analyses: Custom C# and python scripts as well as python scripts in the Quantitative Insights Into Microbial Ecology (QIIME) software pipeline (VB Versions 1.3, 1.4 and 1.5) were used to process the sequencing files (10,11). The sequence outputs were filtered for low quality sequences (defined as any sequences that are <200 bps or >1000 bps, sequences with any nucleotide mismatches to either the barcode or primer, sequences with homopolymer runs >6, sequences with an average quality score of <25, sequences with ambiguous bases >0) and were truncated at the reverse primer. Sequences were chimera checked with Chimera Slayer (12) and chimeric sequences were filtered out. Operational taxonomic units (OTUs) denote groupings of bacteria often used when only DNA sequence data are available. In classic taxonomy, an OTU typically denotes a grouping of things that are being studied. OTUs can be defined or grouped at the level of an individual organism; a particular taxonomic group such as a species or genus; or could also be based on undetermined evolutionary relationships among organisms that share a particular characteristic (13). In this study, OTUs were generated by combining bacterial 16s sequences into groupings that have 97% sequence identity. An OTU at a 97% cutoff approximation in full length 16S SSU sequencing has been considered comparable to a single bacterial species and is widely used as such in SSU metagenomics with next generation sequencing (14). We picked OTUs for this study using uclust (15) at 97% similarity, and representative sequences were generated. Sequences were aligned with PyNAST (16) and taxonomy assignment was performed in Qiime 1.4VB against the Qiime 1.4 version of Greengenes database (17,18) using the RDP classifier (19) at an 80% value threshold. An approximately-maximum-likelihood phylogenetic tree was created using FastTree v2.1.3. (20).
For PICRUSt analysis, closed reference OTUs were picked and chimeric sequences were using usearch61 (12,16) on Qiime 1.7 VB (21) against the Greengenes 13_5 OTUs at a 97% threshold. PICRUSt (8) implementation at http://huttenhower.sph.harvard.edu/galaxy was utilized, and significant differences in Kyoto Encyclopedia of Genes and Genomes (KEGG) ortholog (KO) abundances between groups were identified, and lists of significantly differently abundant KO were analyzed using the KEGG Mapper pathway search function (22).
Quantitative PCR for Bifidobacterium spp
Quantitative PCR (qPCR) was used to determine the relative abundance of Bifidobacterium spp. since others have demonstrated limited ability of some primers to detect Bifidobacterium spp. (23). We performed a previously described and validated genus-specific Bifidobacterium spp. assay that has been used in infants (24). Hydrolysis-probe assays were ordered from Integrated DNA Technologies (IDT; Coralville, Iowa). A double-stranded DNA standard was synthesized using gBlocks Gene Fragments (IDT). The standard was 924 bp in length, and consisted of a portion of the 16S rRNA gene of Escherichia coli, with Bifidobacterium primer sequences replacing the native E. coli sequences. Standard curves were generated across 5-6 orders of magnitude, and efficiency was 87% (Bifidobacterium assay). Assays were performed in 384-well plates using a Life Technologies Viaa7 real-time PCR instrument.
Data analysis
Infant characteristics that are continuous variables are reported as means ± SD or median (IQR) as appropriate. Categorical data are presented as ratios or percentages. Histograms were used to assess the similarities and differences between bacterial fingerprints. Multivariate reduction analysis was performed using principal coordinates analysis (PCO) to evaluate for microbial compositional changes. Qiime 1.5 was used calculate Bray-Curtis and Unifrac distances based on OTUs and non-metric multidimensional scaling (NMDS) and PCO coordinates; the bipartite network attributes Cytoscape v2.8.1 was used to visualize the network and calculate network and node statistics. PerMANOVA models (25) were performed in PC-ORD. For PerMANOVA analyses, we used the Bray-Curtis similarity at the family level on rarified and log transformed data. In order to adjust for unequal sample sizes in groups, we randomly subsampled the groups 1000 times, stratified by subject and sample week, and performed a randomization test of significance of pseudo F values, with 4999 randomizations for each model, and collated the results from the 1000 subsamplings. Longitudinal data were analyzed using the Friedman test and mixed models, using SPSS (Version 19.0, Chicago, IL, USA). For significance testing of diversity indices, mixed effect linear models were used comparing week 1 samples to all others collected after week 1, at an equal sequence sampling depth of 1390 sequences per sample, including case number and the interactions between case number and week of sampling. PICRUSt results were analyzed using Linear Discriminant Analysis Effect Size (LefSe), using an alpha =0.05, more stringent All-against-All strategy, and 2.0 threshold for on the logarithmic LDA score for discriminative features (26).
RESULTS
Subject characteristics and data
Infant characteristics are reported in Table 1. Infants had a mean gestational age of 28.2 ± 1.5 weeks, birth weight of 1055 ± 234 g, with 6 (50%) males and 8/12 (67%) born by cesarean delivery (C-section). Initiation of enteral feedings occurred at a median of 4.5 days (IQR 3-7.75) with all infants receiving some maternal human milk. All mothers received antibiotics before delivery and all infants received antibiotics starting on the first day of life. Infants with birth weight <1000g received prophylactic fluconazole while central catheters were in place per NICU protocol (27). No infants received histamine2 receptor-blockers during the period of sample collection. Five infants had infectious complications including pneumonia (n=1), NEC (n=1) and late onset sepsis (n=3).
Table 1.
Subject characteristics
| Subject | GA (wk) | Sex | BW (g) | Delivery mode | Age at enteral feeding initiation (d) | PMA at last sample collection | Infectious complication | Age at onset (day) | Twin |
|---|---|---|---|---|---|---|---|---|---|
| A | 27 | M | 970 | CS | 6 | 30 5/7 | S. aureus pneumonia | 38 | - |
| B | 28 | F | 885 | V | 11 | 31 2/7 | Serratia sepsis | 24 | - |
| C | 29 6/7 | F | 1240 | CS | 3 | 31 2/7 | NEC | 11 | - |
| D | 26 2/7 | M | 900 | CS | 14 | 30 5/7 | Pseudomonas and Enterobacter sepsis | 15 | E |
| E | 26 2/7 | M | 880 | CS | 10 | 29 | S. epidermidis sepsis | 20 | D |
| F | 27 6/7 | M | 1330 | V | 2 | 31 4/7 | - | - | - |
| G | 28 6/7 | F | 1140 | V | 3 | 32 1/7 | - | - | - |
| H | 26 1/7 | F | 795 | V | 5 | 29 6/7 | - | - | - |
| I | 29 6/7 | F | 1495 | CS | 3 | 32 4/7 | - | - | - |
| J | 28 3/7 | F | 720 | CS | 3 | 32 4/7 | - | - | - |
| K | 29 5/7 | M | 1170 | CS | 4 | 31 | - | - | L |
| L | 29 5/7 | M | 1130 | CS | 7 | 33 6/7 | - | - | K |
GA=gestational age, BW=birth weight, M=male; F=female, CS=Cesarean section; V=vaginal delivery, PMA=postmenstrual age
We obtained 410,811 sequences from 12 infants who provided 56 samples, with an average sequence length of 265 bases/sequence. After quality filtering and chimera checking 244,163 sequences in total and 4428 sequences on average per sample were used for the analyses detailed below. Bacterial taxa abundances were normalized to the total number of sequences, and sequences were rarified to the minimum number sequences common to all the samples for the alpha and beta diversity analyses
Bacterial diversity is reduced after the first week of NICU stay
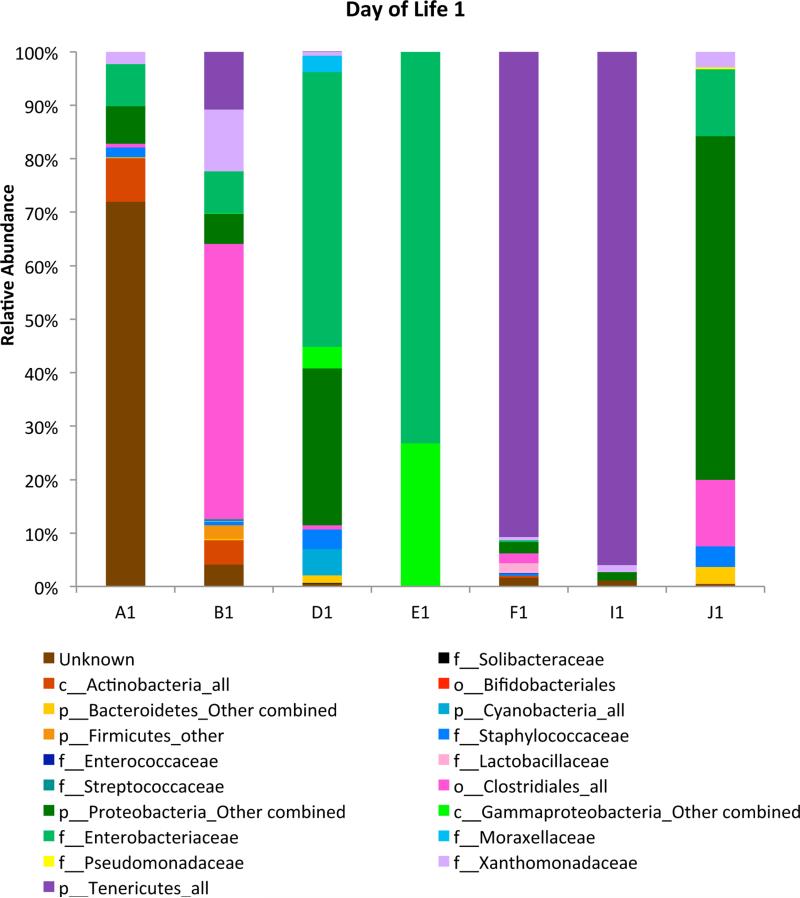
Samples were available from the day of birth (Day 1) for 7/12 infants. The number of bacterial families detected varied from 6-35 (Figure 1). Each infant had a unique pattern, with partial visual similarity between a set of twins (D1 and E1).
Figure 1.
Day of birth (Day 1) samples. The number of bacterial families detected varied from 6-35. Subjects are denoted by letter and day of life by number.
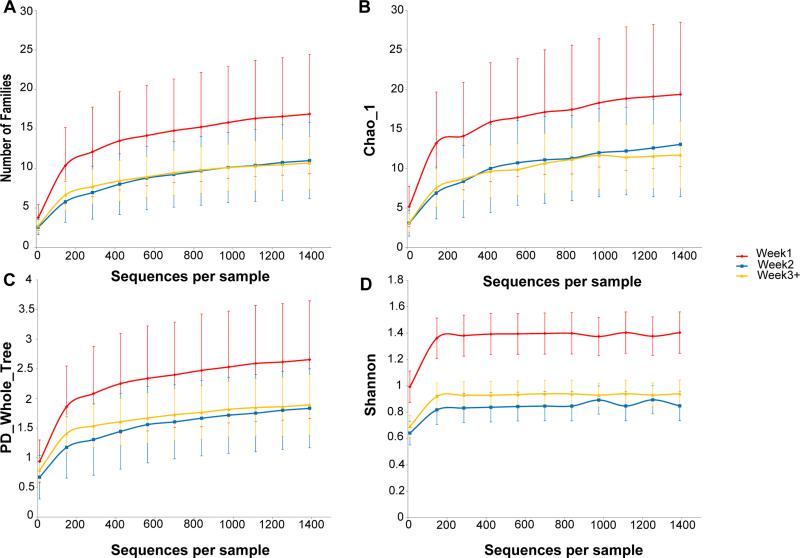
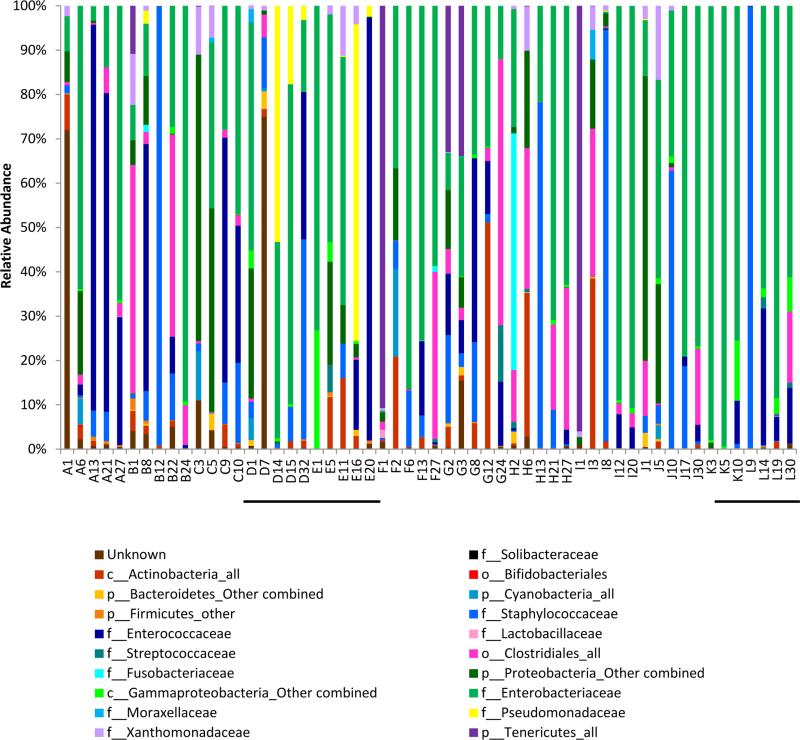
Longitudinal analyses of 56 rectal swab samples from 12 infants demonstrated a decrease in bacterial richness at the family level with increasing duration of NICU hospitalization (Figure 2A). There was a significant decrease in the number of bacterial families present between week 1 samples and samples obtained later during the NICU stay (p=0.0001) (Table 2). Figure 3 demonstrates the bacterial families seen in individual cases during the three weeks of NICU hospitalization. However, when individual bacterial sequences that had a 97% similarity were examined (i.e. an OTU level analysis was done), richness was similar over time in the NICU (supplemental digital content Figure S1A).
Figure 2.
Longitudinal analyses of rectal swab samples at the Family level. (a) Decrease in bacterial richness at the family level with increasing duration of NICU hospitalization. Bacterial diversity at the family level was reduced in samples from weeks 2 and beyond, compared to the samples obtained during the first week of NICU stay, as shown by (b) the Chao1 metric, (c) PD_Whole_Tree_Metric, (d) Shannon diversity index.
Table 2.
Bacterial Richness
| Week in NICU | Number of samples | Sample Richness (mean ± SD) | p-value |
|---|---|---|---|
| 1 | 22 | 16.9 ± 7.7 | 0.0001* |
| 2 | 17 | 11.0 ± 5.0 | |
| 3-5 | 17 | 10.7 ± 3.4 |
Comparison between week 1 samples and weeks 2-5 samples using mixed effects models
Figure 3.
Longitudinal change in bacterial families seen in individual subjects. Bacterial families that comprised at least 2% of all samples for each week are reported. Subjects are denoted by letter and day of life by number. Twin pairs are underlined (D-E and K-L)
Similarly, bacterial diversity at the family level was reduced in samples from week 2 and beyond, compared to the samples obtained during the first week of NICU stay, by the Chao1 metric (Figure 2B) (p=0.0001); PD_Whole_Tree_Metric (Figure 2C) (p =0.0001), and the Shannon diversity index (Figure 2D) (p=0.0001), whereas these diversity indices were similar at the OTU level over time in the NICU without statistically significant differences (supplemental digital content Figure S1B,S1C,S1D).
Bacterial composition is different in preterm infants over time in the NICU
A) Overall differences in bacterial composition based on ordination methods
In order to compare the types of bacterial taxa present over time in hospitalized VLBW infants, we first studied the global differences in bacterial composition in all the samples together, using ordination methods. In these methods, first, a measure of similarity (also termed a distance from here onward in this manuscript) between each pair of samples is calculated. Then, calculated distances between pairs of samples are analyzed to produce an ordering of the samples, which can typically be mapped onto a two or three dimensional graph, in which each point represents a single sample. The farther the two samples are located on the graphic representation, the higher the distance and the higher the difference in their microbial composition.
Two different similarity/distance metrics (the Bray-Curtis and Unifrac metrics) were chosen for this sample set for the following reasons: The Bray-Curtis similarity examines shared OTU counts between samples (28), whereas the Unifrac involves placing samples on a phylogenetic tree and summing branch lengths unique to a given sample on the tree (29). Consequently, Bray-Curtis similarity gives equal importance to differences in every taxa, whereas in Unifrac, phylogenetically related taxa cause less divergent Unifrac values (i.e. lower Unifrac distances) compared to distant or unrelated taxa which cause larger differences (i.e. higher Unifrac distances). Unweighted Unifrac is calculated on data depicting presence or absence of bacterial taxa in a given sample; and is equally influenced by rare and abundant bacterial taxa.
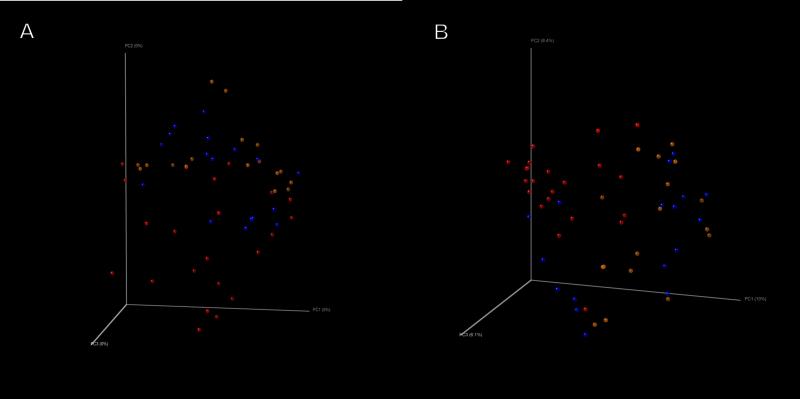
We first performed NMDS of all the samples using the count-based Bray-Curtis similarity at the OTU level. NMDS is a powerful ordination method that can uncover nonlinear relationships between samples and is widely used in ecology. Figure 4A shows that samples from the first week of NICU stay (shown in red) were located to the bottom left of the graph, compared to the week 2 samples (shown in blue) and the week 3-5 samples (shown in yellow) both of which were located to the upper right of the graph. When Unifrac distances were examined in a principal coordinates analysis (PCO) (as shown in Figure 4B), a similar separation was noted between the week 1 samples versus those from week 2 and beyond. Jackknifed estimates of the PCO analysis using Unifrac also confirmed the visual separation of the samples (supplemental digital content Figure S2). The visual differences observed were tested at the family level using perMANOVA with the Bray-Curtis similarity in a one-fixed-factor random effects model. We noted that the visual differences between weeks in the NICU were statistically significant (mean p=0.016; proportion of p values rejecting the null at 0.05= 92.9%).
Figure 4.
Beta diversity analyses demonstrating separation of Week 1 samples from those in Week 2 and Weeks 3-5 using: (a) non-metric multidimensional scaling with a Bray-Curtis metric and (b) principal coordinates analysis with an unweighted Unifrac metric. Week 1 samples are shown in red, Week 2 samples are shown in blue, and Weeks 3-5 samples are shown in yellow.
B) Examination of bacterial taxa found over time in the NICU
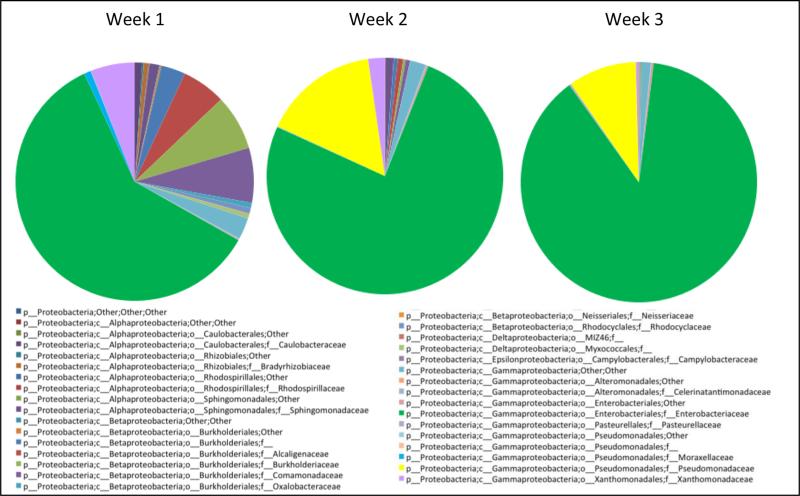
Enterobacteriaceae, Staphylococcaceae, and Enterococcaceae constituted the majority of the bacterial families in the samples. Enterobacteriaceae accounted for 33% of the bacterial families in week 1, increasing to 52% by weeks 3-5 (p=.021). While Enterobacteriaceae presence increased during NICU stay, the overall Proteobacteria presence did not change significantly from 55% to 59% between weeks 1 and 3-5 (p=1.0). This reflects the increasing dominance of the family Enterobacteriaceae within the phylum Proteobacteria over time, with Enterobacteriaceae accounting for 60% of Proteobacteria samples in week 1, 84% in week 2, and 88% by weeks 3-5 (Figure 5).
Figure 5.
Longitudinal analysis of Proteobacteria. Increasing dominance of the family Enterobacteriaceae within the phylum Proteobacteria over time.
Enterococcaceae presence/absence was associated with weeks in the NICU (FDR adjusted p-value = 0.03, with g-test), accounting for 1% of identified bacterial families in week 1, increasing to 20% by week 2. There was a significant rise in abundance of Staphylococcaceae in week 2 (FDR adjusted p-value=0.038, with ANOVA), accounting for 28% of identified bacterial families in week 2 in contrast to 3% in week 1 and 6% in weeks 3-5. The order Clostridiales (consisting of the families Clostridiaceae, Clostridiales Family XI Incertae Sedis, Veillonellaceae, Lachnospiraceae, Ruminococcaceae, and Catabacteriaceae in descending abundance) accounted for 7-8% of the microbiota in week 1 and week 2, increasing to 15% by weeks 3-5.
When individual cases were examined in depth, we found that 8/10 infants who had a sample collected during weeks 3-5 had at least 50% of their microbiota comprised of Enterobacteriaceae on at least one sample (Figure 3, shown in green). Of the two infants who did not have Enterobacteriaceae as a dominant family, one had 60% Clostridiales (G24), and the other had 71% Pseudomonadaceae (E16) with a rapid change four days later to 95% Enterococcaceae (E20).
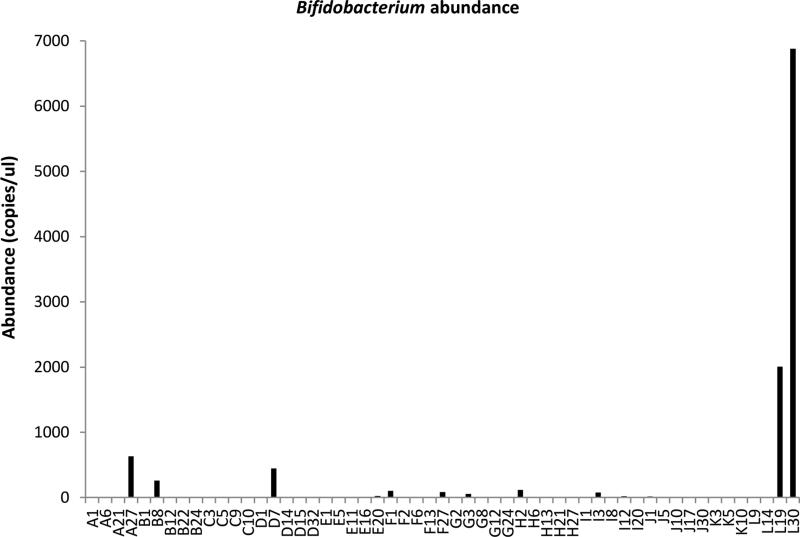
Unlike in term infants (30), we did not find significant colonization with commensal bacteria despite providing human milk to all infants in our high human milk-feeding NICU (31). In fact, with 16S sequencing, we found very low levels of colonization in one sample each from five subjects for a total of 5 of 56 samples. With qPCR, 10 out of 12 infants demonstrated colonization with Bifidobacterium spp. in 16 out of 56 samples, although at very low levels (8-6878 copies/microliter, Figure 6). The samples with detectable Bifidobacterium spp. were obtained throughout the time period of the study (week 1 n=6, week 2 n=3, weeks 3-5 n=7), with no discernible pattern. Similarly, only three infants demonstrated very low levels of colonization with organisms in the family Lactobacillaceae during week 1, no infants in week 2, and two infants in weeks 3-5.
Figure 6.
Bifidobacterium abundance by qPCR.
C) Core microbiome across samples from VLBW infants in the NICU
To determine if a core microbiome existed in our NICU, we used a definition of the core microbial taxa as being present in at least 50% of samples at the OTU level, picked at a 97% sequence similarity to each other (supplemental digital content Tables S1, S2, S3). In week 1 samples, only six OTUs were observed to be core OTUs, suggesting a high variability from infant to infant. In week 2 samples, the core OTU count rose to 14, and in weeks 3-5 samples, the core OTU count increased to 10 (supplemental digital content Figure S3). In week 2 samples, the core OTUs belonged to Enterobacteriaceae, Staphylococcaceae, and Enterococcaceae. In weeks 3-5 samples, the core OTUs belonged to Enterobacteriaceae and Enterococcaceae.
D) Network Analysis of samples over time in the NICU suggests reduction of the heterogeneity of the microbiome after a week of NICU stay
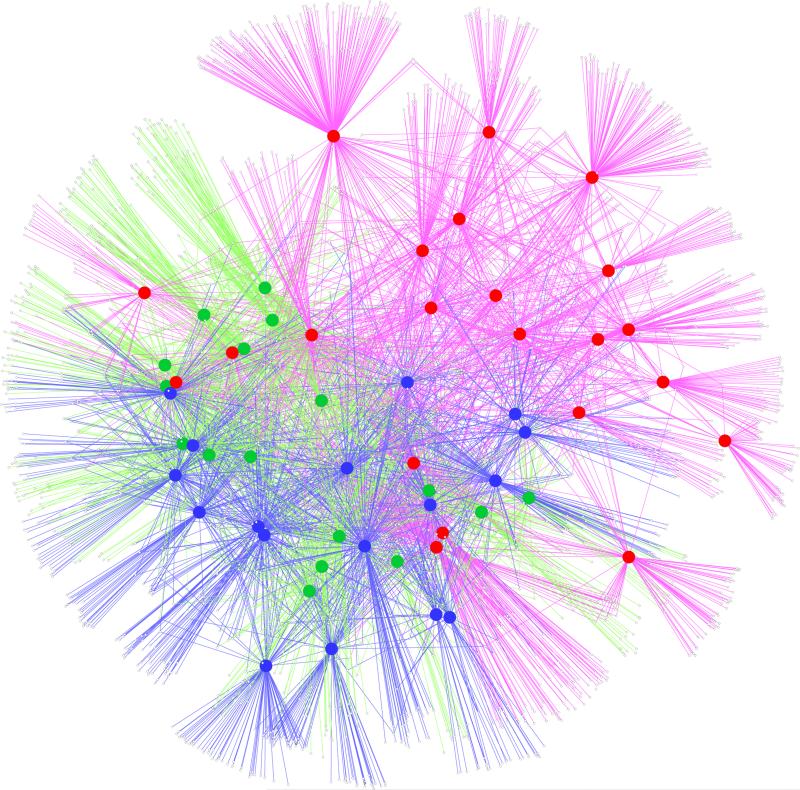
In order to evaluate bacterial OTUs associated with the samples over time in the NICU, we constructed a bipartite network of the bacterial OTUs and the samples, in which OTUs (shown as white small dots) are connected via edges (shown as lines) to sample nodes (shown as large dots in red, green or blue for samples from week 1 vs. week 2 vs. weeks 3-5, respectively) in which their sequences are found (Figure 7). We have chosen this approach because it easily allows for visualization of thousands of OTUs in limited number of samples and can reveal significant associations about the closeness of the samples and bacterial OTUs found in them. In the network, edge weights (i.e. lines that connect the OTUs to the samples) are determined by the number of sequences seen for a particular OTU in a given sample. The higher the number of sequences, the stronger the edge weight or the connection between a sample and a particular OTU. Clustering of the OTUs and samples i.e. their position on the network diagram are determined by a stochastic spring embedded algorithm as implemented in Cytoscape. The sample connections within the network are analyzed statistically with a G test of independence: Sample nodes from week 1 of NICU stay vs. week 2 vs. weeks 3-5 are tested to see whether they are more connected to a particular group than expected by chance. The network diagram shows that the samples from week 1 are spread apart (i.e. share less OTUs with each other) and are connected to a large number of OTUs, whereas samples from weeks 2 and weeks 3-5 are closer and more intertwined, hence appearing to share more bacterial OTUs. The network statistics are shown in Table S4, indicating that when the network is divided into three subnetworks by weeks in the NICU, there are differences. The week 1 subnetwork has less average neighbors, more OTU nodes, more heterogeneity and less density compared to the overall, week 2, and weeks 3-5 subnetworks. These findings are compatible with the heterogeneity of the microbiome in VLBW infants admitted to NICU at birth and during week 1, and suggest convergence towards a more uniform microbiome after the first week of NICU stay.
Figure 7.
Network analysis of samples obtained over time in the NICU. OTUs are represented by small white dots. Large dots represent patient sample nodes obtained in Week 1 in red, those obtained in Week 2 in green, and those obtained in Weeks 3-5 in blue. Sample nodes are connected to the OTU nodes in which their sequences are found via lines. Sample nodes from Week 1 are more spread apart than sample nodes from Week 2 or those from Weeks 3-5, reflecting greater sharing of OTUs in the latter weeks beyond Week 2.
Effects of delivery mode and antibiotics in the NICU
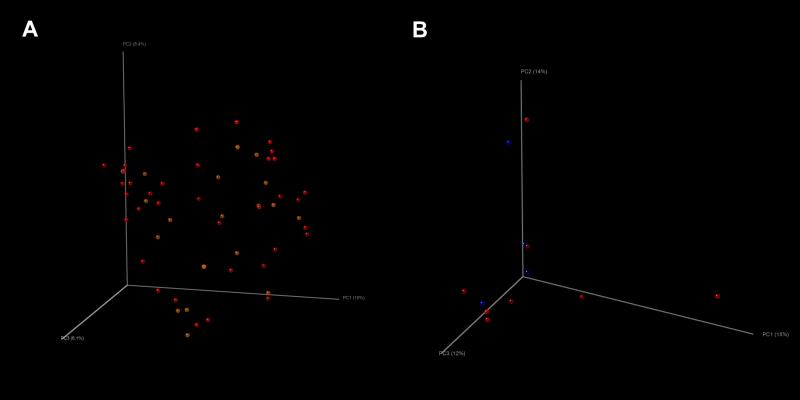
When all samples were studied, no significant visual clustering in terms of the overall bacterial composition of the samples by mode of delivery (vaginal vs. C-section) was detected using PCO analysis with a Unifrac metric, in contrast to what has been previously reported in healthy newborns (Figure 8A, vaginal shown in yellow, C-section shown in red). When only the first sample obtained from the newborns were examined, results were similar (Figure 8B, vaginal shown in blue, C-section shown in red), suggesting no association between delivery mode and the microbiota composition in VLBW infants admitted to the NICU.
Figure 8.
Principal coordinates analysis of mode of delivery and microbiota analyzing (a) all rectal swab samples from subjects (yellow= vaginal, red= C-section), and (b) only first rectal swab sample obtained from each subject (collected during days 1-3; blue= vaginal, red= C-section).
In similar PCO analyses, samples collected while off antibiotics appeared to be closer to each other (supplemental digital content Figure S4 panel A). However, few infants were off antibiotics during week 1. In fact, 20/22 samples were obtained on antibiotics in week 1, whereas 3/17 samples were obtained on antibiotics in both week 2 and weeks 3-5. When the analysis was repeated for those samples obtained on antibiotics, the majority of the visual differences seen were attributable to the use of antibiotics in week 1 versus the other weeks (supplemental digital content Figure S4 panel B). In network analyses (supplemental digital content Figure S5), the samples off antibiotics (shown in blue) had higher average number of neighbors with less heterogeneity (average number of neighbors 4.494; network heterogeneity 3.260) compared to the samples on antibiotics (shown in red, average number of neighbors 3.255; network heterogeneity 4.095).
While our sample size was not adequate to test this effect, we noted no difference in PCO analyses with the Unifrac metric between samples obtained from VLBW infants that remained healthy (subjects F-L) vs. those obtained from infants that developed infectious complications (subjects A-E; data not shown).
E) Functional predictions from the microbiome: PICRUSt Analyses
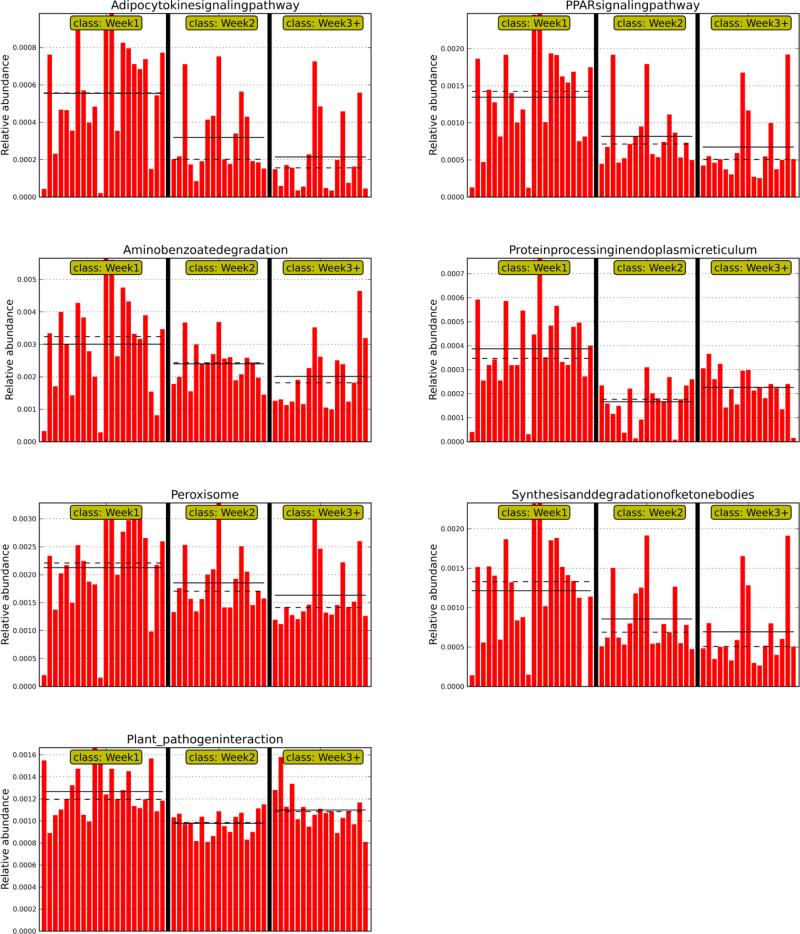
In order to identify microbial functions enriched or diminished in the neonatal microbiome over time, a predictive assessment of the microbial community functional potential (PICRUSt) was performed. We identified 330 KEGG Orthologs within all the samples. Similar to microbiome compositional differences, alterations in predicted bacterial functional pathways also were associated with weeks in the ICU. In the week 1 samples, compared to the samples from other weeks, there was differential abundance of bacterial genes that affected the following pathways: Adipokine signaling; peroxisome and peroxisome proliferator activated receptor (PPAR) signaling pathway; synthesis and degradation of ketone bodies; aminobenzoate degradation; protein processing in endoplasmic reticulum; and plant pathogen interaction ( Figure 9). When antibiotic effects were taken into account, predicted bacterial functional pathways also separated week 1 samples: There was still a significant enhancement of the pathways for PPAR and adipocytokine signaling; plant pathogen interaction; and protein processing in endoplasmic reticulum in samples obtained in week 1 on antibiotics versus those obtained in week 3 off antibiotics, further elucidating the importance of these pathways in the preterm VLBW neonatal gut over time and with exposure to antibiotics (supplemental digital content Figure S6).
Figure 9.
PICRUST analysis demonstrating differential abundance of bacterial genes in week 1 compared to later weeks in the NICU.
DISCUSSION
The analysis of microbiota from 12 preterm infants suggests that while preterm infants have individualized microbiota detectable at birth, the differences decrease during the NICU hospitalization. Our results are similar to those of Schwiertz et al who used PCR-DGGE to investigate fecal microbiota of 29 preterm infants hospitalized in the NICU (1). They found that the band profiles from these infants became increasingly similar with increasing duration of NICU stay, with 70-80% similarity noted after the second week. This similarity was not impacted by birth weight, feeding regimen or antibiotic use. In contrast, Barrett et al found a lack of uniformity among their preterm infant microbiota over the first 4 weeks of hospitalization, although they also found the most often encountered family to be Enterobacteriaceae (32). Our data goes beyond their observations and suggests a dominance of this family of bacteria in the majority of NICU VLBW infants, comprising over 50% of the obtained sequences. This increase in microbiota similarity with increasing NICU hospitalization may reflect the importance of the environment on colonization patterns in hospitalized preterm infants (33). Alternatively, La Rosa et al have recently demonstrated a convergence of hospitalized premature infant fecal bacterial populations to Clostridial abundance when stratified by postmenstrual age (PMA) at sample acquisition, notably after reaching 33-36 weeks PMA (34). While we also noted an increase in Clostridiales in the weeks 3-5 samples, the PMA at the last sample acquisition for our subjects ranged between 29 - 33 6/7 weeks, with the majority <33 weeks. Thus we may not have detected the later rise in Clostridia described by La Rosa et al. due to the earlier termination of our study.
Low level of Bifidobacterium spp. in our samples despite using qPCR may be due to widespread antibiotic use in our NICU, as a recent study showed that the only preterm infant who was heavily colonized with Bifidobacterium had not received any antibiotics (32). The paucity of Bifidobacteriales in our samples may also be due to the immaturity of infants in our cohort.
Butel et al demonstrated that colonization with Bifidobacterium only occurred in 18/52 preterm infants who were all born at a gestational age > 32.9 weeks, and that Bifidobacterium was detected at a PMA > 34 weeks for the majority of the colonized infants (5). They proposed that a sufficient developmental maturation of the gut is necessary for implantation with Bifidobacterium and that premature birth may impair this colonization due to alteration of the relationship between this bacterial taxa and intestinal cells. In contrast to Butel et al, the infants in our cohort were all born at a gestational age < 30 weeks with the latest sample in this study being obtained at a PMA <33 weeks for 11/12 infants. Unlike our findings, Barrett et al recently found significant colonization with Bifidobacterium and some Lactobacillus in 2 infants with ileostomy and colostomy; however, the samples were collected starting in weeks 5 and 6 of NICU hospitalization, and data on early colonization patterns were not provided(35). Thus, the paucity of commensal bacterial colonization in published studies in preterm infants could also be reflective of the short duration of the current studies and colonization with Bifidobacterium may increase with maturity (6,7,32).
We found decreased heterogeneity in the samples obtained off antibiotics compared to the samples on antibiotics. This likely reflects the time course of sample collection, with the majority of off-antibiotics samples collected during weeks 2-5, during which time the effects of previous antibiotic courses may be evident. Other investigators have recently described a delayed impact of antibiotic courses on microbiota with a decrease in bacterial diversity noted at 10 days of life (36) and in the second and third weeks of life (37).
A concerning finding in our study is the increasing prevalence over time of Enterobacteriaceae, which account for the majority of clinically significant gram-negative pathogens seen in NICUs, such as Escherichia coli, Klebsiella spp., Enterobacter spp., and Serratia spp. (38). The remaining dominant families (Staphylococcaceae, Enterococcaceae) are also composed of potential pathogens that are frequently associated with late onset sepsis in VLBW infants and infrequently associated with necrotizing enterocolitis (Clostridiaceae) (3). This is similar to other studies that have also detected high level colonization with pathogenic or potentially pathogenic bacteria in hospitalized preterm infants (7,35,39). While Gupta et al (40) have recently demonstrated increased abundance of Proteobacteria which contains Enterobacteriaceae with use of histamine-2 receptor blockers in preterm infants; none of our infants received such therapy during the timeframe of sample collection.
Our PICRUSt results suggest a dominance of bacterial genes that affect important human host pathways, such as PPAR and adipocytokine signaling. PPARs are a family of nuclear receptors that recognize both endogenous and also microbial lipid moieties and thereby alter metabolic and immune function (41). In the intestinal mucosa , PPAR –γ signaling is a central pathway that affects export of nuclear factor –κ-B (NFKB) from the nucleus decreasing levels of interleukin- 8 (IL-8). Commensal bacteria have been found to attenuate pathways of inflammation through PPAR –γ (42,43). Decline in bacterial genes capable of altering this pathway over the weeks in the NICU is compatible with our finding of accumulation of potentially pathogenic bacterial families at the expense of commensal bacteria in our dataset. Alternatively, it is plausible that this pathway could have also played a role in the preterm delivery of the infant (44). Another pathway of importance that was differentially enhanced in our week 1 samples was adipocytokine signaling. Leptin and adiponectin, two major members of the adipocytokine signaling pathway, are central links among nutritional status, metabolism, immunity and growth (45). Most recently, leptin has been shown to directly modulate gut microbial composition independently of food intake (46). Our PICRUSt results also hint at enhancement of the plant-pathogen interaction pathway. This pathway modulates plant pattern-recognition receptors, serving a role similar to pattern recognition receptors such as toll- like receptors in human, and responses to bacterial flagellin and other microbe associated molecular patterns (MAMPs) (47). The enhancement of this pathway in week 1 samples, especially those on antibiotics, suggests production of pro-inflammatory molecules in response to microbe associated molecular patterns (MAMPs). Lastly, our PICRUSt results suggest the aminobenzoate degradation pathways as another one of importance in week 1 samples and this pathway is enhanced in α- and β- Proteobacteria, especially those found in the environment (48). Exactly why this pathway may be enhanced in week 1 samples is unclear; however this pathway is tied to cross regulation between aerobic and anaerobic pathways of catabolism in bacteria, folate synthesis as well as catechol synthesis (48). Notably, one member of the α-Proteobacteria, Sneathia amnii, has been associated with preterm labor (49). The loss of aminobenzoate degradation over time in our sample set is compatible with increase in the abundance of Enterobacteriaceae, which are γ-Proteobacteria, some of which may not have the functional capacity to degrade aminobenzoate. In summary, our PICRUSt results suggest that the microbiota compositional changes we observe over time in the NICU correlate with significant functional metabolic and immune consequences. Further studies are needed to determine the exact bacterial products in preterm VLBW infants that affect especially the PPAR and adipocytokine signaling pathways and TLRs, both positively and negatively in the neonatal gut, in order to determine the effects of these pathways in both preterm labor and inflammation-associated morbidities in preterm infants. Approaches that concomitantly characterize the infant microbiome, metatranscriptome and metabolome with untargeted efforts and directed efforts examining the pathways enhanced above and measurement of known metabolites of bacteria such as short chain fatty acid in fecal specimens should be used in future studies that further examine the effects of the microbiome in the VLBW infant gut.
Our study is one of the first to examine gut microbiota of preterm infants using rectal swabs instead of fecal samples (36). We chose rectal swabs because they allowed daily sample collection rather than dependence on an infant's stooling frequency and limited contamination with the skin and diaper flora. However, limitations remain in that rectal swab results may not reflect the microbial composition in the small intestines, which has been shown to differ in infants who have undergone surgical diversions (35). Future investigations should compare the microbiota obtained using rectal swabs vs. fecal samples in premature infants.
Limitations of this study include the small sample size, which prevented analysis of the relationship between infectious complications and gut microbiota. Additionally, this was a single-center study with a high level of antibiotic exposure in mothers prenatally and infants postnatally, which are known to impact gut microbiota (37). Other studies of preterm infant gut microbiota have also demonstrated high usage of antibiotics in infants (35,37,39). Thus our study reflects the practice that was common, although not ideal, at the time samples were obtained. These and other clinical studies of preterm infants (50) have helped inform practice change to curtail the usage of antibiotics in this high-risk population.
Our results suggest that while preterm infants have individualized microbiota that are detectable at birth, the differences decrease during the NICU hospitalization with increasing prominence of pathogenic microbiota. Thus, the NICU environment may impact preterm infants’ microbiota, and local effects may need to be considered in multicenter studies of interventions aimed at altering gut microbiota.
Supplementary Material
What is known about this subject?
Colonization of the gut in preterm infants differs from full term infants, with reduced diversity.
Mode of delivery impacts colonization patterns in full term infants.
Early antibiotic treatment in preterm infants is associated with reduction in diversity that extends beyond the duration of antibiotic therapy.
What are the new findings?
After two weeks of NICU hospitalization, there is a convergence of microbiota in preterm infants.
Mode of delivery does not impact colonization patterns in preterm infants.
PICRUSt analyses suggest that the microbiota changes over time are potentially correlated with metabolic and immune consequences for the host.
Acknowledgments
Funding support: Rush University 2008 Pilot Project Grant and NIH Grant NR010009
Footnotes
Conflict of Interest: The authors do not have any conflicts of interest to disclose.
REFERENCES
- 1.Schwiertz A, Gruhl B, Lobnitz M, et al. Development of the intestinal bacterial composition in hospitalized preterm infants in comparison with breast-fed, full-term infants. Pediatr Res. 2003;54:393–399. doi: 10.1203/01.PDR.0000078274.74607.7A. [DOI] [PubMed] [Google Scholar]
- 2.Bjorkstrom MV, Hall L, Soderlund S, et al. Intestinal flora in very low-birth weight infants. Acta Paediatr. 2009;98:1762–1767. doi: 10.1111/j.1651-2227.2009.01471.x. [DOI] [PubMed] [Google Scholar]
- 3.de la Cochetiere MF, Piloquet H, des Robert C, et al. Early intestinal bacterial colonization and necrotizing enterocolitis in premature infants: the putative role of Clostridium. Pediatr Res. 2004;56:366–370. doi: 10.1203/01.PDR.0000134251.45878.D5. [DOI] [PubMed] [Google Scholar]
- 4.Wang Y, Hoenig JD, Malin KJ, et al. 16S rRNA gene-based analysis of fecal microbiota from preterm infants with and without necrotizing enterocolitis. The ISME Journal. 2009;3:944–954. doi: 10.1038/ismej.2009.37. [DOI] [PMC free article] [PubMed] [Google Scholar]
- 5.Butel M, Suau A, Campeotto F, et al. Conditions of Bifidobacterial Colonization in Preterm Infants: A Prospective Analysis. JPGN. 2007;44:577–582. doi: 10.1097/MPG.0b013e3180406b20. [DOI] [PubMed] [Google Scholar]
- 6.Gewolb IH, Schwalbe RS, Taciak VL, et al. Stool microflora in extremely low birthweight infants. Archives of Disease in Childhood Fetal & Neonatal Edition. 1999;80:167–173. doi: 10.1136/fn.80.3.f167. [DOI] [PMC free article] [PubMed] [Google Scholar]
- 7.Mai V, Young CM, Ukhanova M, et al. Fecal Microbiota in Premature Infants Prior to Necrotizing Enterocolitis. PLoS ONE. 2011;6:e20647. doi: 10.1371/journal.pone.0020647. [DOI] [PMC free article] [PubMed] [Google Scholar]
- 8.Langille MGI, Zaneveld J, Caporaso JG, et al. Predictive functional profiling of microbial communities using 16S rRNA marker gene sequences. Nat Biotech. 2013;31:814–821. doi: 10.1038/nbt.2676. [DOI] [PMC free article] [PubMed] [Google Scholar]
- 9.Schunter M, Chu H, Hayes TL, et al. Randomized pilot trial of a synbiotic dietary supplement in chronic HIV-1 infection. BMC Complement Altern Med. 2012;12:84. doi: 10.1186/1472-6882-12-84. [DOI] [PMC free article] [PubMed] [Google Scholar]
- 10.Gonzalez-Hernandez LA, Jave-Suarez LF, Fafutis-Morris M, et al. Synbiotic therapy decreases microbial translocation and inflammation and improves immunological status in HIVinfected patients: a double-blind randomized controlled pilot trial. Nutr J. 2012;11:90. doi: 10.1186/1475-2891-11-90. [DOI] [PMC free article] [PubMed] [Google Scholar]
- 11.Smith DM, Snow DE, Rees E, et al. Evaluation of the bacterial diversity of pressure ulcers using bTEFAP pyrosequencing. BMC Med Genomics. 2010;3:41. doi: 10.1186/1755-8794-3-41. [DOI] [PMC free article] [PubMed] [Google Scholar]
- 12.Edgar RC. Search and clustering orders of magnitude faster than BLAST. Bioinformatics. 2010;26:2460–2461. doi: 10.1093/bioinformatics/btq461. [DOI] [PubMed] [Google Scholar]
- 13.Sokal RR, Sneath PHA. Principles of Numerical Taxonomy. W. H. Freeman; San Francisco: 1963. [Google Scholar]
- 14.Edgar RC. UPARSE: highly accurate OTU sequences from microbial amplicon reads. Nat Methods. 2013;10:996–998. doi: 10.1038/nmeth.2604. [DOI] [PubMed] [Google Scholar]
- 15.Ishak HD, Plowes R, Sen R, et al. Bacterial diversity in Solenopsis invicta and Solenopsis geminata ant colonies characterized by 16S amplicon 454 pyrosequencing. Microb Ecol. 2011;61:821–831. doi: 10.1007/s00248-010-9793-4. [DOI] [PubMed] [Google Scholar]
- 16.Edgar RC, Haas BJ, Clemente JC, et al. UCHIME improves sensitivity and speed of chimera detection. Bioinformatics. 2011;27:2194–2200. doi: 10.1093/bioinformatics/btr381. [DOI] [PMC free article] [PubMed] [Google Scholar]
- 17.Haas BJ, Gevers D, Earl AM, et al. Chimeric 16S rRNA sequence formation and detection in Sanger and 454-pyrosequenced PCR amplicons. Genome Res. 2011;21:494–504. doi: 10.1101/gr.112730.110. [DOI] [PMC free article] [PubMed] [Google Scholar]
- 18.Caporaso JG, Bittinger K, Bushman FD, et al. PyNAST: a flexible tool for aligning sequences to a template alignment. Bioinformatics. 2010:266–267. doi: 10.1093/bioinformatics/btp636. [DOI] [PMC free article] [PubMed] [Google Scholar]
- 19.McDonald D, Price MN, Goodrich J, et al. An improved Greengenes taxonomy with explicit ranks for ecological and evolutionary analyses of bacteria and archaea. ISME J. 2012;6:610–618. doi: 10.1038/ismej.2011.139. [DOI] [PMC free article] [PubMed] [Google Scholar]
- 20.Werner JJ, Koren O, Hugenholtz P, et al. Impact of training sets on classification of high-throughput bacterial 16s rRNA gene surveys. ISME J. 2012;6:94–103. doi: 10.1038/ismej.2011.82. [DOI] [PMC free article] [PubMed] [Google Scholar]
- 21.Caporaso JG, Kuczynski J, Stombaugh J, et al. QIIME allows analysis of high-throughput community sequencing data. Nat Methods. 2010;7:335–336. doi: 10.1038/nmeth.f.303. [DOI] [PMC free article] [PubMed] [Google Scholar]
- 22.Kanehisa M, Goto S, Sato Y, et al. KEGG for integration and interpretation of large-scale molecular data sets. Nucleic Acids Res. 2012;40:D109–14. doi: 10.1093/nar/gkr988. [DOI] [PMC free article] [PubMed] [Google Scholar]
- 23.Hayashi H, Sakamoto M, Benno Y. Evaluation of three different forward primers by terminal restriction fragment length polymorphism analysis for determination of fecal bifidobacterium spp. in healthy subjects. Microbiol Immunol. 2004;48:1–6. doi: 10.1111/j.1348-0421.2004.tb03481.x. [DOI] [PubMed] [Google Scholar]
- 24.Penders J, Vink C, Driessen C, et al. Quantification of Bifidobacterium spp., Escherichia coli and Clostridium difficile in faecal samples of breast-fed and formula-fed infants by real-time PCR. FEMS Microbiol Lett. 2005;243:141–147. doi: 10.1016/j.femsle.2004.11.052. [DOI] [PubMed] [Google Scholar]
- 25.Wang Q, Garrity GM, Tiedje JM, et al. Naive Bayesian classifier for rapid assignment of rRNA sequences into the new bacterial taxonomy. Appl Environ Microbiol. 2007;73:5261–5267. doi: 10.1128/AEM.00062-07. [DOI] [PMC free article] [PubMed] [Google Scholar]
- 26.Segata N, Izard J, Waldron L, et al. Metagenomic biomarker discovery and explanation. Genome Biol. 2011;12:R60. doi: 10.1186/gb-2011-12-6-r60. [DOI] [PMC free article] [PubMed] [Google Scholar]
- 27.Aziz M, Patel AL, Losavio J, et al. Efficacy of fluconazole prophylaxis for prevention of invasive fungal infection in extremely low birth weight infants. Pediatr Infect Dis J. 2010;29:352–356. doi: 10.1097/INF.0b013e3181bf8eb1. [DOI] [PubMed] [Google Scholar]
- 28.McKenna P, Hoffmann C, Minkah N, et al. The macaque gut microbiome in health, lentiviral infection, and chronic enterocolitis. PLoS Pathog. 2008;4:e20. doi: 10.1371/journal.ppat.0040020. [DOI] [PMC free article] [PubMed] [Google Scholar]
- 29.Bray JR, Curtis CT. An ordination of upland forest communities of southern Wisconsin. Ecological Monographs. 1957;27:325–349. [Google Scholar]
- 30.Penders J, Thijs C, Vink C, et al. Factors influencing the composition of the intestinal microbiota in early infancy. Pediatrics. 2006;118:511–521. doi: 10.1542/peds.2005-2824. [DOI] [PubMed] [Google Scholar]
- 31.Meier PP, Patel AL, Bigger HR, et al. Supporting breastfeeding in the neonatal intensive care unit: Rush Mother's Milk Club as a case study of evidence-based care. Pediatr Clin North Am. 2013;60:209–226. doi: 10.1016/j.pcl.2012.10.007. [DOI] [PubMed] [Google Scholar]
- 32.Barrett E, Kerr C, Murphy K, et al. The individual-specific and diverse nature of the preterm infant microbiota. Arch Dis Child Fetal Neonatal Ed. 2013 Feb;20138 doi: 10.1136/archdischild-2012-303035. [DOI] [PubMed] [Google Scholar]
- 33.Almuneef MA, Baltimore RS, Farrel PA, et al. Molecular typing demonstrating transmission of gram-negative rods in a neonatal intensive care unit in the absence of a recognized epidemic. Clin Infect Dis. 2001;32:220–227. doi: 10.1086/318477. [DOI] [PubMed] [Google Scholar]
- 34.La Rosa PS, Warner BB, Zhou Y, et al. Patterned progression of bacterial populations in the premature infant gut. Proc Natl Acad Sci U S A. 2014;111:12522–12527. doi: 10.1073/pnas.1409497111. [DOI] [PMC free article] [PubMed] [Google Scholar]
- 35.Barrett E, Guinane CM, Ryan CA, et al. Microbiota diversity and stability of the preterm neonatal ileum and colon of two infants. Microbiology Open. 2012 doi: 10.1002/mbo3.64. [DOI] [PMC free article] [PubMed] [Google Scholar]
- 36.Dardas M, Gill SR, Grier A, et al. The impact of postnatal antibiotics on the preterm intestinal microbiome. Pediatr Res. 2014;76:150–158. doi: 10.1038/pr.2014.69. [DOI] [PubMed] [Google Scholar]
- 37.Greenwood C, Morrow AL, Lagomarcino AJ, et al. Early empiric antibiotic use in preterm infants is associated with lower bacterial diversity and higher relative abundance of Enterobacter. J Pediatr. 2014;165:23–29. doi: 10.1016/j.jpeds.2014.01.010. [DOI] [PMC free article] [PubMed] [Google Scholar]
- 38.Stoll BJ, Hansen N, Fanaroff AA, et al. Late-onset sepsis in very low birth weight neonates: the experience of the NICHD Neonatal Research Network. Pediatrics. 2002;110:285–291. doi: 10.1542/peds.110.2.285. [DOI] [PubMed] [Google Scholar]
- 39.Mai V, Torrazza RM, Ukhanova M, et al. Distortions in Development of Intestinal Microbiota Associated with Late Onset Sepsis in Preterm Infants. PLoS ONE. 2013;8:e52876. doi: 10.1371/journal.pone.0052876. [DOI] [PMC free article] [PubMed] [Google Scholar]
- 40.Gupta RW, Tran L, Norori J, et al. Histamine-2 Receptor Blockers Alter the Fecal Microbiota in Premature Infants. J Pediatr Gastroenterol Nutr. 2012 doi: 10.1097/MPG.0b013e318282a8c2. [DOI] [PubMed] [Google Scholar]
- 41.Kidani Y, Bensinger SJ. Liver X receptor and peroxisome proliferator-activated receptor as integrators of lipid homeostasis and immunity. Immunol Rev. 2012;249:72–83. doi: 10.1111/j.1600-065X.2012.01153.x. [DOI] [PMC free article] [PubMed] [Google Scholar]
- 42.Kelly D, Campbell JI, King TP, et al. Commensal anaerobic gut bacteria attenuate inflammation by regulating nuclear-cytoplasmic shuttling of PPAR-gamma and RelA. Nat Immunol. 2004;5:104–112. doi: 10.1038/ni1018. [DOI] [PubMed] [Google Scholar]
- 43.Are A, Aronsson L, Wang S, et al. Enterococcus faecalis from newborn babies regulate endogenous PPARgamma activity and IL-10 levels in colonic epithelial cells. Proc Natl Acad Sci U S A. 2008;105:1943–1948. doi: 10.1073/pnas.0711734105. [DOI] [PMC free article] [PubMed] [Google Scholar]
- 44.Holdsworth-Carson SJ, Permezel M, Rice GE, et al. Preterm and infection-driven preterm labor: the role of peroxisome proliferator-activated receptors and retinoid X receptor. Reproduction. 2009;137:1007–1015. doi: 10.1530/REP-08-0496. [DOI] [PubMed] [Google Scholar]
- 45.Stofkova A. Leptin and adiponectin: from energy and metabolic dysbalance to inflammation and autoimmunity. Endocr Regul. 2009;43:157–168. [PubMed] [Google Scholar]
- 46.Rajala MW, Patterson CM, Opp JS, et al. Leptin acts independently of food intake to modulate gut microbial composition in male mice. Endocrinology. 2014;155:748–757. doi: 10.1210/en.2013-1085. [DOI] [PMC free article] [PubMed] [Google Scholar]
- 47.Zipfel C. Pattern-recognition receptors in plant innate immunity. Curr Opin Immunol. 2008;20:10–16. doi: 10.1016/j.coi.2007.11.003. [DOI] [PubMed] [Google Scholar]
- 48.Valderrama JA, Durante-Rodriguez G, Blazquez B, et al. Bacterial degradation of benzoate: cross-regulation between aerobic and anaerobic pathways. J Biol Chem. 2012;287:10494–10508. doi: 10.1074/jbc.M111.309005. [DOI] [PMC free article] [PubMed] [Google Scholar]
- 49.Harwich MD, Jr, Serrano MG, Fettweis JM, et al. Genomic sequence analysis and characterization of Sneathia amnii sp. nov. BMC Genomics. 2012;13(Suppl 8):S4. doi: 10.1186/1471-2164-13-S8-S4. [DOI] [PMC free article] [PubMed] [Google Scholar]
- 50.Cotten CM, Taylor S, Stoll B, et al. Prolonged duration of initial empirical antibiotic treatment is associated with increased rates of necrotizing enterocolitis and death for extremely low birth weight infants. Pediatrics. 2009;123:58–66. doi: 10.1542/peds.2007-3423. [DOI] [PMC free article] [PubMed] [Google Scholar]
Associated Data
This section collects any data citations, data availability statements, or supplementary materials included in this article.


