
Figure E4. Relationship between RGC receptive field centres and their dendritic arbours (related to Fig. 2).
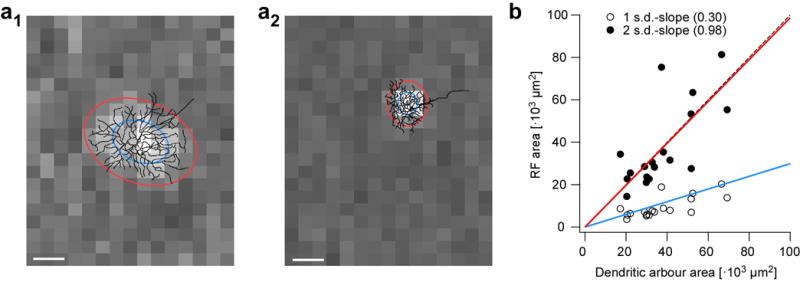
a, receptive field (RF) centre maps of a G8 transient OFF alpha RGC (a1) and a G2 small-field RGC (a2), with their reconstructed morphologies overlaid. 1- and 2-s.d. contours of RF centres fitted with 2D Gaussians are indicated by blue and red ovals, respectively. b, area of RF centre fits from (a) as function of dendritic arbour area (n=18 RGCs). Scale bar: 100 μm.