

Abstract
We report new Rosetta-based approaches to tackling the major issues that confound protein structure refinement, and the testing of these approaches in the CASP11 experiment. Automated refinement protocols were developed that integrate a range of sampling methods using parallel computation and multi-objective optimization. In CASP11, we used a more aggressive large scale structure rebuilding approach for poor starting models, and a less aggressive local rebuilding plus core refinement approach for starting models likely to be closer to the native structure. The more incorrectly modeled a structure was predicted to be, the more it was allowed to vary during refinement. The CASP11 experiment revealed strengths and weaknesses of the approaches: the high-resolution strategy incorporating local rebuilding with core refinement consistently improved starting structures, while the low-resolution strategy incorporating the reconstruction of large parts of the structures improved starting models in some cases but often considerably worsened them, largely because of model selection issues. Overall, the results suggest the high-resolution refinement protocol is a promising method orthogonal to other approaches, while the low-resolution refinement method clearly requires further development.
Keywords: structure prediction, structure refinement, protein loop modeling, protein homology modeling, Monte Carlo simulation
Introduction
Since the progress in homology model refinement described in CASP10 [1,2], studies in the area have been in two directions. One direction has aimed to make refinement found in CASP10 [3,4] more robust, and the other has searched for progress from alternative sources. This was evident at the CASP11 meeting; many groups adopted molecular dynamics (MD)-based approaches, while others sought to develop distinct approaches. The goal of the latter approaches is to solve challenges that are not well addressed yet, typically “sampling bottleneck” problems, as highlighted by the assessor in the CASP11 conference. There have been clear bottlenecks in general performance for certain starting structures throughout the CASP refinement experiments, in particular, when starting structures have been far off from the native structure, no group has succeeded in improving them substantially [1]. “Discrete search” using Monte Carlo in Rosetta [5] complements the “continuous search” of molecular dynamics (MD) simulation and hence could be useful for tackling those unsolved challenges.
In this report, we first describe new protein structure refinement methods developed within Rosetta, and then describe the strengths and weaknesses of the methods indicated by the CASP11 results.
Methods
Definition of the refinement space
Our development of new methods was based on the following conceptual understanding of the refinement problem. We define the “refinement space” as the volume of phase space that needs to be searched for the refinement of a model structure into the native structure. We consider three orthogonal axes in this space: core-refinement, partial reconstruction, and fold-level reconstruction. Core-refinement is where recent progress has been found from MD-based approaches [3,4]. As we recently described [6], core-refinement methods primarily improve residues that are nearly correct, but do not substantially improve regions with significant errors. Rosetta sampling methods could be useful for refining along the two other axes and so complement the limitations in core-refinement approaches. When the starting structure is not too far away from the native structure (high-resolution refinement), it is sufficient to reach the native by searching along the first two axes, rebuilding incorrect regions while refining the core. When the core of the protein is incorrectly modeled (low-resolution refinement), full fold-level reconstruction is required to bring an incorrect structure to a roughly correct position, from which core refinement can further improve the model.
This picture of the refinement problem is consistent with the sampling bottlenecks found in core-refinement approaches in CASP experiments. For high-resolution problems, “bottleneck” regions in starting structures (e.g. incorrect loops impeding correct core packing) may limit refinement of the core region; consequently, the magnitude of improvement achieved by core-refinement approaches strongly depends on the starting structure. For low-resolution problems, the lack of a properly formed core to serve as a seed for core-refinement similarly limits the magnitude of improvements.
Sampling methods
At a high level, our CASP11 protocol applies structural perturbations with a range of magnitudes to an evolving ensemble of conformations. In this section, we first provide a bottom-up explanation, starting from the basic refinement modules. These take as input one or a set of models, and output one or a set of refined models. In Rosetta, operators that take models as inputs and produce new models as output are called “Movers”. Movers can readily be combined in series for single processor composite protocols, or in parallel for parallel refinement protocols as described below.
Rosetta_relax [7] alternates between discrete Monte Carlo side-chain optimization and quasi Newton minimization of backbone and side-chain degrees of freedom. Five iterations are carried out: in the first three, minimization is with respect to the internal degrees of freedom; in the last two, with respect to the Cartesian degrees of freedom (x, y, z). Restraints tether the model to the input structure.
Trajectory_average [6] builds on recent advances in MD-based core-refinement methods but requires considerably less computing power. Multiple independent restrained MD or Monte Carlo minimization (MCM) simulations [7] using the Rosetta implicit solvent energy function [8] are carried out (as movers in Figure 1A) with variations in the energy function and initial side-chain preparation. Structures from those simulation trajectories are collected, filtered, and structurally averaged. The outcome of the protocol is a single refined structure with moderate changes to the starting structure. A detailed description of the method and analysis of its performance is reported in Ref. 6.
Figure 1.

Rosetta parallel-computing refinement protocols used in CASP11. A) General three-layer parallelism algorithm used for Normalmode_and_relax and Rebuild_and_relax. The roles of CPUs are divided into i) “Emperor” controlling structural pool, ii) “Masters” controlling job distribution to “Slaves”, and iii) “Slaves” carrying out actual unit sampling, which has been originally designed by Tyka et al [14]. This architecture can be modified to carry out various modeling tasks such as Rebuild_and_relax or Normalmode_and_relax by varying “mover” that perturbs structures. The size of pool is uniformly set to 20 in CASP11. B) Strategy for high-resolution targets (starting GDT-HA >= 50). Starting model is first fed into Trajectory_average [6] to generate a single refined model, followed by Rebuild_and_relax on top of it to generate multiple models with different conformations at selected regions. Trajectory_average is applied again separately to each of five models selected from Rebuild_and_relax output. C) Strategy for low-resolution targets (starting GDT-HA < 50). Starting model is perturbed by Normalmode_and_relax, clustered into 10 representative structures, and each of them are intensified by Rebuild_and_relax. For human submissions, additional regions (20 to 50% of the whole structure) are selected and rebuilt by Segment_remodel using fold-tree AbInitio [10]. Models for both categories of targets were ranked as described in the main text.
Normal_mode_sampler samples along the normal modes derived from an anisotropic network model (ANM) [9]. One of the ten lowest eigenvalue modes is selected at random, restraints are generated from models perturbed by 0.5 Å or 1.0 Å Cα RMSD along this direction, and the input model is minimized with respect to the energy supplemented with these restraints.
Segment_remodel rebuilds specified regions either using Rosetta fragment insertion followed by minimization (as in RosettaCM [10]) or kinematic loop closure [11] for internal regions, and fragment insertion [12] for termini.
The Rosetta all atom implicit solvent energy function [8] was used in all of these refinement modules; the Segment_remodel and Normal_mode_sampler method also use the Rosetta centroid energy function for the initial stages and switch over to an all-atom representation and energy function at the end. Ranking among the models generated by a method that outputs multiple models (Segment_remodel and Normal_mode_sampler) was done by the normalized sum of Rosetta full-atom energy and GOAP score [13]. Trajectory_average outputs a single structurally averaged atomic model so there is no need for selection.
The four sampling methods were integrated into composite sampling protocols using the iterative parallel-computing platform in Rosetta (Figure 1A) adapted from Tyka et al [14]. In this three-layer parallel architecture, Emperor, Master, and Slave processors communicate to sample conformations starting from an ever-evolving pool of structures. For our experiments, this structure pool was maintained at 20 structures. At each iteration, 100 new structures are collected from Master processes, added to the current pool, and – of these 120 structures – 20 are selected and the pool is updated. These 20 models are selected using Pareto optimization [15] according to three objective functions: Rosetta energy, GOAP statistical potential [13], and “structural diversity”. The structural diversity of each model was computed as the sum of the S-score [16] values to all other pool members.
Segment_remodel and Rosetta_relax were combined into a composite “Rebuild_and_relax” sampling protocol, where they were repeated for ten iterations in this parallel architecture. The regions to rebuild in Segment_remodel are chosen at the beginning of Rebuild_and_relax based on the residue fluctuations [17] observed in multiple short independent Rosetta MD simulations (20 ps × 10 trajectories): the most fluctuating regions are rebuilt, along with regions with many buried polar residues or exposed non-polar residues. Overall, 146 regions (average length of 8.2 residues per region) for 36 targets (4.1 regions per target, the engineered protein from the Baker group (TR769) was skipped) were rebuilt using Rebuild_and_relax in the automatic predictions, and an additional 60 regions in the human submissions. Likewise, Normal_mode_sampler and Rosetta_relax were combined into a composite “Normalmode_and_relax” sampling protocol. 10 iterations of Normal_mode_sampler in the sampler produces a net change to the starting structure of up to ∼3 Å Cα RMSD.
Protocol choice based on target difficulty
One of two overall refinement protocols (Figure 1B and 1C) was used depending on the starting model GDT-HA to the native structure (iGDT-HA) provided by the CASP11 organizers. We refined 24 targets with iGDT-HA greater than 50.0 using a “high-resolution strategy” (Figure 1B, TR769 was skipped) combining Trajectory_average and Rebuild_and_relax with KIC segment rebuilding. This combination was used because the quality of partial reconstruction strongly relies on the quality of the remaining parts of the model [18,19], and the success of core-refinement depends on the accuracy of modeling of individual regions. Iteration proceeded as shown in Figure 1B; multiple models (80 models from 4 independent runs) with varied segments were generated, and a number of cluster centers (usually 5) were selected for the next iteration of core-refinement. Models were ranked as described below.
The remaining 12 targets with iGDT-HA below 50 were refined using a “low-resolution strategy” (Figure 1C) that combines Rebuild_and_relax with fragment-based segment rebuilding and Normalmode_and_relax. The output structures from 5 independent runs (overall 100 models) of Normalmode_and_relax were clustered and the lowest GOAP [13] score structures within each cluster were selected as cluster representatives. Cluster size varied between 10 and 15 depending on structural variation among the sampled models. Finally, each of the cluster representatives was chosen as a starting point for one round of Rebuild_and_relax, in the predicted unreliable regions (by Rosetta MD simulations, see above). For the human submissions, we tried even more aggressive sampling; regions considered to be incorrectly modeled (roughly 20% to 50%) were removed, and Segment_rebuild – using the Rosetta CM [10] fragment based protocol – was run.
For human submissions (models 2-5) for targets less than 80 residues and iGDT-HA close to 50 (TR759, TR816 and TR829), we started from a Rosetta AbInitio [20] model selected by iGDT-HA and GOAP scores. Because of this, TR816 and TR829 – that fell into the high-resolution category for server submissions – followed a strategy closer to that of low-resolution modeling for models 2-5.
The amount of computer resources used for the automated pipeline was generally less than 1 day per target using 20 cores (< 500 core hours). Scaled to a 200-residue protein, the high-resolution strategy, with 6 runs of Trajectory_average and 8 runs of Rebuild_and_relax (Figure 1B), takes 320 core-hours; the low-resolution strategy, with 5 runs of Normalmode_and_relax and 10 ∼ 15 runs of Rebuild_and_relax (Figure 1C), takes 250 core hours. Additional computations carried out for human predictions varied significantly based on target, but were generally on the order of hundreds of core-hours.
Model selection and ranking
For human model submissions, we considered the extent of change required for complete refinement (to bring the starting model to the native). In Figure 2, the structural changes to the starting models (GDT-HAmodel-to-starting) are shown for our and other top-ranked groups' submissions as functions of iGDT-HA (GDT-HA of starting structures). Lower GDT-HAmodel-to-starting implies less similarity between submitted and starting structure and less conservative refinement. For our CASP11 submissions, we selected models where GDT-HAmodel-to-starting was close to iGDT-HA. As shown in the figure, our submissions closely matched this condition, while most of the other top-groups made more conservative submissions except for group 396 (SchröderLab).
Figure 2.
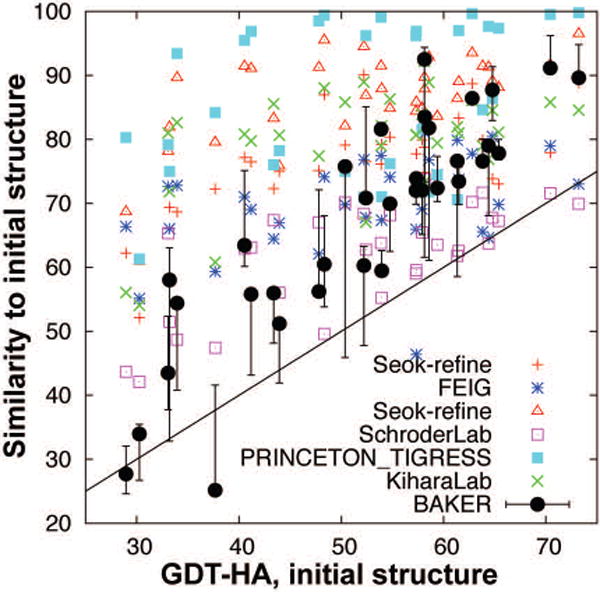
Dependence of structural similarity (GDT-HAstarting-to-model) between the submitted models and starting structures (Y-axis) on target difficulty (X-axis). Lower GDT-HAstarting-to-model indicates more aggressive submission. Diagonal line shows the structural changes necessary to bring starting structure to the native structure. Submissions by other groups are indicated for comparison.
Ranking of the five submitted models used GOAP score. For human submissions of low-resolution targets, structural changes to starting models were also considered and model 1 was selected from among the more conservative models.
Results
Overall results strongly varied on strategy
In Figure 3A, GDT-HA model quality values are compared between the starting models and our automated (top) or human (bottom) submissions. Throughout the paper, we describe results for our human submissions (group BAKER) unless specified. It is clear in both cases that our high-resolution strategy (colored red in the figure) brought overall improvements to both model1 and the best model among our 5 submissions (top5). On the other hand, the performance of the low-resolution strategy (colored blue in the figure) is questionable, at least for model selection, where there is a large gap between the overall quality of model1 and top5 submissions. A similar trend is found in Z-score analysis (Figure 3B). The panel at the right shows the Z-score difference between model1 and top5; the large decrease in Z-scores for low-resolution targets is due to model selection failures. The large difference between the performances of the high- and low-resolution strategies is not surprising as the methods are quite different.
Figure 3.
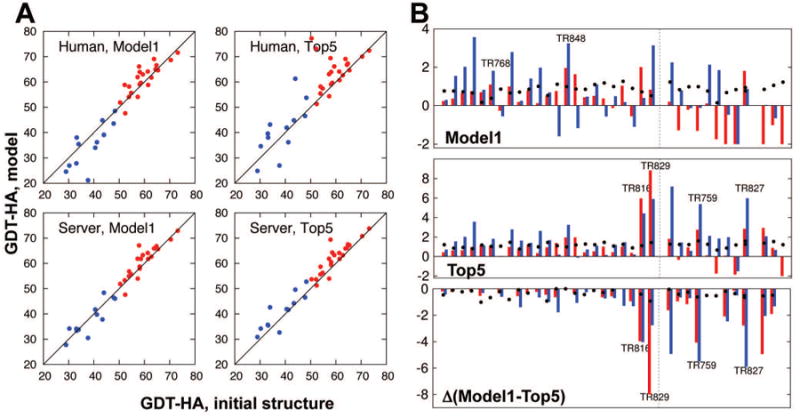
Overall results in CASP11 refinement category by Baker group. A) GDT-HA comparison between starting structures and refined models for human (upper) and server (lower) submissions. Results for the models submitted as model1 are plotted at left, and for the best among five models (top5) at right. Dots above diagonal lines are those targets improved over starting structures. The high-resolution strategy was used for the red targets, and the low-resolution strategy, for the blue targets. B) Per target Z-score for model1 (left), best among five (top5, middle), and the difference between the two (right). Red and blue bars represent Z-scores in GDT-HA and SphereGrinder [21,22], respectively. Black dots show Z-scores in MolProbity [23]. Positive values are improvements for all the quality measures. Dotted lines at the center of each panel show the border between targets that underwent high-resolution and low-resolution refinement strategies.
Table 1 summarizes performance according to four different measures: GDT-HA, SphereGrinder [21,22], Cα RMSD, and MolProbity [23]. In the accumulated Z-scores in GDT-HA for model1 submissions (against other groups submissions, setting minimum Z-score = -2.0), positive contributions by 24 high-resolution targets (+15.1, 4th among the groups) are offset by the negative contributions from 12 low-resolution targets (-11.6, 3rd worst). Similarly, using Cα RMSD, BAKER group did the best for high-resolution targets (summed Z-score +26.4; second rank SHORTLE with +18.0), but 2nd worst in low-resolution targets; SphereGrinder shows similar trends: best in high-resolution (summed Z-score by +23.3; second rank Seok-refine +19.5) but mediocre in low-resolution. If Z-scores less than 0 are not penalized (as in CASP10 [1]), the statistics are somewhat different (Supplementary Table S1). Finally, MolProbity was improved for all the targets regardless of strategy.
Table 1.
Improvements over starting models for human submissions. Average improvements are given using four different measures, and the sum of Z-scores relative to other group predictions are in parentheses. Summed Z-scores are calculated using -2.0 for the minimum value, and positive values are better for all measures. Analysis with minimum Z-score = 0.0 is provided in Supplementary Table S1.
|
| ||||||
|---|---|---|---|---|---|---|
| Target category | Num. Targets | GDT-HA (%) | Sphere Grinder (%) | Cα RMSD (Å) | MolProbity | |
| iGDT-HA >= 501) | 242) | Model1 | +1.0 (+15.1) | +3.8 (+23.3) | -0.50 (+26.4) | -1.1 (+19.7) |
| Top5 | +3.9 (+35.0) | +7.2 (+46.5) | -0.84 (+45.4) | -1.4 (+27.3) | ||
|
| ||||||
| iGDT-HA < 503) | 12 | Model1 | -3.9 (-11.6) | -1.1 (+2.3) | +1.31 (-6.6) | -1.3 (+10.0) |
| Top5 | +2.0 (+6.4) | +4.3 (+21.4) | +0.27 (+1.5) | -1.6 (+15.0) | ||
|
| ||||||
| Overall | 36 | Model1 | -0.6 (+3.5) | +2.2 (+25.6) | +0.10 (+19.8) | -1.2 (+29.7) |
| Top5 | +3.3 (+41.4) | +6.3 (+67.9) | -0.47 (+46.9) | -1.5 (+42.3) | ||
|
| ||||||
Targets with starting GDT-HA higher than or equal to 50.0, to which high-resolution strategy is applied.
TR769 is not submitted as the target protein is engineered from Baker group.
Targets with starting GDT-HA lower than 50.0, to which low-resolution strategy is applied.
In the following, we analyze the results separately for the targets subjected to the high- and low-resolution strategies.
High-resolution targets: significant improvements from the reconstruction of unreliable regions
The aims of our experiment for high-resolution targets were: a) to determine to what extent the implicit solvent simulation implemented in Rosetta can capture recent advances in core-refinement, and b) if there is synergy between partial reconstruction and core-refinement methods. To address these questions, we consider two distinct quality metrics: GDT-HA and SphereGrinder (or Cα RMSD). As pointed out by the assessor, each quality measure accounts for different aspect of protein model quality: GDT-HA is most sensitive to precise placement of protein core atoms, reporting on the performance of the core-refinement method, while SphereGrinder (and Cα RMSD) is most sensitive to repositioning of substantially incorrect regions, and therefore reports more on the performance of the segment reconstruction method.
For the model1 submissions, the average GDT-HA improvement for high-resolution targets is less (+1.0) than that of the methods based on explicit water MD simulations (Group 288 (Feig) +2.9, Group 396 (Schröder) +1.5). Also the fraction of targets that show an improvement in GDT-HA (54%) is relatively small compared to that of other top-groups; a conservative core-refinement approach by Group 106 (Tigreless_Princeton) [24] yielded a similar mean improvement in GDT-HA (+1.1) but with the highest fraction of models improved among all groups (88%). A control experiment running only our core-refinement method (Trajectory_average) shows similar mean improvement but with an increased fraction of success (77%). This suggests that running aggressive reconstruction (approximately 5 regions per target) on top of the outcome of Trajectory_average can sometimes improve GDT-HA but also can hurt, and adds noise to the consistency of improvements brought by Trajectory_average. Focusing on GDT-HA only, aggressive reconstruction efforts might be regarded as not very successful.
The reconstruction method appears more promising by other measures, however. In SphereGrinder and Cα RMSD, the average magnitude of improvements outperforms that of the core-refinement approach: +3.8/-0.50 Å (SphereGrinder/Cα RMSD) by BAKER and +2.7/-0.44 Å by BAKER_RefineServer, compared to Trajectory_average only (+0.8/-0.02 Å; for Cα RMSD, negative values are improvements). These results are better than those of other groups who mainly employed core-refinement approaches, group 288 (Feig, +0.6/+0.14 Å) and 333 (Kihara, +1.3/-0.06 Å). The fraction of models improved by these measures is also higher than those improved by GDT-HA, with 71% improved under each metric. This is consistent with our view that partial reconstruction is on a different axis than core refinement, and also with the assessor's view that model quality improvement from the reconstruction of incorrect regions is less well captured by GDT-HA than by metrics such as SphereGrinder or RMSD.
Analyzing representative examples provides further evidence that the structural improvements result from the combination of the core refinement and segment reconstruction protocols. TR848 is one of the highlights with significant improvements in an unreliable region in the starting structure (Figure 4A); our model1 improves in SphereGrinder and Cα RMSD by 14.1% and 1.1 Å respectively (best among all groups), but is not the best by GDT-HA improvement (5.1%). Model1 by group 288 (Schröder), who applied explicit water MD simulation, shows the largest improvement in GDT-HA at 6.0%, but very modest improvement using SphereGrinder (1.1%), and a slight worsening using Cα RMSD (+0.2 Å). Deviation between these quality metrics stems from the difference in regions each group mostly refined; our model improved the significantly wrong part, while the model of group 288 improved the rest of the structure. We can expect that combining two approaches would have brought even more significant improvements to this target. For TR768 (Figure 4B), AbInitio rebuilding successfully reconstructed two missing repeats in a LRR (leucine-rich repeat) protein. The reconstructed region turned out to interact with the remainder of the protein through bridging waters (red spheres in the figure), highlighting the importance of explicit waters that were not considered in our approach.
Figure 4.
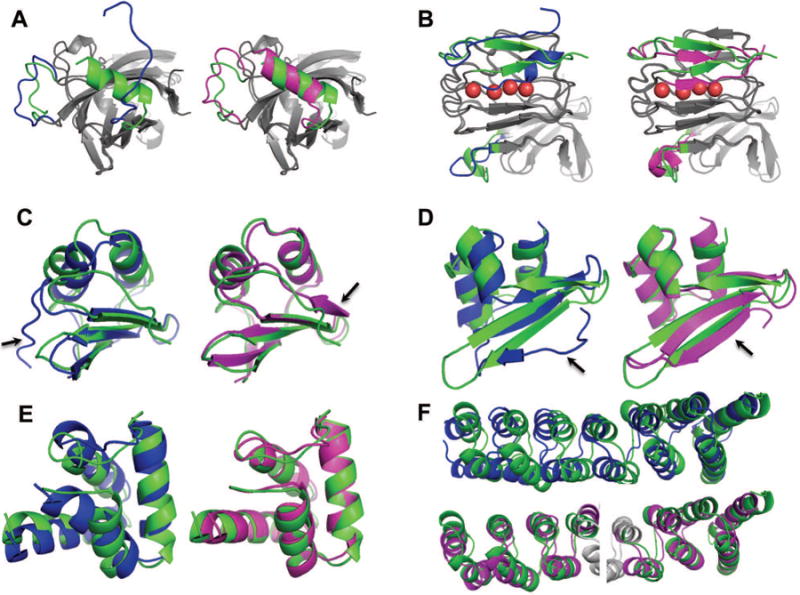
Examples of submitted models with large improvements. TR848, TR768, TR829, TR759, TR816 and TR827 (from A to F). In all panels, native, starting, and refined structures are colored in green, blue, and magenta, respectively. Regions most improved are shown by arrows. A, B) Targets to which high-resolution strategy was applied; regions reconstructed are highlighted by colors (otherwise gray). A) TR848_1 and B) TR768_1 are improved by 5.1/14.1% and 4.7/5.6% in GDT-HA/SphereGrinder, respectively. In the reconstructed part of TR768_1, b-strands shift to occupy space filled by water molecules (red spheres) in the native structure. C to E) Refinement by fully reconstructing starting structures: C) TR829_2, D) TR759_3, and E) TR816_2. Improvements in GDT-HA/SphereGrinder are D) 25.8/43.3%, E) 16.9/26.6%, and F) 22.4/18.4%, respectively. Cα RMSD changes are C) 6.2 to 1.2 Å, D) 4.2 to 2.1 Å, and E) 2.5 to 1.2 Å. F) TR827_4 for which low-resolution strategy brought major improvements: 8/12% improvements in GDT-HA/SphereGrinder, respectively. Superpositions of model to the native structure over the two halves of the protein are shown.
Overall, the results suggest that our idea for high-resolution refinement was at least partially successful in CASP11. Reconstruction of incorrect regions significantly improved SphereGrinder and Cα RMSD (but not the GDT-HA), supporting the idea that segment reconstruction can complement continuous MD or MC sampling methodologies. On the other hand, the core-refinement method we employed – based on implicit solvent simulations – did not perform as well as explicit water MD simulations used by other groups; a current research problem is whether the effect of explicit water molecules can be introduced into otherwise implicit solvent simulations to get the accuracy benefit of explicit water simulation with reduced computational cost.
Low-resolution targets: selection remains challenging
For the targets where we used a more aggressive low resolution protocol, the overall quality of our model 1 submissions was inferior by all the measures to those made using our high resolution protocol, as well as to those of other groups. GDT-HA and SphereGrinder worsen by -3.9 and -1.1 on average, respectively (Table 1), and the net Z-score for the 12 low-resolution targets is -11.6 (-0.97 per target) and +2.3 for GDT-HA and SphereGrinder, clearly worse than the +15.1 and +23.3 for the 24 high-resolution targets (Table 1). This poor performance in model1 submissions is primarily due to poor model selection; for the best of the 5 submitted models, there was an improvement over starting the structures in GDT-HA by +2.0 and SphereGrinder by +4.3 on average. Failures in model selection have two causes. First, the score function used for selection is clearly imperfect. Second, model 1 for low-resolution targets was selected using a conservative strategy (see Methods). As an example, for TR816 and TR829, model 2 had best score among the 5 models and also very significant improvement over the starting structure.
Significant improvements were obtained for targets for which large modifications were made to the starting structures: TR829 model2 (67 residues and GDT-HAmodel-to-starting = 45.9, Figure 4C) shows improvements in GDT-HA and SphereGrinder by 25.8% (from 51.1 to 76.9) and 43.3% (54.5 to 97.8), respectively, and in Cα RMSD from 6.2 to 1.2 Å. To our knowledge, this amount of improvement is the largest among all submissions not only in CASP11 (best GDT-HA improvement from others by +18.5, TR765 model2 by group 288 (Feig)) but also in all CASPs so far (best GDT-HA improvement by +19.3 in previous CASPs, TR462 model5 by group 470 (jacobson) in CASP8). The dramatic improvements in Cα RMSD and SphereGrinder come from the reconstruction of N-terminus (arrow in the panel). Significant improvements were also obtained in other cases where total structure rebuilding was used: for example TR816 model2 (Figure 4D, 68 residues and GDT-HAmodel-to-starting = 52.6) and TR759 model 3 (Figure 4E, 62 residues and GDT-HAmodel-to-starting = 49.2). On the other hand, larger targets – for which the starting structure was only partially rebuilt – show less improvement. An exception is TR827, which might have been refined through making hinge motions (such as normal mode motions) to the core region of starting structure (Figure 4F, 193 residues and GDT-HAmodel-to-starting = 41.3).
Given our poor performance in selecting model 1 during CASP11, we investigated after CASP11 whether an automated selection scheme could have done significantly better. In terms of average model quality, in retrospect automatic model 1 selection using the normalized sum of Rosetta energy plus GOAP score would have considerably outperformed our manually selected model 1 submission: this would have resulted in improvement in GDT-HA by +1.8 and summed Z-score in GDT-HA by +15.8 over all 36 targets, far better than our actual model 1 submissions (Table 1, average GDT-HA -0.6 and summed Z-score +3.5). The combination of the two metrics performs better than each individually; using only Rosetta energy or GOAP score for selection yields average GDT-HA improvement by +0.2 or 0.0 only, respectively, compared to +1.8 when combined. The improvement of the automated selection over human inspection mainly comes from successful model selection on a small number of difficult targets (TR829, TR816, and TR827) for which conservative model1 selection failed to pick models with dramatic improvements. Concluding that automatic model selection is better than human inspection based selection is likely over interpreting these results, but it is clear that conservative selection methods are not likely to perform well when the starting conformation is far from the native structure.
Although the CASP11 version of our low-resolution strategy was not very successful, the experiment suggests first, that our understanding of the low-resolution refinement problem is reasonable, and second, clear directions for improvement: extending the large-scale structure rebuilding approach used successfully for the three small targets (TR829, TR816, and TR759) to larger proteins and improving model selection.
Discussion
In succeeding CASP refinement experiments, strict high-resolution model quality metrics (such as GDT-HA looking at only model1) have been used for assessing all targets in different difficulty ranges [1,25,26]. Due to the difficulty of improving GDT-HA for low-resolution targets conservative approaches become more attractive. Indeed, in CASP11 the overall submissions by the participants for low-resolution targets were very conservative (Figure 2) and narrow in quality distributions (average standard deviation in GDT-HA values for all groups' model1s is only 2.9). To spur progress in the field, it may be useful to use metrics for hard refinement problems that reflect correct topology more than higher resolution detail which is hard to achieve starting far from the native structure.
Overall, the CASP11 experiment revealed both strengths and weaknesses of our Rosetta based refinement protocols. The results of the experiment will be very useful in developing a next generation of refinement methods.
Supplementary Material
Acknowledgments
We thank to Dr. Per Greisen, Sergey Ovchinnikov, David E. Kim, and Ray Wang in University of Washington for their technical helps during CASP. We also thank to Dr. TJ Brunette in University of Washington and Dr. Chaok Seok in Seoul National University for helpful discussions. This work was supported by US National Institutes of Health under award numbers R01GM092802 (H.P. and D.B.).
Footnotes
The authors state no conflict of interest.
References
- 1.Nugent T, Cozzetto D, Jones DT. Evaluation of predictions in the CASP10 model refinement category. Proteins. 2014;82(S2):98–111. doi: 10.1002/prot.24377. [DOI] [PMC free article] [PubMed] [Google Scholar]
- 2.Moult J, Fidelis K, Kryshtafovych A, Schwede T, Tramontano A. Critical assessment of methods of protein structure prediction (CASP) - round X. Proteins. 2014;82(S2):1–6. doi: 10.1002/prot.24452. [DOI] [PMC free article] [PubMed] [Google Scholar]
- 3.Mirjalili V, Feig M. Protein structure refinement through structure selection and averaging from molecular dynamics ensembles. J Comput Chem Theory. 2012;9:1294–1303. doi: 10.1021/ct300962x. [DOI] [PMC free article] [PubMed] [Google Scholar]
- 4.Mirjalili V, Noyes K, Feig M. Physics-based protein structure refinement through multiple molecular dynamics trajectories and structure averaging. Proteins. 2014;82(S2):196–207. doi: 10.1002/prot.24336. [DOI] [PMC free article] [PubMed] [Google Scholar]
- 5.Leaver-Fay A, Tyka MD, Lewis SM, Lange OF, Thopson J, Jacak R, Kaufman K, Renfrew PD, Smith, Colin A, Sheffler W, Davis IW, Cooper S, Treuille A, Mandell DJ, Richter F, Ban YEA, Fleishman S, Corn J, Kim DE, Lyskov S, Berrondo M, Mentzer S, Popovic Z, Havranek J, Karanicolas J, Das R, Meiler J, Kortemme T, Gray JJ, Kuhlman B, Baker D, Bradley P. Rosetta3: an object-oriented software suite for the simulation and design of macromolecules. Methods Enzymol. 2014;487:545–574. doi: 10.1016/B978-0-12-381270-4.00019-6. [DOI] [PMC free article] [PubMed] [Google Scholar]
- 6.Park H, DiMaio F, Baker D. The origin of consistent protein structure refinement from structural averaging. Structure. 2015 doi: 10.1016/j.str.2015.03.022. published online. [DOI] [PMC free article] [PubMed] [Google Scholar]
- 7.Conway P, Tyka MD, DiMaio F, Konerding DE, Baker D. Relaxation of backbone bond geometry improves protein energy landscape modeling. Protein Sci. 2014;23(1):47–55. doi: 10.1002/pro.2389. [DOI] [PMC free article] [PubMed] [Google Scholar]
- 8.O'Meara MJ, Leaver-Fay A, Tyka M, Stein A, Houlihan K, DiMaio F, Bradley P, Kortemme T, Baker D, Snoeyink J, Kuhlman B. Combined covalent-electrostatic model of hydrogen bonding improves structure prediction with Rosetta. J Chem Theory Comput. 2015;11:609–622. doi: 10.1021/ct500864r. [DOI] [PMC free article] [PubMed] [Google Scholar]
- 9.Eyal E, Yang LW, Bahar I. Anisotropic network model: systematic evaluation and a new web interface. Bioinformatics. 2006;22:2619–2627. doi: 10.1093/bioinformatics/btl448. [DOI] [PubMed] [Google Scholar]
- 10.Song Y, DiMaio F, Wang RYR, Kim DE, Miles C, Brunette TJ, Thompson J, Baker D. High resolution comparative modeling with RosettaCM. Structure. 2013;21(10):1735–1742. doi: 10.1016/j.str.2013.08.005. [DOI] [PMC free article] [PubMed] [Google Scholar]
- 11.Stein A, Kortemme T. Improvements to robotics-inspired conformational sampling in rosetta. PLoS One. 2013;8(5):e63090. doi: 10.1371/journal.pone.0063090. [DOI] [PMC free article] [PubMed] [Google Scholar]
- 12.DiMaio F, Song Y, Li X, Brunner MJ, Xu C, Conticello V, Egelman E, Marlovits TC, Cheng Y, Baker D. Atomic-accuracy models from 4.5-Å cryo-electron microscopy data with density-guided iterative local refinement. Nature Methods. 2015;12:361–365. doi: 10.1038/nmeth.3286. [DOI] [PMC free article] [PubMed] [Google Scholar]
- 13.Zhou H, Skolnick J. GOAP: A generalized orientation-dependent, all-atom statistical potential for protein structure prediction. Biophys J. 2011;101(8):2043–2052. doi: 10.1016/j.bpj.2011.09.012. [DOI] [PMC free article] [PubMed] [Google Scholar]
- 14.Tyka MD, Jung K, Baker D. Efficient sampling of protein conformational space using fast loop building and batch minimization on highly parallel computers. J Comput Chem. 2012;33:2483–2491. doi: 10.1002/jcc.23069. [DOI] [PMC free article] [PubMed] [Google Scholar]
- 15.Deb K, Pratap A, Agarwal S, Meyarivan T. A fast and elitist multiobjective genetic algorithm: NSGA-II. IEEE Transactions on Evolutionary Computation. 2002;6:182–197. [Google Scholar]
- 16.Wallner B, Elofsson A. Identification of correct regions in protein models using structural, alignment, and consensus information. Protein Sci. 2009;15:900–913. doi: 10.1110/ps.051799606. [DOI] [PMC free article] [PubMed] [Google Scholar]
- 17.Park H, Seok C. Refinement of unreliable local regions in template-based protein models. Proteins. 2012;80(8):1974–1986. doi: 10.1002/prot.24086. [DOI] [PubMed] [Google Scholar]
- 18.Park H, Lee GR, Heo L, Seok C. Protein loop modeling using a new hybrid energy function and its application to modeling in inaccurate structural environments. PLoS ONE. 2014;9(11):e113811. doi: 10.1371/journal.pone.0113811. [DOI] [PMC free article] [PubMed] [Google Scholar]
- 19.Qian B, Raman S, Das R, Bradley P, McCoy AJ, Read RJ, Baker D. High-resolution structure prediction and the crystallographic phase problem. Nature. 2007;450:259–264. doi: 10.1038/nature06249. [DOI] [PMC free article] [PubMed] [Google Scholar]
- 20.Simons KT, Kooperberg C, Huang E, Baker D. Assembly of protein tertiary structures from fragments with similar local sequences using simulated annealing and Bayesian scoring functions. J Mol Biol. 1997;268:209–225. doi: 10.1006/jmbi.1997.0959. [DOI] [PubMed] [Google Scholar]
- 21.Lukasiak P, Antczak M, Ratajczak T, Szachniuk M, Blazewicz J. Quality assessment methodologies in analysis of structural models. Proceedings of the 25th European Conference on Operational Research. 2012;80 [Google Scholar]
- 22.Kryshtafovych A, Monastyrskyy B, Fidelis K. CASP prediction center infrastructure and evaluation measures in CASP10 and CASP ROLL. Proteins. 2014;82(S2):7–13. doi: 10.1002/prot.24399. [DOI] [PMC free article] [PubMed] [Google Scholar]
- 23.Chen VB, Headd JJ, Keedy DA, Immormino RM, Kapral GJ, Murray LW, Laura W, Richardson, Jane S, Richardson, David C. MolProbity: all-atom structure validation for macromolecular crystallography. Acta Crystallographica D. 2010;66:12–21. doi: 10.1107/S0907444909042073. [DOI] [PMC free article] [PubMed] [Google Scholar]
- 24.Khoury GA, Tamamis P, Pinnaduwage N, Smadbeck J, Kieslich CA, Floudas CA. Princeton_TIGRESS: Protein geometry refinement using simulations and support vector machines. Proteins. 2013;82(5):794–814. doi: 10.1002/prot.24459. [DOI] [PubMed] [Google Scholar]
- 25.MacCallum JL, Hua L, Schnieders MJ, Pande VS, Jacobson MP, Dill KA. Assessment of the protein-structure refinement category in CASP8. Proteins. 2009;77(S9):66–80. doi: 10.1002/prot.22538. [DOI] [PMC free article] [PubMed] [Google Scholar]
- 26.MacCallum JL, Pérez A, Schnieders MJ, Hua L, Jacobson MP, Dill KA. Assessment of protein structure refinement in CASP9. Proteins. 2011;79(S10):74–90. doi: 10.1002/prot.23131. [DOI] [PMC free article] [PubMed] [Google Scholar]
Associated Data
This section collects any data citations, data availability statements, or supplementary materials included in this article.