

Abstract
Mutations in the microtubule cytoskeleton are linked to cognitive and locomotor defects during development, and neurodegeneration in adults. How these mutations impact microtubules, and how this alters function at the level of neurons is an important area of investigation. Using a forward genetic screen in mice, we identified a missense mutation in Tuba1a α-tubulin that disrupts cortical and motor neuron development. Homozygous mutant mice exhibit cortical dysgenesis reminiscent of human tubulinopathies. Motor neurons fail to innervate target muscles in the limbs and show synapse defects at proximal targets. To directly examine effects on tubulin function, we created analogous mutations in the α-tubulin isotypes in budding yeast. These mutations sensitize yeast cells to microtubule stresses including depolymerizing drugs and low temperatures. Furthermore, we find that mutant α-tubulin is depleted from the cell lysate and from microtubules, thereby altering ratios of α-tubulin isotypes. Tubulin-binding cofactors suppress the effects of the mutation, indicating an important role for these cofactors in regulating the quality of the α-tubulin pool. Together, our results give new insights into the functions of Tuba1a, mechanisms for regulating tubulin proteostasis, and how compromising these may lead to neural defects.
Keywords: neural development, motor neuron, Tuba1a, microtubule, tubulin proteostasis
Introduction
Newly born neurons must undergo dramatic changes in shape and organization in order to migrate to the proper location and establish the proper contacts with target cells. The microtubule cytoskeleton is integral in generating polarized force and intracellular transport to guide neuronal morphogenesis, migration, and synapse assembly. During neuronal morphogenesis, microtubules help to form and stabilize the axon by packing into highly stable, polarized arrays (Conde and Caceres, 2009; Witte et al., 2008). In migrating neurons, coordination between microtubules and actin filaments drive the growth cone at the distal end of the axon (Dent and Kalil, 2001; Dent et al., 2011). Whereas actin polymerization generates protrusive force for growth cone motility, microtubules steer the growth cone by integrating extracellular guidance cues into local regulation of microtubule dynamics (Bearce et al., 2015; Buck and Zheng, 2002; Lee et al., 2004; Zhou et al., 2004). Once migration is complete, microtubules promote the transformation of the growth cone into a presynaptic terminal by assembling a characteristic hairpin loop structure (Roos et al., 2000). Regulation of microtubule stability and organization subsequently instruct the architecture, activity, and remodeling of the mature synapse (Kurup et al., 2015; Stephan et al., 2015). These diverse roles suggest that the organization and dynamics of the microtubule cytoskeleton must be exquisitely regulated during neural development.
One potential point of regulation is at the level of tubulin subunits that form microtubules. The core building blocks of microtubules are heterodimers of α- and β-tubulin proteins. Metazoans express multiple isotypes of α- and β-tubulins from different genes. Isotypes exhibit different amino acid sequences, and in vitro experiments show that purified α- and β-tubulin isotypes have different effects on microtubule dynamics (Bode et al., 2003; Derry et al., 1997; Luduena and Banerjee). Although this suggests that isotypes could differentially regulate microtubule networks in vivo, the contributions of isotypes to network regulation are largely uncharacterized. In addition to amino acid sequence differences, isotypes are expressed at different levels according to cell type and developmental stage. Tuba1a is a class 1 α-tubulin that is conserved across vertebrates. Tuba1a is highly expressed in the brain during late embryonic development, and specifically enriched in post-mitotic neurons that extend long processes (Bamji and Miller, 1996; Gloster et al., 1994; Lewis et al., 1985). This specific expression pattern suggests that Tuba1a may be uniquely important for microtubule functions in newly born neurons; however, this model has been difficult to test directly because of the severe phenotypes of Tuba1a null mutants and the difficulty in isolating Tuba1a contributions in cells that express other α-tubulin isotypes.
The notion that tubulin isotypes may play specific roles during neural development is supported by the identification of isotype-specific mutations that are linked to neural development disorders. Mutations in Tuba1a, along with mutations in several other tubulin isotypes, have been implicated in a spectrum of brain malformations in humans that are known as ‘tubulinopathies’ (Bahi-Buisson et al., 2008; Breuss et al., 2012; Jaglin et al., 2009; Keays et al., 2007; Poirier et al., 2007; Poirier et al., 2013). 42.5% of reported tubulinopathies are linked to de novo heterozygous missense mutations in Tuba1a (Bahi-Buisson et al., 2014). These cases present a spectrum of cortical dysgenesis phenotypes that are often accompanied by motor impairment, abnormal muscle tone, epilepsy, and cognitive deficits (Bahi-Buisson et al., 2014). In addition, a subset of cases exhibits severe defects -- microlissencephaly, corpus callosum agenesis, and brain dysgenesis (Fallet-Bianco et al., 2014). Although these data indicate unique requirements for Tuba1a during neural development, the molecular basis of the pathology is not understood. How mutations in Tuba1a alter α-tubulin function and how this leads to the defects at the level of neurons are important questions.
To address these questions, we examined a novel loss of function mutation in Tuba1a, which we identified through a forward genetic screen in mice. Our results demonstrate important roles for Tuba1a during the development of the brain and motor neurons, including motor neuron extension and synapse function. To gain direct insight into how the Tuba1a mutation affects the function of α-tubulin, we combined molecular simulations with experiments in budding yeast, where we created analogous α-tubulin mutations. The results of these approaches provide a molecular explanation for how the mutation alters α-tubulin function and implicate tubulin biogenesis pathways in mitigating the consequences of tubulin defects.
Materials and Methods
Study approval
All animal experiments were conducted in accordance with the protocols described in the Guide for the Care and Use of Laboratory Animals (NIH, Revised 2011).
Forward genetic screen and identification of the Tuba1a mutation
ENU mutagenesis screens were performed as described (Hanson et al., 2014; Hanson et al., 2015). ENU mutagenesis was performed (Kasarskis et al., 1998) on males of C57BL/6J background and then outcrossed onto 129S1/Svlmj background to score generation 3 (G3) embryos at embryonic day 18.5 for recessive mutations that affect embryonic locomotion. Embryos from G3 and further outcrossed generations were used for meiotic mapping, which followed linkage between the non-motile phenotype and C57BL/6J markers. The genetic region containing the mutation that affected locomotion was first mapped to the proximal third of chromosome 15 using a panel of 96 MIT and SKI SSLP markers and then narrowed to a 2 Mb region by the use of additional MIT SSLP markers for chromosome 15. Genes within this 2 Mb region were sequenced and a homozygous variant was identified in the Tuba1a gene, resulting in a single base substitution (A to G) that introduces a N102D non-synonymous amino acid change. DNA from phenotypic mutant embryos (n=2) was sent to the Broad Institute to confirm the identity of the homozygous variant and this identified only 1 candidate homozygous variant in the Tuba1a gene (181 reads). Two other tubulin genes lie nearby on chromosome 15 (Tuba1b and Tuba1c) and therefore we used Ensembl Genome Browser (ensembl.org) combined with whole exome capture data analysis to examine these and other tubulin genes and genes involved in microtubule function, yet no homozygous variants in exon sequences were found, other than the Tuba1a mutation. To confirm the mutation in Tuba1a, genomic DNA in overlapping segments of the Tuba1a gene was amplified by PCR and subjected to Sanger sequencing from phenotypic E18.5 embryos and compared with control E18.5 C57Bl/6J DNA. Subsequently, embryos were genotyped as follows: Tissue was placed in tail lysis buffer (100 mM Tris.Cl pH8.0, 5 mM EDTA, 0.2% SDS, 200 mM NaCl) overnight. DNA was amplified using Taqman Gold (Applied Biosystems, Life Technologies, Carlsbad,CA) with primer sets to Tuba1a (forward primer: CCAGATGCCAAGTGACAAGA; reverse primer: GGGAGCCATATTTGCTTGATAGA). PCR amplification was performed for 35 cycles at 55°C. PCR products were sent to Barbara Davis Center Molecular Biology Service Center at the University of Colorado Denver for sequencing. The official nomenclature of this mutant allele is Tuba1am1Nisw, but for simplicity we used Tuba1aND throughout the manuscript. All of the data presented here were obtained after outcrossing > 12 generations onto 129S1/Svlmj background.
Mouse embryonic locomotor screen: touch assay
The touch assay was designed to examine mouse embryonic spinal locomotor response from the activation of the muscle spindles that carry signals to the dorsal root ganglion, to the interneuron relays between the dorsal root ganglion and motoneurons, and the motoneuron activation of the muscle to induce a contraction. Embryos were dissected from timed pregnant dams and placed in room temperature oxygenated Tyrode's solution. To induce limb movement, the foot-pads were pinched with tweezers. For example in E18.5 wildtype embryos, pinching induces paw retraction and cross-extensor reflexes. Both forelimbs and hindlimbs were assayed and retraction of the limb was scored as 1, no retraction of limb was scored as 0 and slow or modest retraction of limb was scored as 0.5. We also scored for S-shaped movements controlled by the trunk axial muscles by touching the forceps to the dorsal rib cage, near the spinal column, so that the assay is not biased for long axons that have extended far from the spinal column. Touch assay was performed on all embryos in the litter to identify phenotypic embryos. The genotype of all embryos was confirmed as above.
Motor neuron explant assay
This method is described in greater detail in Wang and Marquardt (Wang and Marquardt, 2012). Embryos from a cross of Tuba1aND/+:Mnx1-eGFP (Wichterle et al., 2002); B6.Cg-Tg(Hlxb9-GFP)1Tmj/J) male and female mice were harvested at E12.5, the embryonic head and tail were removed and the trunk pinned dorsal side up at the level of the forelimbs and hindlimbs using insect pins (0.1mm, Fine Science Tools) on a silicone dish (Sylgard from Dow Corning) containing calcium-free and magnesium free Dulbecco's phosphate buffer (Life Technologies). The spinal cord was opened at the dorsal midline and then separated from the meninges and connective tissue with fine forceps and removed from the spinal column. The spinal cord was pinned ventral side up and imaged with a fluorescent microscope (Discovery V.12 (Zeiss) to identify the ventral quadrant containing the eGFP-positive motor neurons. This region was carefully dissected and placed in fresh calcium-free and magnesium free Dulbecco's phosphate buffer. Fragments of the ventral spinal cord were diced and placed on poly-d-lysine (PDL, cat. no. A-003-E, Millipore, Billerica, MA) and laminin (cat. no. 23017-015, Invitrogen, Life Technologies, Carlsbad, CA) coated coverslips. Cultures were incubated at 37°C, 5% CO2 in Neurobasal medium (Invitrogen) with additional serum-free supplement (50×, B-27; Invitrogen), L-glutamic acid (Sigma-Aldrich, St Louis, MO), L-glutamine (Invitrogen) and penicillin-streptomycin (Invitrogen, cat. no. 15140-122) for two days before drug treatment and/or fixing and staining.
Histochemistry and drug treatment
Brains from E18.5 embryos were quickly removed from the skull and fixed in 4% paraformaldehyde (EM Sciences, Hatfield, PA) overnight at 4°C. Whole brains were either placed in Hoechst 33342 to visualize the external morphology by fluorescence microscopy or embedded in OCT compound (Tissue-Tek; Sakura Finetek USA) for cryosectioning. After sectioning (50 μm) and mounting on Superfrost plus slides, the tissue sections were stained with hematoxylin and eosin (H&E stain) using standard laboratory methods. Spinal cord explant cultures were incubated for 48 hrs prior to phalloidin treatment and/or fixation. All explant cultures were fixed in situ in 4% paraformaldehyde to preserve morphology on glass coverslips. For detection of post-translationally modified a-tubulin, motor neuron explant cultures were simultaneously labeled with a rat monoclonal antibody to tyrosinated a-tubulin (YL 1/2; Chemicon, Temecula, CA) at 1:1000 and a mouse monoclonal antibody to acetylated a-tubulin (6-11B-1; Sigma) at 1:1000. Cultures were then simultaneously incubated with Cy2 donkey anti-rat and Cy5 donkey anti-mouse secondary antibodies, both at 1:200 (Jackson ImmunoResearch, West Grove, PA) mounted in 80% glycerol and PBS. The distribution of tyrosinated microtubules in relation to acetylated microtubules was quantified using Image J. For experiments related to Figure 4L-R, the explant cultures were fixed for 15 min in 4% paraformaldehyde in Krebs’ buffer with 0.4 M sucrose to preserve F-actin (Dent and Meiri, 1992). These neurons were stained for F-actin by incubating the cultures with 0.33 mM Alexa 568-phalloidin (Molecular Probes, Life Technologies, Carlsbad, CA) for 1 hr. For experiments related to Figure 4S-V, the explant cultures were treated with 0.1% DMSO/0.10 mM phalloidin for 1 hour at 37°C, prior to fixation in PBS. Cultures were then mounted on Superfrost slides in 80% glycerol and PBS..
Figure 4. Cytoskeletal defects in Tuba1aND/ND motor neurons.
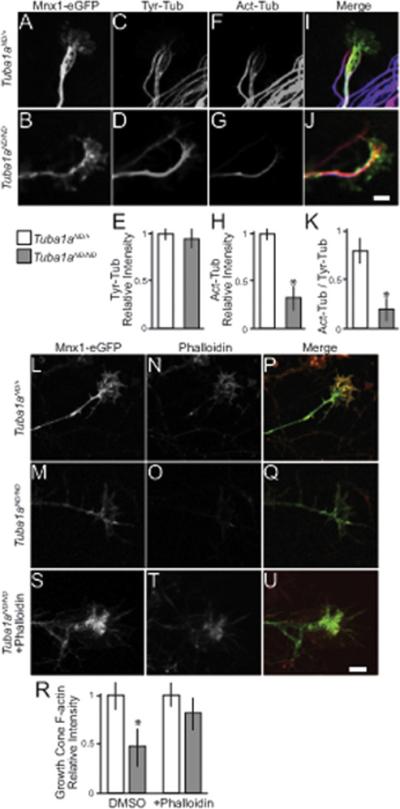
Fixed Mnx1-eGFP labeled motor neuron growth cones from spinal cord explants. (A-D) Tuba1aND/+ and Tuba1aND/ND growth cones labeled with Mnx1-eGFP and stained for tyrosinated tubulin (Tyr-tub). (E) Quantification of relative growth cone Tyr-tub intensity. Values are mean intensities from 28 Tuba1aND/+ growth cones and 31 Tuba1aND/ND growth cones. (F-G) Growth cone stained for acetylated tubulin (Act-tub). (H) Quantification of relative growth cone Act-tub intensity. Values are mean intensities from 28 Tuba1aND/+ growth cones and 31 Tuba1aND/ND growth cones. Asterisks indicate significant difference, by t-test (p < 0.05). (I-J) Composite images of Mnx1-GFP (green), Tyr-Tub (red), and Act-Tub (blue). Scalebar = 2mm. (K) Ratio of Act-tub intensity to Tyr-tub intensity in Tuba1aND/+ and Tuba1aND/ND growth cones. (L-Q) Tuba1aND/+ and Tuba1aND/ND growth cones labeled with Mnx1-eGFP and stained with phalloidin to reveal F-actin. (R) Relative intensity of F-actin in Tuba1aND/+ and Tuba1aND/ND growth cones. 35 Tuba1aND/+ and 39 Tuba1aND/ND growth cones were measured in DMSO conditions, and 28 Tuba1aND/+ and 33 Tuba1aND/ND growth cones were measured in after pre-treatment with phalloidin. Plotted values are mean intensities. (S-U) Tuba1aND/ND growth cone treated with bath application of phalloidin prior to fixation labeled with Mnx1-eGFP and phalloidin. Scalebar = 2mm.
Axial and limb motor neurons were examined in whole embryos that were pinned flat and fixed overnight in 4% paraformaldehyde. Diaphragms from E18.5 embryos from crosses of Tuba1am1Nisw/+:Mnx1-eGFP male and female mice were fixed and visualized as described in Hanson and Niswander (Hanson and Niswander, 2014). Diaphragms were dissected and pinned to sylgard dish in 4% paraformaldehyde for 10 min, then permeabilized with 0.2% Triton/PBS for 30 min. Non-specific reactivity was blocked with 2% BSA/PBS for 2 hours. For visualization of the postsynaptic structures, Acetylcholine Receptors (AChRs) were detected using α-Bungarotoxin conjugated Alexa 555 (1:500) without permeabilization to allow detection of AChRs at the membrane.
Confocal microscopy
Immunostained samples were examined by confocal laser scanning microscopy using a Zeiss LSM 510. Explants were visualized from the field of view (x63). For diaphragms, an area of 1mm2 was selected from the field of view (x10). Alexa-Fluor 568 was excited at 543-nm by a HeNe laser line (1 milliwatt maximum output, operated at 100%), directed via a 488/543 nm dual dichroic mirror. Emitted fluorescence was directed to a photomultiplier with a 560-nm long-pass filter. Confocal fluorescence intensity data were recorded as the average of four line scans per pixel and digitized at 8-bits, with photomultiplier gain adjusted such that maximum pixel intensities were <70% saturated.
Quantification
Nerve outgrowth was measured from the base of the spinal cord to the end of furthest axon. Growth cone intensity was measured by outlining the region of interest, which encapsulates the entire growth cone. The ventral quadrant of the diaphragm shows a high degree of reproducibility in AChR cluster distribution and hence was used for Figure 5. Zen 2009 software (Zeiss, Germany) was used to calculate the size of the AChR clusters using compressed z stack images.
Figure 5. Defects in Tuba1aND/ND neuromuscular endplates.
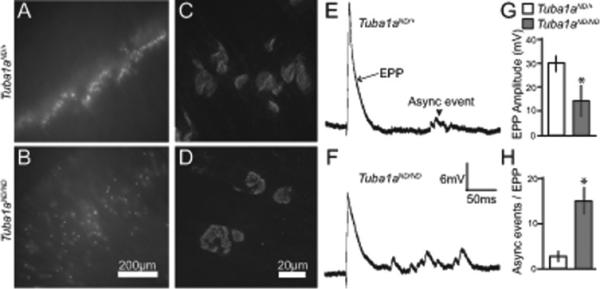
(A,B) a-bungarotoxin-alexa555 labeled post-synaptic endplates from Tuba1aND/+ and Tuba1aND/ND diaphragms reveals synapse patterning defect in Tuba1aND/ND. Scalebar = 200 μm. (C,D) Higher magnification of abungarotoxin-alexa555 labeled post-synaptic endplates from Tuba1aND/+ and Tuba1aND/ND diaphragms. Scalebar = 20 μm. (E,F) Examples of sharp electrode recordings of Tuba1aND/+ and Tuba1aND/ND diaphragms. Endplate potential (EPP) labeled by black arrow. Asynchronous event (asynch event) is labeled with black arrowhead. (G) Quantification of EPP amplitude in Tuba1aND/+ and Tuba1aND/ND diaphragms. Values are the mean from 22 EPPs from 5 Tuba1aND/+ diaphragms, and 26 EPPs from 5 Tuba1aND/ND diaphragms. Asterisks indicate significant difference, by t-test (p < 0.05). (H) Quantification of asynchronous events during a 30 s period after evoked EPP. Values are the mean from 20 measurements from 5 Tuba1aND/+ diaphragms, and 23 measurements from 5 Tuba1aND/ND diaphragms. Asterisks indicate significant difference, by t-test (p < 0.05).
Electrode recordings
Sharp electrode recordings were performed as described (Hanson et al., 2014; Plomp et al., 1992). E18.5 diaphragms were dissected and kept at room temperature in Normal Ringers solution. Diaphragm muscle fibers were impaled with a glass capillary microelectrode (30 MΩ resistance) made using a P-97 microelectrode puller (Sutter Instruments, Novata, CA) and filled with 3 M KCl (Brown et al., 2008). Evoked responses were elicited by a 0.2-ms maximal stimulus applied to the phrenic nerve using a suction electrode and pulse generator (STG 1002, ALA Scientific Instruments, Farmingdale, NY). Evoked endplate potentials (eEPP) were recorded using an Axoclamp-2A amplifier (Molecular Devices, Sunnyvale, CA) and DigiData 1322A (Molecular Devices). Muscle fiber membrane potentials were adjusted to Em= −70 mV under current clamp. Data was extracted and analyzed with Axoscope 10 software (Molecular Devices).
Statistical analysis
The unpaired two-tailed Student's t test was used to compare means for statistical differences. Data in the manuscript are represented as mean ± SEM unless otherwise indicated. P < 0.05 was considered significant.
Yeast genetics
General yeast manipulation, media and transformation were performed by standard methods (Amberg, 2005). Strains are listed in Supplemental Table 1. Bik1-3GFP integrating plasmid was a gift from Dr. David Pellman (Harvard University). Mutant alleles of TUB1 and TUB3 were generated at the endogenous chromosomal loci using the methods of Toulmay and Schneiter (Toulmay and Schneiter, 2006). A selectable marker was integrated at each locus, following the 3'UTR. Regions containing coding sequence, UTR, and marker were then amplified using mutagenic oligos, and transformed into a wild-type strain background. Mutations were confirmed by sequencing genomic loci.
Western blots of α-tubulin levels
Cells were grown to log phase at 30°C in 5ml YPD, then pelleted, washed once, and lysed in NP40 buffer by bead beating. The total protein concentration of the clarified lysate was determined by Bradford assay, and all samples were normalized. Samples were run on 10% SDS PAGE, transferred to nitrocellulose membrane, and blocked overnight at 4°C. Membranes were probed with mouse-anti-α-tubulin (4A1; @ 1:100; (Piperno and Fuller, 1985)) and rabbit-anti-Zwf1 (Sigma A9521; @ 1:10,000), followed by goat-anti-mouse-680 (LI-COR 926-68070, Superior, NE; @ 1:15000) and goat-anti-rabbit-800 (LI-COR 926-32211; @ 1:15000), and imaged on an Odyssey Imager (LI-COR Biosciences). Band intensities were quantified using ImageJ.
RT-PCR
We isolated RNA from wild type, tub3Δ, tub1-ND, and tub1/3-ND strains and reverse transcribed using Superscript III first strand synthesis system for RT-PCR (Invitrogen). TUB1, TUB2, and TUB3 cDNA was quantified using LightCycler 480 SYBR Green I Master (Roche Germany) on the Roche LC480. To normalize samples, we used actin and pgk1 as reference genes and took the geometric mean of their Ct values. We included no reverse transcription and no cDNA controls for every primer pair. These resulted in no amplification. We included three replicates for every reaction.
We analyzed quantitative RT PCR using the 2 −ΔΔCT method (Schmittgen and Livak, 2008). To calculate p values for significance of expression differences, we compared wild type ΔCT values (CTtarget gene – geometric mean of Ct values of reference genes) to ΔCT of each genotype in a pairwise two tailed T-test (Yuan et al., 2006).
Microtubule polymerization and dynamics
Timelapse images of Bik1-3GFP were collected on a confocal microscope. Living cells from asynchronous cultures grown to early log phase were suspended in nonfluorescent medium, mounted on coverslips coated with concanavalin A (2mg/mL; Sigma #C2010), and sealed with VALAP (vasoline:lanolin:paraffin at 1:1:1). During acquisition, the temperature of the stage was maintained at 30°C. Z series of 13 images separated by 450nm were collected at 4 second intervals on a Nikon Ti-E microscope equipped with a 1.45 NA 100× CFI Plan Apo objective, piezo electric stage (Physik Instrumente, Auburn, MA), spinning disc confocal scanner unit (CSU10; Yokogawa), a 488-nm laser (Agilent Technologies, Santa Clara, CA), and an EMCCD camera (iXon Ultra 897; Andor Technology, Belfast, UK) using NIS Elements software (Nikon). The distance between Bik1-3GFP foci at astral microtubule plus ends and spindle poles for each timepoint was measured in ImageJ. Values reported in Figure 7 are from at least 30 microtubules imaged over 5 minutes. Polymerization and depolymerization events were defined by a line with an R2 value of ≥0.85 and a net change in length of ≥0.5 μm. Catastrophes were defined as transitions to shrinkage after polymerization or pause; rescues were defined as transitions to growth after depolymerization or pause. The frequencies of catastrophe and rescue were calculated by dividing the total number of events by the total time spent pausing and growing or pausing and shrinking, respectively.
Figure 7. ND mutation disrupts microtubule assembly.
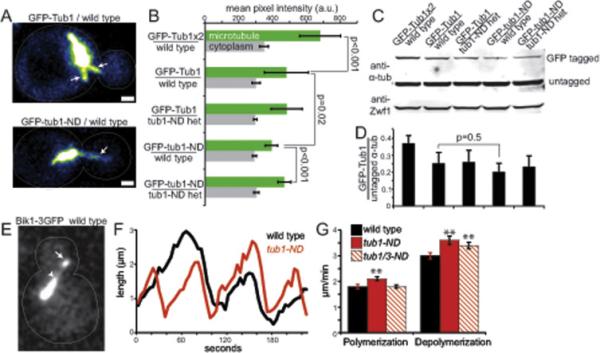
(A) Images of microtubules labeled with wild-type GFP-Tub1 or GFP-tub1-ND. Arrows point to astral microtubules. Scalebar = 1μm. (B) Quantification of GFP signal per micron of astral microtubule (green). At least 12 microtubules were measured for each strain. Gray bars are average GFP signal per micron of cytoplasm. Error bars are SD. Strains: GFP-Tub1x2/WT, yJM1336, 1337; GFP-Tub1/WT yJM1338, 1339; GFPTub1/tub1-N103D het, yJM1340, 1341; GFP-tub1-N103D/WT, yJM1346, 1347; GFP-tub1-N103D/tub1-N103D het, yJM1348, 1349. (C) Western blot of a-tubulin in lysates from strains in B. Zwf1/G6PD is a loading control. (D) Densitometry analysis showing the ratio of GFP-tagged α-tubulin to untagged α-tubulin in each strain. Values are the mean of ratios from 2 separate experiments. Error bars are SD. (E) Image of a wild-type cell expressing Bik1-3GFP. Arrow points to astral microtubule plus end. Arrowhead points to minus end. (F) Representative lifeplots of astral microtubule dynamics in wild type and tub1-ND mutants. Astral microtubule length was measured over time by plotting the distance between plus-end associated Bik1-3GFP and the minus end, at the proximal spindle pole. (G) Mean polymerization and depolymerization rates. Error bars are SEM. Double asterisks indicates significant difference compared to wild type, by t-test (p < 0.01). Strains: wild type, yJM0313, yJM0314; tub1-ND, yJM1671, 1673; tub1-ND tub3-ND, yJM1672.
To measure GFP-Tub1 incorporation, 23 Z sections separate by 300 nm were collected on the confocal microscope. Single astral microtubules were identified in maximum intensity projections of Z-series, and pixel intensities were measured along these microtubules using the plot profile feature of ImageJ (Wayne Rasband, NIH). To avoid signal differences introduced by additional microtubules near the SPB, we only measured pixel values at the distal ends of microtubules, within 1μm of the plus end. To measure signal in the cytoplasm, we used a similar technique but measured a region of the cell adjacent to the microtubule.
Yeast growth assays
Cells with wild-type (wt) or mutant alleles at endogenous TUB1 and TUB3 loci were grown to saturation at 30°C in rich media and a 10-fold dilution series of each was spotted to either YPD or YPD supplemented with 10μg/mL benomyl (Sigma, #381586). YPD plates were grown at 30°C for 2 days or 12°C for 17 days. Benomyl plates were grown at 30°C for 2 days.
For overexpression analysis, liquid cultures of cells carrying high-copy 2μ plasmids with indicated genes under galactose-inducible promoters were grown to saturation in media selective for plasmid retention and containing 2% glucose to inhibit expression. 10-fold dilution series were spotted to media selective for plasmid retention and containing either 2% galactose and 2% raffinose to induce expression or 2% glucose to inhibit expression, and plates were grown at 30°C for 3 days.
Molecular dynamics simulations and analysis
Molecular dynamics (MD) simulations were performed using NAMD (Phillips et al., 2005). Both the wild-type and aN102D mutant heterodimers were prepared with GDP in the b-subunit and GTP in the a-subunit. The systems were solvated with TIP3P water and counterions were added to reach an ionic strength of 50 mM. Following about 20 ns of equilibration, 100 ns MD simulations were carried out under in isothermal-isobaric (NpT) ensemble with a pressure of 1 atm and temperature of 300 K. The AMBER-99SB force field was used with a 10 Å cut off for van der Waals with an 8.5 Å switching distance, and Particle Mesh Ewald for long-range electrostatics. The simulations were post-processed using the MMPBSA tool from AMBER (Miller et al., 2012). The binding free energy of each dimer was determined using the Generalized Born model (GBSA) and the quasi-harmonic entropy approximation. Using just the proteins or the full tubulin monomers (with nucleotide and Mg2+) in these calculations gave almost identical results.
Results
Forward genetic screen for locomotor defects identifies a mutation in Tuba1a
Through a chemically induced mutagenesis screen in mice for defects in locomotor movements (see Materials and Methods), we identified a recessive mutation in which homozygous mutant embryos display a loss of limb movement first observed at embryonic day 14.5 (E14.5), while l movement of the trunk controlled by the axial muscles persisted throughout embryonic development (Figure 1A). At E18.5, homozygous mutant embryos showed no complex or coordinated movement in the limbs and presented an uncharacteristic posture with the arms extended and back hunched (Figure 1B). At birth, all homozygous mutant mice show an inability to breathe and they become cyanotic and die shortly thereafter. To determine the genetic mutation, we used meiotic mapping, whole exome enrichment, and next generation sequencing (NGS) and identified a homozygous point mutation in a-tubulin 1a (Tuba1a) gene on chromosome 15 in all embryos from this line with locomotor deficits. A single A to G nucleotide change creates a non-synonymous missense mutation in codon 102, which replaces the native asparagine residue with aspartic acid. The asparagine residue is highly conserved in α-tubulin isotypes across species (Figure 1C). Residue 102 sits close to the α-β interface within the tubulin heterodimer, 4.5Å from β-tubulin and 7Å from the non-exchangable GTP binding site (the N-site; Figure 1D). Furthermore, it is immediately adjacent to the Mg2+ binding site (Lowe et al., 2001). The mutant line is called Tuba1am1Nisw, for simplicity we refer to it here as Tuba1aND. No other microtubule protein showed a homozygous or heterozygous variant by whole exome enrichment and next-generation sequencing. Thus, our genetic screen identified a mutation in Tuba1a that results in locomotor defects during embryonic development and lethality at birth.
Figure 1. Identification of Tuba1aND/ND mouse model.
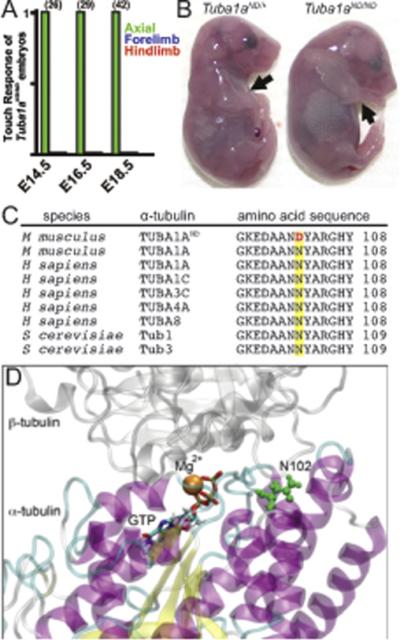
(A) Touch assay to examine movement at embryonic days E14.5 (n=26 embryos), E16.5 (n=29), and E18.5 (n=42) of mouse development shows loss of locomotor movement in Tuba1aND/ND mutants. (B) Morphology of E18.5 littermates. Tuba1aND/ND mice have extended hindlimbs and forelimbs (black arrows) and a hunched back. (C) Asparagine residue 102 in a conserved region of α-tubulin is mutated to an aspartic acid (red letter) in Tuba1aND/ND mice. (D) Location of N102 (green residue) in the tubulin intradimer interface. N102 resides near the GTP N-site and Mg2+ binding site of α-tubulin.
Disease-like phenotype in Tuba1aND /ND embryos
Mutations in human α-1 tubulin produce lissencephaly and a dominant mutation in mouse Tuba1a induces cortical migration errors (Keays et al., 2007). In addition, a dominant human mutation at amino acid 101 (N101S) of TUBA1A, immediately adjacent to the N102D mutation described here, is linked to embryonic micro-lissencephaly (Fallet-Bianco et al., 2014). Due to the smooth morphology of the mouse cortex, lissencephaly cannot be distinguished in mice. Instead, we determined whether Tuba1aND mice exhibit other phenotypes reminiscent of tubulinopathies. At E18.5, brains from Tuba1aND/ND homozygotes were smaller and showed brain malformations in the olfactory bulb, cortex, and hindbrain, compared to brains from Tuba1aND/+ (Figure 2A and B). Examination of sagital sections shows obvious defects in all brain structures in the Tuba1aND/ND brain compared to Tuba1aND/+ brains (Figure 2C and D). These include defective cortical layering in the cerebral cortex (Figure 2E and F), malformation of the hippocampus and corpus callosum (Figure 2G and H), and malformation of the hindbrain (Figure 2I and J). These data show that the N102D mutation in Tuba1a induces brain malformations and cortical layering errors reminiscent of human tubulinopathies.
Figure 2. Tuba1aND/ND brains have hallmarks of tubulinopathy.
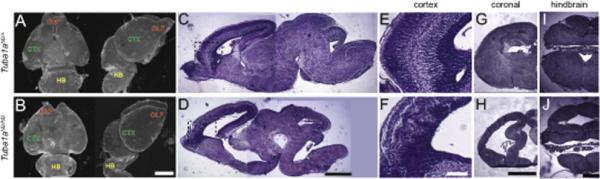
(A,B) Hoechst staining of E18.5 Tuba1aND/+ and Tuba1aND/ND whole brains. (OLF, Olfactory bulb; CTX, Cortex; HB, Hindbrain). Scalebar = 1000μm. (C,D) Cross section of H&E stained E18.5 Tuba1aND/+ and Tuba1aND/ND brains. Scalebar = 1000μm. (E,F) Higher magnification of cortex from panel (C) and (D) to demonstrate cortical layering in Tuba1aND/+ and Tuba1aND/ND, respectively. Scalebar = 200μm. (G,H) H&E stained coronal plane from Tuba1aND/+ and Tuba1aND/ND embyros show hippocampus and midbrain impairment in Tuba1aND/ND. Scalebar = 200μm. (I,J) H&E stained cross sections of the hindbrain in Tuba1aND/+ and Tuba1aND/ND embryos. Scalebar = 500μm.
Axon extension errors in Tuba1aND/ND mutants
To investigate the basis of the locomotor defect, we mated the Tuba1aND/+ mice to mice expressing the motor neuron reporter, Mnx1-eGFP (Wichterle et al., 2002). Further crossing generated homozygous mutant embryos and controls that express eGFP in motor neurons to allow an examination of motor neuron morphology during late fetal development (E14.5 and E18.5). First we examined axial motor neurons, which do not require complex branching to innervate the target trunk muscles. At E14.5, Tuba1aND/+ motor neurons are fully extended across the entire intercostal muscles between the ribs (Figure 3A). In contrast, Tuba1aND/ND motor axons have not fully extended through the intercostals at E14.5 and there are strong regions of eGFP expression where the motor neurons exit from the spinal cord (Figure 3B and C). However, by E18.5, Tuba1aND/ND axons have completely extended across the intercostals, and appear similar to Tuba1aND/+.
Figure 3. Tuba1aND/ND embryos have defects in motor axon outgrowth.
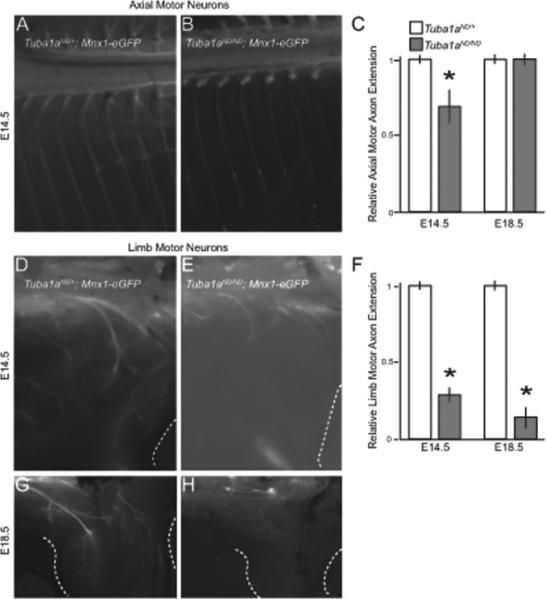
(A,B) Axial motor neuron axon extension from the spinal cord in E14.5 Tuba1aND/+ and Tuba1aND/ND embryos expressing Mnx1-eGFP. (C) Quantification of axial motor axon extension in E14.5 and E18.5 Tuba1aND/+ and Tuba1aND/ND embryos. Asterisks indicate significant difference, by t-test (p < 0.05). (D,E) Limb motor neuron axon extension into the distal limb in E14.5 Tuba1aND/+ and Tuba1aND/ND embryos. (F) Quantification of limb motor axon extension in Tuba1aND/+ and Tuba1aND/ND embryos at E14.5 and E18.5. (G,H) Limb motor axon extension at E18.5 in Tuba1aND/+ and Tuba1aND/ND embryos.
Next, we examined E14.5 and E18.5 limb motor axons, which undergo branching to innervate target muscles. Although motor neurons appear fasciculated at the base of the E14.5 hindlimb in Tuba1aND/ND embryos, motor axons fail to extend beyond the proximal muscles of the limb compared to Tuba1aND/+ littermates (Figure 3D-F). At E18.5, Tuba1aND/ND eGFP labeled axons were still only present at these proximal limb muscles, suggesting that limb motor axons failed to extend to correct target muscles (Figure 3F-H). These data suggest that Tuba1aND/ND peripheral axons have defects in axon extension to distant target muscles.
Cytoskeletal defects in Tuba1aND/ND motor neurons
To examine the cytoskeleton in Tuba1aND/ND motor neurons, we cultured explants from the ventral quadrant of the spinal cord, which are enriched for Mnx1-eGFP positive motor neurons. First, we examined the microtubule network by assessing posttranslational modifications of tubulin proteins that correlate with microtubule stability. α-tubulin includes a genetically encoded tyrosine at the very carboxy terminus, which is proteolytically removed (‘de-tyrosinated’) after polymerization into microtubules (Prota et al., 2013; Szyk et al., 2011). Polymerized tubulin is also modified by acetylation, and the abundance of acetylation correlates with the stability of the microtubule (Piperno and Fuller, 1985; Szyk et al., 2014; Webster and Borisy, 1989). Therefore, ‘tyrosinated’ tubulin represents tubulin that is either soluble or newly polymerized, while acetylated tubulin represents stable microtubule polymer. Consistent with this, tyrosinated tubulin is found in the distal ends of the growth cone, while the proximal growth cone contains more stable (t1/2=1.5-2hrs) acetylated form (Baas and Black, 1990; Black et al., 1989; Brown et al., 1993; Webster et al., 1987). The abundance of tyrosinated tubulin in the distal ends of growth cones of Tuba1aND/+ and Tuba1aND/ND motor neurons appears indistinguishable (Figure 4A-E). In contrast, Tuba1aND/+ motor neurons show significantly greater enrichment of acetylated tubulin in the central and proximal regions of growth cones, compared to Tuba1aND/ND (Figure 4F-K). These results suggest that the α-tubulin mutation causes the Tuba1aND/ND microtubules to be less stable during motor axon extension.
Motor axon extension depends on crosstalk between the microtubule and actin cytoskeletons; therefore, we predicted that Tuba1aND/ND growth cones might also exhibit actin polymerization defects. We stained explants with fluorescently labeled phalloidin to identify polymerized actin filaments (F-actin) in motor neuron axons and growth cones, and focused on Mnx1-eGFP positive motor neurons for analysis. Tuba1aND/ND axons show decreased F-actin labeling at the growth cone compared to Tuba1aND/+ axons (Figure 4L-R). To determine whether the decreased F-actin labeling was due to decreased concentrations of actin or decreased actin polymerization, explant cultures were bathed in phallodin for 1 hour prior to fixation to induce F-actin stabilization. Phallodin-treated Tuba1aND/ND axons showed a robust presence of F-actin, similar to Tuba1aND/+ axons, suggesting that Tuba1aND/ND axons have decreased actin polymerization, not decreased actin concentration (Figure 4S-U, R).
Defects in Tuba1aND/ND neuromuscular junctions and synaptic activity
Next we examined whether microtubule defects in motor axon growth cones coincide with defects in synapse stability. Although most Tuba1aND/ND motor axons do not innervate the correct target muscle, Tuba1aND/ND phrenic nerve motor axons extend to the diaphragm muscle by E18.5. In Tuba1aND/ND diaphragms, post-synaptic structures are dispersed compared to Tuba1aND/+ diaphragms (Figure 5A, B). Moreover, the post-synaptic structures in Tuba1aND/ND diaphragms vary widely in shape and size and lack a disk shape appearance compared to the characteristic “disk” shape Tuba1aND/+ E18.5 embryos (Figure 5C, D; average endplate area is 90 ± 30 μm2 in Tuba1aND/ND versus 70 ± 5 μm2 in Tuba1aND/+).
To assess the function of post-synaptic structures in the Tuba1aND/ND embryos, we performed electrophysiological analysis on E18.5 diaphragm muscle. Evoked endplate potentials (eEPPs) were induced in response to electrical stimulation of the phrenic nerve and this showed amplitudes of eEPPs that were similar between wild-type control (31.58 ± 4.87 mV, n = 25 cells and 4 embryos) and Tuba1aND/+ muscles (33.12 ± 5.11 mV, n = 25 cells and 4 embryos; Figure 5G) of the nerve. Notably, in Tuba1aND/ND diaphragm muscle, stimulation induced a significantly smaller eEPPs (n = 30 cells and 4 embryos; Figure 5G and H). Interestingly, asynchronous event potentials after stimulation increased more than 5-fold in Tuba1aND/ND muscles (16.49 ± 3.55, n = 21 cells, n = 5 embryos, recorded for 30 sec after stimulation) compared with Tuba1aND/+ littermates (2.89 ± 0.92, n = 20 cells, n = 5 embryos; p< 0.005; Figure 5I). These data indicate that the function of the post-synaptic structures is disrupted in Tuba1aND/ND embryos.
ND mutation disrupts α-tubulin stability
To directly test the effect of the ND mutation on α-tubulin function, we generated analogous mutations in the two budding yeast α-tubulin isotypes TUB1, which encodes the major α-tubulin isotype, and TUB3. Whereas null mutations in TUB1 are lethal, null mutations in the minor isotype TUB3 cause only mild microtubule phenotypes (Schatz et al., 1986). We mimicked the N102D mutation from mouse Tuba1a by creating substitution mutations at the analogous position (N103) in the native chromosomal loci of TUB1 and TUB3, creating tub1-ND and tub3-ND, and tested these mutations either alone or in combination (Figure 1C).
We first tested ND mutant cells in growth assays that assess microtubule function. Under optimal conditions (rich media, 30°C), mutants expressing tub1-ND and tub3-ND, either alone or in combination, are viable and grow normally (Figure 6A). However, ND mutants are extremely sensitive to the microtubule poison, benomyl (10μg/mL; Figure 6A). tub1-ND tub3-ND double mutants are the most sensitive to benomyl, followed by tub1-ND single mutants and tub3-ND single mutants. As a control, we tested a tub3Δ mutant; these cells exhibit benomyl sensitivity at a level that is similar to the tub1-ND mutant (Figure 6A). We tried to test the effect of combining tub1-ND with the tub3Δ knockout; however, all double mutants were inviable, indicating that the tub1-ND mutant is lethal in the absence of TUB3 (Table 1). We also tested the ND mutants for sensitivity to low temperature, which promotes microtubule depolymerization. Similar to the benomyl assay, we found that tub1-ND tub3-ND double mutants are hypersensitive to low temperature (rich media; 12°C), and tub1-ND single mutants are less severely affected (Figure 6A). Neither tub3-ND single mutants, nor tub3Δ controls are sensitive to low temperature (Figure 6A). These data demonstrate that in the tub1-ND single mutant, the remaining α-tubulin isotype becomes necessary to support microtubule function in yeast. These results are consistent with the ND alleles acting as loss of function mutants that destabilize microtubules.
Figure 6. ND mutation disrupts α-tubulin function in yeast.
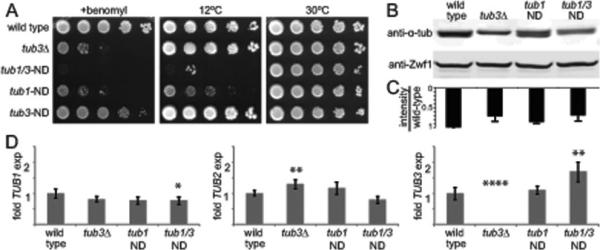
(A) Growth assay for ND mutants on rich media or rich media supplemented with the microtubule destabilizing drug benomyl (10μg/mL), and incubated at the indicated temperatures. (B) Western blot of α-tubulin protein in lysates from the indicated strains. Blots were also probed for Zwf1/G6PD as a loading control. (C) Densitometry of α-tubulin bands from 3 separate experiments. Error bars are SD. (D) Transcript levels of TUB1, TUB2 and TUB3 in wild-type and mutant strains, determined by quantitative RTPCR. Error bars are SD. Single asterisk indicates significant difference compared to wild type, by t-test (p < 0.05). Double asterisks indicates significant difference compared to wild type, by t-test (p < 0.01). Quadruple asterisks indicates significant difference compared to wild type, by t-test (p < 0.0001). Strains: wild type, yJM0597; tub3Δ, yJM0120; tub1-ND, yJM0680; tub1-ND tub3-ND, yJM0714.
Table 1.
Microtubule dynamics in ND mutant yeast
| Strain | Mean length (μm) |
Polym rate (μm/min) |
Polym duration (sec) |
Depolym Rate (μm/min) |
Depolym duration (sec) |
Rescue frequency (events/min) |
Catastrophe frequency (events/min) |
|---|---|---|---|---|---|---|---|
| Wild type | 1.1 ± 0.01 | 1.8 ± 0.1 | 43 ± 2 | 3.0 ± 0.1 | 28 ± 1 | 1.2 ± 0.08 | 0.9 ± 0.05 |
| tub1-ND | 1.1 ± 0.02 | 2.1 ± 0.1 | 36 ± 2 | 3.6 ± 0.2 | 24 ± 1 | 1.2 ± 0.11 | 1.1 ± 0.08 |
| tub1-ND tub3-ND | 1.1 ± 0.01 | 1.8 ± 0.1 | 44 ± 3 | 3.4 ± 0.1 | 26 ± 1 | 1.0 ± 0.1 | 0.8 ± 0.07 |
Polym, polymerization; depolym, depolymerization; μm, micron; min, minute; sec, second. Values are mean ± SEM of measurements from at least 32 microtubules in cells imaged for at least 240 seconds at 4 second intervals. Values in bold italics are significantly different from wild-type controls (p<0.05), based on a students t-test.
Next, we tested whether the ND mutation alters α-tubulin protein levels, using western blots probed with a monoclonal antibody raised against α-tubulin. In wild-type yeast cell lysate, we observed a single, broad band corresponding to the two α-tubulin isotypes (Figure 6B). Although we are not able to resolve Tub1 from Tub3 in wild-type lysate, lysate from tub3Δ knockout mutants reveals the slower-migrating Tub1 isotype and a ~30% decrease in total α-tubulin protein levels (Figure 6B and C). Interestingly, we resolved two α-tubulin bands in the tub1-ND single mutant lysate (Figure 6B). These bands each exhibit similar intensity, and together show a ~15% decrease in total α-tubulin protein, compared to wild type (Figure 6C). This change suggests that tub1-ND mutant isotype levels are similar to levels of the wild-type Tub3 isotype in tub1-ND single mutant cells (Figure 6B). Lysate from tub1-ND tub3-ND double mutant cells shows a single, broad band, and a ~30% decrease in total α-tubulin levels (Figure 6B and C). We also examined tubulin mRNA levels by quantitative RT-PCR. Levels of TUB1, TUB2, and TUB3 transcripts were not significantly different in tub1-ND mutants compared to wild type (Figure 6D). In the tub1/3-ND double mutant, TUB1 expression was slightly decreased, while TUB3 expression was increased (Figure 6D). As expected, no expression of TUB3 mRNA was detected in the tub3Δ strain, but expression of tub2 was increased in this strain (Figure 6D). We conclude that the ND mutation causes a change in the relative α-tubulin isotype at the protein level.
Polymerization defects
We designed a competition assay to measure the incorporation of tub1-ND mutant protein into microtubules, relative to wild-type α-tubulin. GFP was fused to the N-terminus of either tub1-ND or wild-type TUB1, between the native promoter and coding sequence, and these fusions were integrated at the chromosomal LEU2 locus. This allows for stable expression of GFP-tagged α-tubulin under the endogenous promoter in cells that also express untagged α-tubulin from the native TUB1 and TUB3 loci. We then compared the amount of GFP-tagged α-tubulin in a microtubule lattice by measuring GFP signal per unit length of individual microtubules and the amount in the cytoplasm by measuring a comparable region adjacent to microtubules (Figure 7A). In the process of setting up this experiment, we found that haploid cells expressing GFP-tub1-ND in combination with tub1-ND at the native locus are not viable; therefore, we conducted our experiments in diploid cells with either homozygous wild-type TUB1/TUB1 or heterozygous tub1-ND/TUB1 at the native loci. To validate our experimental approach, we first compared wild-type homozygotes expressing one or two integrated copies of GFP-Tub1. Cells expressing two copies of GFP-Tub1 exhibit significantly greater GFP signal per micron of lattice than cells expressing one copy of GFP-Tub1, indicating that more GFP-Tub1 is present in the lattice (p<0.001; Figure 7B). This is expected, based on the greater abundance of GFP-Tub1 protein in the cells with two copies (Figure 7C and D). We then measured the incorporation GFP-tub1-ND in wild-type homozygotes, and found significantly reduced GFP signal per micron of microtubule, compared to cells expressing wild-type GFP-Tub1 (p=0.02; Figure 7B). This suggests that less mutant protein is incorporated into the microtubule lattice. To further test our hypothesis, we asked whether the incorporation of GFP-tub1-ND improves in tub1-ND heterozygotes. Indeed, we found that GFP signal per micron of microtubule is increased when tub1-ND-GFP is expressed in tub1-ND heterozygotes, compared to wild-type homozygotes (Figure 7B). We conclude that the ND mutation impairs the incorporation of mutant α-tubulin into the microtubule lattice when in competition with wild-type tubulin.
The location of the ND mutation at the interface of α- and β-tubulin in the heterodimer may alter microtubule dynamics or stability. To test this hypothesis, we used an assay to measure microtubule dynamics in living cells. In this assay we tracked the plus ends of astral microtubules in yeast cells by imaging the CLIP-170 homologue Bik1, which we labeled with 3 copies of GFP to (Figure 7E). These microtubules alternate between phases of polymerization, where Bik1 foci move away from the spindle, and depolymerization, where Bik1 foci move toward the spindle (Figure 7F). In tub1-ND single mutant cells, we observed significantly faster rates of polymerization and depolymerization, compared to wild-type cells (Figure 7G; Table 1; p<0.01). In contrast, tub1-ND tub3-ND double mutants, which express only ND mutant α-tubulin, exhibit polymerization rates that are similar to wild type, but significantly faster depolymerization (Figure 7G; Table 1). We conclude that the ND mutant accelerates the rate of microtubule depolymerization, but only alters the rate of polymerization in cells that also express wild-type Tub3.
Heterodimer stability defects
The above results indicate that ND mutant α-tubulin is lost or not incorporated into the microtubule lattice, thus changing the balance of α-tubulin isotypes in microtubules. To investigate the mechanism of loss, we used a series of genetic experiments to test whether ND mutants depend on the function of the tubulin-binding cofactors (TBCs) that promote heterodimer formation (Figure 8A). TBCs are not essential in budding yeast, but TBC null mutants impair heterodimer biogenesis (Archer et al., 1995; Fleming et al., 2000; Hoyt et al., 1997; Stearns et al., 1990). We tested whether TBC null mutants exacerbate the effects of ND mutants. Indeed, double mutants combining the tub1-ND mutant with any TBC null mutant are lethal (Figure 8A; Table 2). In separate experiments, we found that double mutants combining tub1-ND with mutants in prefoldin, which functions upstream of TBCs in tubulin biogenesis, are also lethal (Figure 8A; Table 1; (Vainberg et al., 1998). Thus, cells require the proper function of the tubulin biogenesis pathway to ameliorate the effects of the ND mutant.
Figure 8. ND mutant disrupts the tubulin heterodimer.
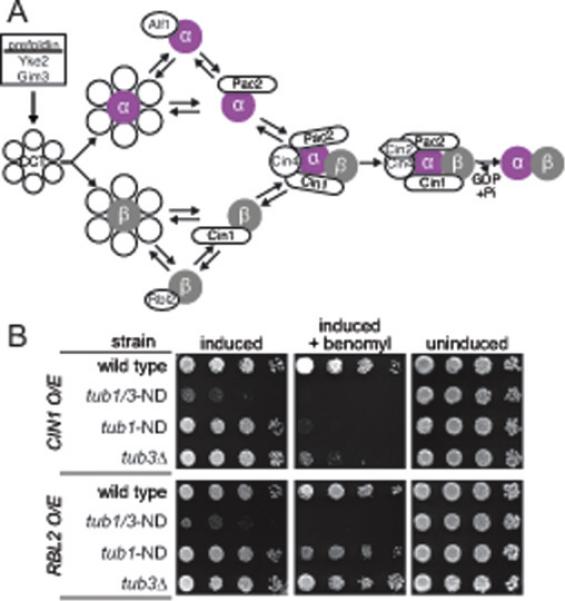
(A) Tubulin biogenesis pathway in yeast. Adapted from (Lewis et al., 1997; Nithianantham et al., 2015). (B) Overexpression analysis. Strains with indicated genotypes containing plasmids for overexpressing TBCD/CIN1 or TBCA/RBL2 were grown to saturation at 30°C in non-inducing media and a 10-fold dilution series of each was spotted to inducing media. Plates were grown at 30°C for 3 days. Strains: wild type, yJM0597; tub1-ND tub3-ND, yJM0714; tub3Δ, yJM0120.
Table 2.
Genetic interactions with tub1-ND mutant
| Mutant tested | Description | viable double mutants | Tetrads dissected | Comments | Parent strains |
|---|---|---|---|---|---|
| tub3 Δ | Minor α-tubulin | 0/25 | 32 | lethal | yJM680, 681, 120 |
| bim1 Δ | EB1 | 6/6 | 6 | viable | yJM 681, 663 |
| dyn1 Δ | Dynein heavy chain | 8/8 | 8 | viable | yJM 681, 594 |
| rbl2 Δ | TBCA | 2/15 | 10 | 13/15 inviable, 2/15 slow growing. | yJM 682, 814 |
| alf1 Δ | TBCB | 0/9 | 9 | lethal | yJM 682, 1087 |
| cin2 Δ | TBCC | 0/8 | 9 | lethal | yJM 682, 819 |
| cin1 Δ | TBCD | 0/10 | 10 | lethal | yJM 682, 817 |
| pac2 Δ | TBCE | 0/14 | 12 | lethal | yJM 682, 1088 |
| cin4 Δ | Arl2 homologue | 0/9 | 8 | lethal | yJM 682, 960 |
| yke2 Δ | Prefoldin | 0/9 | 11 | lethal | yJM 682, 813 |
| gim3 Δ | Prefoldin | 0/7 | 9 | lethal | yJM 682, 816 |
Genetic interactions were assayed in the meiotic progeny of heterozygous diploids, created by crossing the indicated parent strains. Viable double mutants are depicted as a ratio of the number of double mutants recovered over the number predicted, based on marker segregation. ‘Lethal’ denotes crosses that produced no viable double mutant progeny.
Because the ND mutation alters a residue at the intradimer interface (Figure 1D), we hypothesized that ND mutant heterodimers might be more vulnerable to disassembly. Heterodimer disassembly has been clearly demonstrated in vitro, where excess TBCD/Cin1 drives a reverse biogenesis reaction by binding to β-tubulin and dissolving the heterodimer (Tian et al., 1997). To test our hypothesis, we conditionally expressed high levels of TBCD/Cin1 using a galactose-inducible promoter. TBCD/Cin1 overexpression strongly inhibits the growth of tub1-ND tub3-ND double mutants (Figure 8B). tub1-ND single mutants are inhibited to a lesser extent, which is revealed in the presence of benomyl. Wild-type and tub3Δ control cells are not affected by overexpression of TBCD/Cin1. We also tested the effect of overexpressing TBCA/Rbl2, which binds to β-tubulin in the heterodimer and monomer forms (Archer et al., 1998). TBCA/Rbl2 overexpression strongly inhibits tub1-ND tub3-ND mutants, but slightly suppresses the benomyl sensitivity of tub1-ND single mutants (Figure 8B). We observed a similar suppression effect in tub3Δ controls, which has been previously documented and attributed to TBCA/Rbl2 sequestering the excess of β-tubulin monomer in the cell (Figure 8B; (Archer et al., 1995)). We found no effect for TBCA/Rbl2 overexpression in wild-type control cells.
In order to gain some molecular level insight into the effect of the ND mutation, we performed molecular dynamics simulations using the mammalian tubulin structures of both the wild-type and aN102D mutant. Free energy calculations on the structures from these simulations show that the aN102D mutation does destabilize the heterodimer, decreasing the overall binding free energy between a- and b-tubulin by an estimated 6.5 kcal/mol (ΔΔG ≃ 6.5 kcal/mol). The majority of this binding free energy change comes from a loss of enthalpy (ΔΔH ≃ 8 kcal/mol), but the mutation also leads to a slightly more flexible heterodimer with a more favorable entropy of binding (TΔΔS ≃ −1.5 kcal/mol). All of these results are consistent with impaired heterodimer stability in the ND mutant.
Discussion
Our identification of the Tuba1aND mutation provides new insight into the complex regulation of the microtubule cytoskeleton during neural development. Whereas a previously identified dominant mutation in mouse Tuba1a showed defects limited to the cortex and hippocampus (Keays et al., 2007), Tuba1aND/ND mice show widespread defects in brain development affecting the cortex, olfactory bulb, midbrain and hindbrain, hippocampus and corpus callosum (Figure 2). Furthermore, our data demonstrate an important role for Tuba1a in motor neurons, including defects in axon extension and synapse function (Figure 3 and 5). Motor neurons in Tuba1aND/ND mice do not find their target muscles in the limbs, resulting in lack of embryonic limb movements. Thus our data show a new role for the Tuba1a isotype in embryonic motor neuron development and adds to the body of knowledge of Tuba1a function during neural development and synapse formation.
Two lines of evidence demonstrate that the ND mutation destabilizes microtubules. First, growth cones of Tuba1aND/ND motor neurons exhibit changes in the microtubule and actin cytoskeletons. The central and proximal regions of growth cones normally contain stable microtubules that are enriched for acetylated tubulin (Baas and Black, 1990; Black et al., 1989; Brown et al., 1993). Tuba1aND/ND growth cones, however, are depleted for acetylated tubulin, suggesting that microtubules are less stable in homozygous mutants (Figure 4). The depletion of F-actin in Tuba1aND/ND growth cones may also be attributable to the loss of stable microtubules, as microtubules are known to guide actin polymerization in the growth cone (Buck and Zheng, 2002). Second, our experiments in yeast provide a direct demonstration that the ND mutation is sufficient to disrupt microtubule stability and shows the conservation in mechanism beyond mammalian microtubule function. Introducing the ND mutation into both α-tubulin isotypes in yeast or the major isotype alone increases sensitivity to microtubule depolymerization by benomyl or low temperatures (Figure 6A). Based on our combined results from mice and yeast, we propose that the disruption of neural development in Tuba1aND/ND mutant mice is caused by impaired microtubule stability.
How might the ND substitution mutation impair microtubule stability? Residue 102 is positioned at the intradimer interface between α- and β-tubulin and near the non-exchangeable GTP-binding site (or ‘N-site’; Figure 1D). Substituting aspartic acid for asparagine at this position could alter stability of the heterodimer, either through direct or allosteric mechanisms. Indeed, our molecular simulations support the general model that the ND mutation disrupts the stability of the heterodimer. The results of our experiments in yeast are also consistent with this model, and further demonstrate that the ND mutant alters α-tubulin proteostasis. The simplified repertoire of only two α-tubulin isotypes in yeast allows comparison of α-tubulin protein levels in lysates from cells where one or both isotypes are ND mutants (Figure 6). When the ND mutation is introduced into only the major α-tubulin Tub1, total α-tubulin levels are decreased by 15% and the ratio of α-tubulin isotypes changes, with levels of the tub1-ND mutant isotype becoming similar to levels of the Tub3 wild-type isotype. Tub3 normally accounts for only 10-30% of total α-tubulin in wild-type cells (Figure 6; (Bode et al., 2003). We also find that the ND mutant isotype is depleted from microtubules in cells that express abundant wild-type α-tubulin (Figure 7B). We speculate that this change in isotype ratios could be achieved through targeted degradation of either the ND α-tubulin monomer or heterodimers that include ND α-tubulin. In support of this model, we find that tub1-ND mutants are lethal when combined with tub3Δ null mutants, suggesting that the minor α-isotype is necessary to supply sufficient α-tubulin for viability. Furthermore, introducing the ND mutation into both α-tubulin isotypes causes further decrease in total α-tubulin (Figure 6). If this model were extended to mouse neurons, then Tuba1aND/ND homozygotes would be severely depleted for the α-1 isotype, while heterozygotes mice would experience only modest depletion. This would explain the recessive nature of the ND mutation. Future experiments will aim to directly test these models in the context of living neurons, and use the ND mutant to gain new insights into the roles of the α-1 isotype in the neuronal microtubule network.
Our results point to a critical role for the tubulin biogenesis pathway in mitigating the effects of the ND mutant. Null mutations in any of the TBCs or tubulin-specific subunits of the prefoldin chaperone are lethal when combined with the tub1-ND single mutant (Figure 8; Table 1). This genetic relationship could be explained by several models, which are not mutually exclusive. First, the biogenesis pathway may be necessary to form stable heterodimers when the intradimer interface is weakened by ND mutant α-tubulin. Second, the biogenesis pathway could be necessary to salvage dissociated heterodimers in the ND mutant for reincorporation into polymerizing microtubules. Third, salvage of dissociated heterodimers by the biogenesis pathway may help to protect the cell from free β-tubulin. Previous studies show that excess free β-tubulin, generated either by increasing its expression or by decreasing levels of α-tubulin, has toxic effects (Burke et al., 1989; Katz et al., 1990). This toxicity is suppressed by TBCA/Rbl2, which binds to β-tubulin monomer (Archer et al., 1995; Archer et al., 1998). We find that overexpressing TBCA/Rbl2 suppresses the sensitivity of tub1-ND single mutants to microtubule depolymerizing drugs, and that rbl2Δ null mutants are lethal when combined with tub1-ND single mutants (Figure 8; Table 1). Interestingly, overexpressing TBCA/Rbl2 inhibits growth when all heterodimers in the cell contain ND mutant α-tubulin, which is the case in tub1-ND tub3-ND double mutants (Figure 8). This indicates important functional differences between cells with a blend of mutant and wild-type α-tubulin versus cells with only mutant α-tubulin. In the former, high levels of TBCs may protect the cell from mutant heterodimers and/or free β-tubulin. In the latter, all heterodimers may be sequestered by high levels of TBCs, since all heterodimers contain the mutant isotype. This interpretation is reminiscent of chaperone-mediated ‘quality control’, which has recently been demonstrated for mutants that disrupt interfaces between the subunits of septin filaments (Johnson et al., 2015). Further investigation of the ND mutants may elucidate a similar role for the tubulin biogenesis pathway.
The general mechanisms underlying neuronal defects in Tuba1aND/ND mice may also lend insight into the pathology of human tubulinopathies. Human tubulinopathies include a spectrum of brain malformations, and Tuba1aND/ND mice share common features including thin cortex, agenesis of the cerebellum, and dysgenesis of the corpus callosum (Figure 2; (Bahi-Buisson et al., 2014). The mutations associated with human tubulinopathies include a subset that alter amino acids at the intradimer interface, and some of these are known to disrupt heterodimer assembly (Tian et al., 2010). Interestingly, a recently identified case exhibits a missense mutation at codon 101 of human TUBA1A, replacing the native asparagine with serine (Fallet-Bianco et al., 2014). This substitution is immediately adjacent to the ND site, and could therefore alter α-tubulin function in a similar manner as we have shown here for the N102D mutation. Together, this evidence suggests that young neurons are exquisitely sensitive to the quality and efficiency of heterodimer formation. Understanding the mechanisms that regulate these processes may lead to improved therapeutic options.
Supplementary Material
Highlights.
Novel missense mutation in α-tubulin causes neural development defects in mice.
Analogous mutant disrupts α-tubulin stability and microtubule polymerization in yeast.
Tubulin biogenesis pathways are necessary to mitigate the effects of the mutation.
Acknowledgements
We thank Mark Johnston (University of Colorado School of Medicine) for sharing reagents, and our lab members for helpful discussions during these studies. This work was supported by National Institutes of Health (NIH) F32 fellowship NS059267 (M.G.H.) and grants 5R00GM092968-04 and 1R01GM112893-01A1 (to J.K.M.), 5R01GM076177-09 (to D.S.), and 5R01HD32427-16 (to L.N.). L.N. was an investigator of the Howard Hughes Medical Institute.
Footnotes
Publisher's Disclaimer: This is a PDF file of an unedited manuscript that has been accepted for publication. As a service to our customers we are providing this early version of the manuscript. The manuscript will undergo copyediting, typesetting, and review of the resulting proof before it is published in its final citable form. Please note that during the production process errors may be discovered which could affect the content, and all legal disclaimers that apply to the journal pertain.
References
- Amberg DC, Burke D, Strathern J. Methods in Yeast Genetics. Cold Spring Harbor Laboratory Press; Cold Spring Harbor, NY: 2005. [Google Scholar]
- Archer JE, Magendantz M, Vega LR, Solomon F. Formation and function of the Rbl2p-beta-tubulin complex. Mol Cell Biol. 1998;18:1757–1762. doi: 10.1128/mcb.18.3.1757. [DOI] [PMC free article] [PubMed] [Google Scholar]
- Archer JE, Vega LR, Solomon F. Rbl2p, a yeast protein that binds to beta-tubulin and participates in microtubule function in vivo. Cell. 1995;82:425–434. doi: 10.1016/0092-8674(95)90431-x. [DOI] [PubMed] [Google Scholar]
- Baas PW, Black MM. Individual microtubules in the axon consist of domains that differ in both composition and stability. J Cell Biol. 1990;111:495–509. doi: 10.1083/jcb.111.2.495. [DOI] [PMC free article] [PubMed] [Google Scholar]
- Bahi-Buisson N, Poirier K, Boddaert N, Saillour Y, Castelnau L, Philip N, Buyse G, Villard L, Joriot S, Marret S, Bourgeois M, Van Esch H, Lagae L, Amiel J, Hertz-Pannier L, Roubertie A, Rivier F, Pinard JM, Beldjord C, Chelly J. Refinement of cortical dysgeneses spectrum associated with TUBA1A mutations. J Med Genet. 2008;45:647–653. doi: 10.1136/jmg.2008.058073. [DOI] [PubMed] [Google Scholar]
- Bahi-Buisson N, Poirier K, Fourniol F, Saillour Y, Valence S, Lebrun N, Hully M, Bianco CF, Boddaert N, Elie C, Lascelles K, Souville I, Beldjord C, Chelly J. The wide spectrum of tubulinopathies: what are the key features for the diagnosis? Brain. 2014;137:1676–1700. doi: 10.1093/brain/awu082. [DOI] [PubMed] [Google Scholar]
- Bamji SX, Miller FD. Comparison of the expression of a T alpha 1:nlacZ transgene and T alpha 1 alpha-tubulin mRNA in the mature central nervous system. J Comp Neurol. 1996;374:52–69. doi: 10.1002/(SICI)1096-9861(19961007)374:1<52::AID-CNE4>3.0.CO;2-M. [DOI] [PubMed] [Google Scholar]
- Bearce EA, Erdogan B, Lowery LA. TIPsy tour guides: how microtubule plus-end tracking proteins (+TIPs) facilitate axon guidance. Front Cell Neurosci. 2015;9:241. doi: 10.3389/fncel.2015.00241. [DOI] [PMC free article] [PubMed] [Google Scholar]
- Black MM, Baas PW, Humphries S. Dynamics of alpha-tubulin deacetylation in intact neurons. J Neurosci. 1989;9:358–368. doi: 10.1523/JNEUROSCI.09-01-00358.1989. [DOI] [PMC free article] [PubMed] [Google Scholar]
- Bode CJ, Gupta ML, Suprenant KA, Himes RH. The two alpha-tubulin isotypes in budding yeast have opposing effects on microtubule dynamics in vitro. EMBO Rep. 2003;4:94–99. doi: 10.1038/sj.embor.embor716. [DOI] [PMC free article] [PubMed] [Google Scholar]
- Breuss M, Heng JI, Poirier K, Tian G, Jaglin XH, Qu Z, Braun A, Gstrein T, Ngo L, Haas M, Bahi-Buisson N, Moutard ML, Passemard S, Verloes A, Gressens P, Xie Y, Robson KJ, Rani DS, Thangaraj K, Clausen T, Chelly J, Cowan NJ, Keays DA. Mutations in the beta-tubulin gene TUBB5 cause microcephaly with structural brain abnormalities. Cell Rep. 2012;2:1554–1562. doi: 10.1016/j.celrep.2012.11.017. [DOI] [PMC free article] [PubMed] [Google Scholar]
- Brown A, Li Y, Slaughter T, Black MM. Composite microtubules of the axon: quantitative analysis of tyrosinated and acetylated tubulin along individual axonal microtubules. J Cell Sci. 1993;104:339–352. doi: 10.1242/jcs.104.2.339. [DOI] [PubMed] [Google Scholar]
- Brown AL, Johnson BE, Goodman MB. Making patch-pipettes and sharp electrodes with a programmable puller. J Vis Exp. 2008;20 doi: 10.3791/939. [DOI] [PMC free article] [PubMed] [Google Scholar]
- Buck KB, Zheng JQ. Growth cone turning induced by direct local modification of microtubule dynamics. J Neurosci. 2002;22:9358–9367. doi: 10.1523/JNEUROSCI.22-21-09358.2002. [DOI] [PMC free article] [PubMed] [Google Scholar]
- Burke D, Gasdaska P, Hartwell L. Dominant effects of tubulin overexpression in Saccharomyces cerevisiae. Mol Cell Biol. 1989;9:1049–1059. doi: 10.1128/mcb.9.3.1049. [DOI] [PMC free article] [PubMed] [Google Scholar]
- Conde C, Caceres A. Microtubule assembly, organization and dynamics in axons and dendrites. Nat Rev Neurosci. 2009;10:319–332. doi: 10.1038/nrn2631. [DOI] [PubMed] [Google Scholar]
- Dent EW, Gupton SL, Gertler FB. The growth cone cytoskeleton in axon outgrowth and guidance. Cold Spring Harb Perspect Biol. 2011;3:a001800. doi: 10.1101/cshperspect.a001800. [DOI] [PMC free article] [PubMed] [Google Scholar]
- Dent EW, Kalil K. Axon branching requires interactions between dynamic microtubules and actin filaments. J Neurosci. 2001;21:9757–9769. doi: 10.1523/JNEUROSCI.21-24-09757.2001. [DOI] [PMC free article] [PubMed] [Google Scholar]
- Dent EW, Meiri KF. GAP-43 phosphorylation is dynamically regulated in individual growth cones. J Neurobiol. 1992;23:1037–1053. doi: 10.1002/neu.480230809. [DOI] [PubMed] [Google Scholar]
- Derry WB, Wilson L, Khan IA, Luduena RF, Jordan MA. Taxol differentially modulates the dynamics of microtubules assembled from unfractionated and purified beta-tubulin isotypes. Biochemistry. 1997;36:3554–3562. doi: 10.1021/bi962724m. [DOI] [PubMed] [Google Scholar]
- Fallet-Bianco C, Laquerriere A, Poirier K, Razavi F, Guimiot F, Dias P, Loeuillet L, Lascelles K, Beldjord C, Carion N, Toussaint A, Revencu N, Addor MC, Lhermitte B, Gonzales M, Martinovich J, Bessieres B, Marcy-Bonniere M, Jossic F, Marcorelles P, Loget P, Chelly J, Bahi-Buisson N. Mutations in tubulin genes are frequent causes of various foetal malformations of cortical development including microlissencephaly. Acta Neuropathol Commun. 2014;2:69. doi: 10.1186/2051-5960-2-69. [DOI] [PMC free article] [PubMed] [Google Scholar]
- Fleming JA, Vega LR, Solomon F. Function of tubulin binding proteins in vivo. Genetics. 2000;156:69–80. doi: 10.1093/genetics/156.1.69. [DOI] [PMC free article] [PubMed] [Google Scholar]
- Gloster A, Wu W, Speelman A, Weiss S, Causing C, Pozniak C, Reynolds B, Chang E, Toma JG, Miller FD. The T alpha 1 alpha-tubulin promoter specifies gene expression as a function of neuronal growth and regeneration in transgenic mice. J Neurosci. 1994;14:7319–7330. doi: 10.1523/JNEUROSCI.14-12-07319.1994. [DOI] [PMC free article] [PubMed] [Google Scholar]
- Hanson MG, Fregoso VL, Vrana JD, Tucker CL, Niswander LA. Peripheral nervous system defects in a mouse model for peroxisomal biogenesis disorders. Dev Biol. 2014;395:84–95. doi: 10.1016/j.ydbio.2014.08.026. [DOI] [PMC free article] [PubMed] [Google Scholar]
- Hanson MG, Niswander LA. An explant muscle model to examine the refinement of the synaptic landscape. J Neurosci Methods. 2014;238:95–104. doi: 10.1016/j.jneumeth.2014.09.013. [DOI] [PMC free article] [PubMed] [Google Scholar]
- Hanson MG, Wilde JJ, Moreno RL, Minic AD, Niswander L. Potassium dependent rescue of a myopathy with core-like structures in mouse. Elife. 2015;4:e02923. doi: 10.7554/eLife.02923. [DOI] [PMC free article] [PubMed] [Google Scholar]
- Hoyt MA, Macke JP, Roberts BT, Geiser JR. Saccharomyces cerevisiae PAC2 functions with CIN1, 2 and 4 in a pathway leading to normal microtubule stability. Genetics. 1997;146:849–857. doi: 10.1093/genetics/146.3.849. [DOI] [PMC free article] [PubMed] [Google Scholar]
- Jaglin XH, Poirier K, Saillour Y, Buhler E, Tian G, Bahi-Buisson N, Fallet-Bianco C, Phan-Dinh-Tuy F, Kong XP, Bomont P, Castelnau-Ptakhine L, Odent S, Loget P, Kossorotoff M, Snoeck I, Plessis G, Parent P, Beldjord C, Cardoso C, Represa A, Flint J, Keays DA, Cowan NJ, Chelly J. Mutations in the beta-tubulin gene TUBB2B result in asymmetrical polymicrogyria. Nat Genet. 2009;41:746–752. doi: 10.1038/ng.380. [DOI] [PMC free article] [PubMed] [Google Scholar]
- Johnson CR, Weems AD, Brewer JM, Thorner J, McMurray MA. Cytosolic chaperones mediate quality control of higher-order septin assembly in budding yeast. Mol Biol Cell. 2015;26:1323–1344. doi: 10.1091/mbc.E14-11-1531. [DOI] [PMC free article] [PubMed] [Google Scholar]
- Kasarskis A, Manova K, Anderson KV. A phenotype-based screen for embryonic lethal mutations in the mouse. Proc Natl Acad Sci U S A. 1998;95:7485–7490. doi: 10.1073/pnas.95.13.7485. [DOI] [PMC free article] [PubMed] [Google Scholar]
- Katz W, Weinstein B, Solomon F. Regulation of tubulin levels and microtubule assembly in Saccharomyces cerevisiae: consequences of altered tubulin gene copy number. Mol Cell Biol. 1990;10:5286–5294. doi: 10.1128/mcb.10.10.5286. [DOI] [PMC free article] [PubMed] [Google Scholar]
- Keays DA, Tian G, Poirier K, Huang GJ, Siebold C, Cleak J, Oliver PL, Fray M, Harvey RJ, Molnar Z, Pinon MC, Dear N, Valdar W, Brown SD, Davies KE, Rawlins JN, Cowan NJ, Nolan P, Chelly J, Flint J. Mutations in alpha-tubulin cause abnormal neuronal migration in mice and lissencephaly in humans. Cell. 2007;128:45–57. doi: 10.1016/j.cell.2006.12.017. [DOI] [PMC free article] [PubMed] [Google Scholar]
- Kurup N, Yan D, Goncharov A, Jin Y. Dynamic Microtubules Drive Circuit Rewiring in the Absence of Neurite Remodeling. Curr Biol. 2015;25:1594–1605. doi: 10.1016/j.cub.2015.04.061. [DOI] [PMC free article] [PubMed] [Google Scholar]
- Lee H, Engel U, Rusch J, Scherrer S, Sheard K, Van Vactor D. The microtubule plus end tracking protein Orbit/MAST/CLASP acts downstream of the tyrosine kinase Abl in mediating axon guidance. Neuron. 2004;42:913–926. doi: 10.1016/j.neuron.2004.05.020. [DOI] [PubMed] [Google Scholar]
- Lewis SA, Lee MG, Cowan NJ. Five mouse tubulin isotypes and their regulated expression during development. J Cell Biol. 1985;101:852–861. doi: 10.1083/jcb.101.3.852. [DOI] [PMC free article] [PubMed] [Google Scholar]
- Lewis SA, Tian G, Cowan NJ. The alpha- and beta-tubulin folding pathways. Trends Cell Biol. 1997;7:479–484. doi: 10.1016/S0962-8924(97)01168-9. [DOI] [PubMed] [Google Scholar]
- Lowe J, Li H, Downing KH, Nogales E. Refined structure of alpha beta-tubulin at 3.5 A resolution. J Mol Biol. 2001;313:1045–1057. doi: 10.1006/jmbi.2001.5077. [DOI] [PubMed] [Google Scholar]
- Luduena RF, Banerjee A. The Isotypes of Tubulin, In Cancer Drug Discovery and Development: The Role of Microtubules in Cell Biology, Neurobiology, and Oncology. Humana Press; New York, NY: pp. 123–175. [Google Scholar]
- Miller BRIII, McGee TDJ, Swails JM, Homeyer N, Gohlke H, Roitberg AE. MMPBSA.py: An Efficient Program for End-State Free Energy Calculations. J. Chem. Theory Comput. 2012;8:3314–3321. doi: 10.1021/ct300418h. [DOI] [PubMed] [Google Scholar]
- Nithianantham S, Le S, Seto E, Jia W, Leary J, Corbett KD, Moore JK, Al-Bassam J. Tubulin cofactors and Arl2 are cage-like chaperones that regulate the soluble alphabeta-tubulin pool for microtubule dynamics. Elife. 2015;4:e08811. doi: 10.7554/eLife.08811. [DOI] [PMC free article] [PubMed] [Google Scholar]
- Phillips JC, Braun R, Wang W, Gumbart J, Tajkhorshid E, Villa E, Chipot C, Skeel RD, Kale L, Schulten K. Scalable molecular dynamics with NAMD. J Comput Chem. 2005;26:1781–1802. doi: 10.1002/jcc.20289. [DOI] [PMC free article] [PubMed] [Google Scholar]
- Piperno G, Fuller MT. Monoclonal antibodies specific for an acetylated form of alpha-tubulin recognize the antigen in cilia and flagella from a variety of organisms. J Cell Biol. 1985;101:2085–2094. doi: 10.1083/jcb.101.6.2085. [DOI] [PMC free article] [PubMed] [Google Scholar]
- Plomp JJ, van Kempen GT, Molenaar PC. Adaptation of quantal content to decreased postsynaptic sensitivity at single endplates in alpha-bungarotoxin-treated rats. J Physiol. 1992;458:487–499. doi: 10.1113/jphysiol.1992.sp019429. [DOI] [PMC free article] [PubMed] [Google Scholar]
- Poirier K, Keays DA, Francis F, Saillour Y, Bahi N, Manouvrier S, Fallet-Bianco C, Pasquier L, Toutain A, Tuy FP, Bienvenu T, Joriot S, Odent S, Ville D, Desguerre I, Goldenberg A, Moutard ML, Fryns JP, van Esch H, Harvey RJ, Siebold C, Flint J, Beldjord C, Chelly J. Large spectrum of lissencephaly and pachygyria phenotypes resulting from de novo missense mutations in tubulin alpha 1A (TUBA1A). Hum Mutat. 2007;28:1055–1064. doi: 10.1002/humu.20572. [DOI] [PubMed] [Google Scholar]
- Poirier K, Saillour Y, Fourniol F, Francis F, Souville I, Valence S, Desguerre I, Marie Lepage J, Boddaert N, Line Jacquemont M, Beldjord C, Chelly J, Bahi-Buisson N. Expanding the spectrum of TUBA1A-related cortical dysgenesis to Polymicrogyria. Eur J Hum Genet. 2013;21:381–385. doi: 10.1038/ejhg.2012.195. [DOI] [PMC free article] [PubMed] [Google Scholar]
- Prota AE, Magiera MM, Kuijpers M, Bargsten K, Frey D, Wieser M, Jaussi R, Hoogenraad CC, Kammerer RA, Janke C, Steinmetz MO. Structural basis of tubulin tyrosination by tubulin tyrosine ligase. J Cell Biol. 2013;200:259–270. doi: 10.1083/jcb.201211017. [DOI] [PMC free article] [PubMed] [Google Scholar]
- Roos J, Hummel T, Ng N, Klambt C, Davis GW. Drosophila Futsch regulates synaptic microtubule organization and is necessary for synaptic growth. Neuron. 2000;26:371–382. doi: 10.1016/s0896-6273(00)81170-8. [DOI] [PubMed] [Google Scholar]
- Schatz PJ, Solomon F, Botstein D. Genetically essential and nonessential alpha-tubulin genes specify functionally interchangeable proteins. Mol Cell Biol. 1986;6:3722–3733. doi: 10.1128/mcb.6.11.3722. [DOI] [PMC free article] [PubMed] [Google Scholar]
- Schmittgen TD, Livak KJ. Analyzing real-time PCR data by the comparative C(T) method. Nat Protoc. 2008;3:1101–1108. doi: 10.1038/nprot.2008.73. [DOI] [PubMed] [Google Scholar]
- Stearns T, Hoyt MA, Botstein D. Yeast mutants sensitive to antimicrotubule drugs define three genes that affect microtubule function. Genetics. 1990;124:251–262. doi: 10.1093/genetics/124.2.251. [DOI] [PMC free article] [PubMed] [Google Scholar]
- Stephan R, Goellner B, Moreno E, Frank CA, Hugenschmidt T, Genoud C, Aberle H, Pielage J. Hierarchical microtubule organization controls axon caliber and transport and determines synaptic structure and stability. Dev Cell. 2015;33:5–21. doi: 10.1016/j.devcel.2015.02.003. [DOI] [PMC free article] [PubMed] [Google Scholar]
- Szyk A, Deaconescu AM, Piszczek G, Roll-Mecak A. Tubulin tyrosine ligase structure reveals adaptation of an ancient fold to bind and modify tubulin. Nat Struct Mol Biol. 2011;18:1250–1258. doi: 10.1038/nsmb.2148. [DOI] [PMC free article] [PubMed] [Google Scholar]
- Szyk A, Deaconescu AM, Spector J, Goodman B, Valenstein ML, Ziolkowska NE, Kormendi V, Grigorieff N, Roll-Mecak A. Molecular basis for age-dependent microtubule acetylation by tubulin acetyltransferase. Cell. 2014;157:1405–1415. doi: 10.1016/j.cell.2014.03.061. [DOI] [PMC free article] [PubMed] [Google Scholar]
- Tian G, Jaglin XH, Keays DA, Francis F, Chelly J, Cowan NJ. Disease-associated mutations in TUBA1A result in a spectrum of defects in the tubulin folding and heterodimer assembly pathway. Hum Mol Genet. 2010;19:3599–3613. doi: 10.1093/hmg/ddq276. [DOI] [PMC free article] [PubMed] [Google Scholar]
- Tian G, Lewis SA, Feierbach B, Stearns T, Rommelaere H, Ampe C, Cowan NJ. Tubulin subunits exist in an activated conformational state generated and maintained by protein cofactors. J Cell Biol. 1997;138:821–832. doi: 10.1083/jcb.138.4.821. [DOI] [PMC free article] [PubMed] [Google Scholar]
- Toulmay A, Schneiter R. A two-step method for the introduction of single or multiple defined point mutations into the genome of Saccharomyces cerevisiae. Yeast. 2006;23:825–831. doi: 10.1002/yea.1397. [DOI] [PubMed] [Google Scholar]
- Vainberg IE, Lewis SA, Rommelaere H, Ampe C, Vandekerckhove J, Klein HL, Cowan NJ. Prefoldin, a chaperone that delivers unfolded proteins to cytosolic chaperonin. Cell. 1998;93:863–873. doi: 10.1016/s0092-8674(00)81446-4. [DOI] [PubMed] [Google Scholar]
- Wang L, Marquardt T. Direct live monitoring of heterotypic axon-axon interactions in vitro. Nat Protoc. 2012;7:351–363. doi: 10.1038/nprot.2011.442. [DOI] [PubMed] [Google Scholar]
- Webster DR, Borisy GG. Microtubules are acetylated in domains that turn over slowly. J Cell Sci. 1989;92:57–65. doi: 10.1242/jcs.92.1.57. [DOI] [PubMed] [Google Scholar]
- Webster DR, Gundersen GG, Bulinski JC, Borisy GG. Differential turnover of tyrosinated and detyrosinated microtubules. Proc Natl Acad Sci U S A. 1987;84:9040–9044. doi: 10.1073/pnas.84.24.9040. [DOI] [PMC free article] [PubMed] [Google Scholar]
- Wichterle H, Lieberam I, Porter JA, Jessell TM. Directed differentiation of embryonic stem cells into motor neurons. Cell. 2002;110:385–397. doi: 10.1016/s0092-8674(02)00835-8. [DOI] [PubMed] [Google Scholar]
- Witte H, Neukirchen D, Bradke F. Microtubule stabilization specifies initial neuronal polarization. J Cell Biol. 2008;180:619–632. doi: 10.1083/jcb.200707042. [DOI] [PMC free article] [PubMed] [Google Scholar]
- Yuan JS, Reed A, Chen F, Stewart CNJ. Statistical analysis of real-time PCR data. BMC Bioinformatics. 2006;7:85. doi: 10.1186/1471-2105-7-85. [DOI] [PMC free article] [PubMed] [Google Scholar]
- Zhou FQ, Zhou J, Dedhar S, Wu YH, Snider WD. NGF-induced axon growth is mediated by localized inactivation of GSK-3beta and functions of the microtubule plus end binding protein APC. Neuron. 2004;42:897–912. doi: 10.1016/j.neuron.2004.05.011. [DOI] [PubMed] [Google Scholar]
Associated Data
This section collects any data citations, data availability statements, or supplementary materials included in this article.