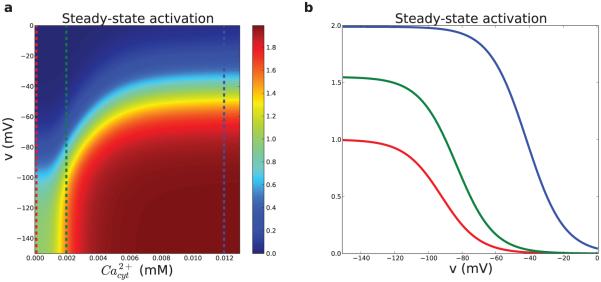
Figure 3. Pyramidal cell HCN channel activation.
(a) Steady-state HCN channel activation as a function of Ca2+ and Vmemb. Vertical lines are levels by color in (b). (b) Ihm voltage-dependence shifts right- and upward with increasing Ca2+. red: baseline at 100 nM; green: 2 μM; blue: 12 μM. Maximum steady-state activation is 2 because the second open state has twice the conductance of the first open state. At resting Ca2+ maximum steady state activation is 1.

