

Abstract
Analysis of microRNA (miRNA) expression signatures in prostate cancer (PCa) and castration‐resistant PCa has revealed that miRNA‐223 is significantly downregulated in cancer tissues, suggesting that miR‐223 acts as a tumor‐suppressive miRNA by targeting oncogenes. The aim of this study was to investigate the functional roles of miR‐223 and identify downstream oncogenic targets regulated by miR‐223 in PCa cells. Functional studies of miR‐223 were carried out to investigate cell proliferation, migration, and invasion using PC3 and PC3M PCa cell lines. Restoration of miR‐223 significantly inhibited cancer cell migration and invasion in PCa cells. In silico database and genome‐wide gene expression analyses revealed that ITGA3 and ITGB1 were direct targets of miR‐223 regulation. Knockdown of ITGA3 and ITGB1 significantly inhibited cancer cell migration and invasion in PCa cells by regulating downstream signaling. Moreover, overexpression of ITGA3 and ITGB1 was observed in PCa clinical specimens. Thus, our data indicated that downregulation of miR‐223 enhanced ITGA3/ITGB1 signaling and contributed to cancer cell migration and invasion in PCa cells. Elucidation of the molecular pathways modulated by tumor‐suppressive miRNAs provides insights into the mechanisms of PCa progression and metastasis.
Keywords: ITGA3, ITGB1, microRNA, miR‐223, prostate cancer
Prostate cancer (PCa) is the most common cause of cancer in men, accounting for approximately one‐quarter of all cancer cases in men.1 Multiple treatment options are available for localized PCa, and the 5‐year survival rate is nearly 100%; however, effective curative treatments for advanced PCa have not been developed.2 Skeletal metastasis is one of the most common and important features of advanced PCa.3 Metastatic PCa is initially treated with androgen‐deprivation therapy; however, the cancer gradually becomes resistant to first‐line androgen‐deprivation therapy and progresses to castration‐resistant PCa (CRPC).2 Progression of PCa to metastatic disease significantly affects the survival of men with PCa. Therefore, developing a deeper understanding of the molecular mechanisms of metastatic pathways underlying PCa metastasis using novel approaches will facilitate the development of novel treatment options for advanced PCa.
Normal regulatory mechanisms can be disrupted by the aberrant expression of tumor‐suppressive or oncogenic microRNAs (miRNAs) in cancer cells. Therefore, identification of aberrantly expressed miRNAs is an important first step toward elucidating the details of miRNA‐mediated oncogenic pathways. Based on this background, we have identified tumor‐suppressive miRNAs and the molecular targets and pathways regulated by these miRNAs on the miRNA expression signatures of PCa and CRPC specimens.4, 5, 6, 7, 8, 9, 10, 11 Recent studies of several miRNA signatures in PCa showed that miR‐223 expression is frequently reduced in cancer tissues compared to that in normal prostate tissues,4, 12, 13 suggesting that miR‐223 acts as a tumor suppressor in PCa.
Integrins are cell surface receptors for ECM proteins, and integrin‐mediated signaling plays a key role in cell survival, proliferation, migration, and invasion in normal and malignant cells.14, 15 Studies have shown that silencing of these genes significantly inhibits cell migration and invasion in cancer cells through targeting its downstream signaling.
The aim of the present study was to investigate the functional significance of miR‐223 and to identify the molecular targets and downstream signaling pathways regulated by miR‐223 in PCa cells. Our data showed that restoration of mature miR‐223 inhibited cancer cell migration and invasion. Moreover, gene expression data and in silico database analysis showed that the genes coding for integrin A3 (ITGA3) and integrin B1 (ITGB1) were potential targets of miR‐223 regulation. The discovery that tumor‐suppressive miR‐223 regulated integrin genes provides important insights into the potential mechanisms of PCa metastasis and suggests novel therapeutic strategies for the treatment of PCa.
Materials and Methods
Clinical prostate specimens and cell culture
Seventeen patients with PCa who had undergone radical prostatectomy at Chiba University Hospital (Chiba, Japan) from 2009 to 2013 and 29 patients with elevated prostate‐specific antigen (PSA) who had undergone transrectal needle biopsy at Teikyo University Chiba Medical Center (Ichihara, Japan) from 2008 to 2013 were enrolled in this study. The patients' backgrounds are summarized in Table 1. As for prostatectomy specimens, 17 paired samples of PCa and corresponding normal tissues were obtained. For needle biopsy specimens, a pair of needle biopsy specimens was collected from the same region as from patients in this study, and one was subjected to pathological verification. The normal tissues were free of cancer cells, as determined by pathological examination. Before tissue collection, written informed consent of tissue donation for research purposes was obtained from patients. The protocol was approved by the Institutional Review Board of Chiba University and Teikyo University.
Table 1.
Characteristics of patients with prostate cancer (PCa) who had undergone radical prostatectomy (n = 17) and patients with elevated prostate‐specific antigen (PSA) who had undergone transrectal needle biopsy (non‐PCa) (n = 29) and their paired normal samples
| No. | Procedure | PCa or non‐PCa | Age, years | PSA, ng/mL | Gleason score | Stage | cT | cN | cM |
|---|---|---|---|---|---|---|---|---|---|
| 1 | Prostatectomy | PCa | 64 | 5.43 | 3+4 | III | 3a | 0 | 0 |
| 2 | Prostatectomy | PCa | 68 | 12.81 | 3+5 | III | 3a | 0 | 0 |
| 3 | Prostatectomy | PCa | 70 | 16.06 | 4+5 | III | 3b | 0 | 0 |
| 4 | Prostatectomy | PCa | 69 | 25.79 | 4+5 | II | 2a | 0 | 0 |
| 5 | Prostatectomy | PCa | 64 | 29.93 | 4+3 | II | 2b | 0 | 0 |
| 6 | Prostatectomy | PCa | 61 | 7.85 | 3+4 | III | 3a | 0 | 0 |
| 7 | Prostatectomy | PCa | 68 | 8.78 | 4+5 | II | 2b | 0 | 0 |
| 8 | Prostatectomy | PCa | 66 | 6.13 | 4+3 | II | 2b | 0 | 0 |
| 9 | Prostatectomy | PCa | 70 | 11.75 | 4+4 | III | 3b | 0 | 0 |
| 10 | Prostatectomy | PCa | 60 | 22.10 | 3+4 | II | 2b | 0 | 0 |
| 11 | Prostatectomy | PCa | 70 | 8.88 | 3+4 | II | 2a | 0 | 0 |
| 12 | Prostatectomy | PCa | 72 | 4.48 | 3+4 | II | 2b | 0 | 0 |
| 13 | Prostatectomy | PCa | 56 | 7.12 | 3+4 | III | 3a | 0 | 0 |
| 14 | Prostatectomy | PCa | 65 | 13.08 | 4+3 | II | 2b | 0 | 0 |
| 15 | Prostatectomy | PCa | 65 | 9.53 | 4+4 | II | 2b | 0 | 0 |
| 16 | Prostatectomy | PCa | 65 | 5.80 | 4+3 | II | 2a | 0 | 0 |
| 17 | Prostatectomy | PCa | 65 | 4.59 | 5+4 | II | 2b | 0 | 0 |
| 18 | Prostatectomy | Non‐PCa | 64 | 5.43 | – | – | – | – | – |
| 19 | Prostatectomy | Non‐PCa | 68 | 12.81 | – | – | – | – | – |
| 20 | Prostatectomy | Non‐PCa | 70 | 16.06 | – | – | – | – | – |
| 21 | Prostatectomy | Non‐PCa | 69 | 25.79 | – | – | – | – | – |
| 22 | Prostatectomy | Non‐PCa | 64 | 29.93 | – | – | – | – | – |
| 23 | Prostatectomy | Non‐PCa | 61 | 7.85 | – | – | – | – | – |
| 24 | Prostatectomy | Non‐PCa | 68 | 8.78 | – | – | – | – | – |
| 25 | Prostatectomy | Non‐PCa | 66 | 6.13 | – | – | – | – | – |
| 26 | Prostatectomy | Non‐PCa | 70 | 11.75 | – | – | – | – | – |
| 27 | Prostatectomy | Non‐PCa | 60 | 22.10 | – | – | – | – | – |
| 28 | Prostatectomy | Non‐PCa | 70 | 8.88 | – | – | – | – | – |
| 29 | Prostatectomy | Non‐PCa | 72 | 4.48 | – | – | – | – | – |
| 30 | Prostatectomy | Non‐PCa | 56 | 7.12 | – | – | – | – | – |
| 31 | Prostatectomy | Non‐PCa | 65 | 13.08 | – | – | – | – | – |
| 32 | Prostatectomy | Non‐PCa | 65 | 9.53 | – | – | – | – | – |
| 33 | Prostatectomy | Non‐PCa | 65 | 5.80 | – | – | – | – | – |
| 34 | Prostatectomy | Non‐PCa | 65 | 4.59 | – | – | – | – | – |
| 35 | Biopsy | PCa | 65 | 989.00 | 4+5 | IV | 4 | 1 | 1 |
| 36 | Biopsy | PCa | 73 | 478.00 | 4+3 | IV | 3b | 0 | 1 |
| 37 | Biopsy | PCa | 75 | 63.20 | 4+5 | IV | 4 | 1 | 1 |
| 38 | Biopsy | PCa | 79 | 95.60 | 4+5 | IV | 3b | 1 | 1 |
| 39 | Biopsy | PCa | 69 | 248.00 | 4+4 | IV | 4 | 1 | 1 |
| 40 | Biopsy | PCa | 70 | 36.08 | 3+4 | IV | 3a | 1 | 0 |
| 41 | Biopsy | PCa | 66 | 1338.00 | 4+5 | IV | 3a | 1 | 0 |
| 42 | Biopsy | PCa | 81 | 332.00 | 4+5 | IV | 4 | 0 | 1 |
| 43 | Biopsy | PCa | 72 | 355.00 | 4+4 | III | 3a | 0 | 0 |
| 44 | Biopsy | PCa | 65 | 208.00 | 4+4 | IV | 4 | 1 | 1 |
| 45 | Biopsy | PCa | 81 | 102.00 | 4+4 | II | 2 | 0 | 0 |
| 46 | Biopsy | PCa | 75 | 212.00 | 4+4 | III | 3b | 0 | 0 |
| 47 | Biopsy | PCa | 73 | 12.90 | 4+4 | IV | 3b | 1 | 0 |
| 48 | Biopsy | PCa | 58 | 11.40 | 4+4 | IV | 3b | 1 | 0 |
| 49 | Biopsy | PCa | 73 | 22.70 | 4+4 | III | 3a | 0 | 0 |
| 50 | Biopsy | Non‐PCa | 54 | 5.44 | – | – | – | – | – |
| 51 | Biopsy | Non‐PCa | 60 | 5.60 | – | – | – | – | – |
| 52 | Biopsy | Non‐PCa | 67 | 5.93 | – | – | – | – | – |
| 53 | Biopsy | Non‐PCa | 67 | 8.09 | – | – | – | – | – |
| 54 | Biopsy | Non‐PCa | 60 | 14.00 | – | – | – | – | – |
| 55 | Biopsy | Non‐PCa | 69 | 5.99 | – | – | – | – | – |
| 56 | Biopsy | Non‐PCa | 56 | 8.44 | – | – | – | – | – |
| 57 | Biopsy | Non‐PCa | 61 | 8.60 | – | – | – | – | – |
| 58 | Biopsy | Non‐PCa | 62 | 35.50 | – | – | – | – | – |
| 59 | Biopsy | Non‐PCa | 57 | 5.19 | – | – | – | – | – |
| 60 | Biopsy | Non‐PCa | 64 | 4.37 | – | – | – | – | – |
| 61 | Biopsy | Non‐PCa | 60 | 5.68 | – | – | – | – | – |
| 62 | Biopsy | Non‐PCa | 63 | 11.40 | – | – | – | – | – |
| 63 | Biopsy | Non‐PCa | 65 | 13.20 | – | – | – | – | – |
–, Not applicable.
For in vitro analyses, we used human PCa cell lines PC3 and PC3M obtained from ATCC (Manassas, VA, USA). These cells were maintained in RPMI‐1640 medium supplemented with 10% FBS in a humidified atmosphere of 5% CO2 and 95% air at 37°C.
RNA extraction
Total RNA was extracted from formalin‐fixed paraffin‐embedded samples with four 5‐μm‐thick slices, using the miRNeasy FFPE Kit (Qiagen, Hilden, Germany) according to the manufacturer's protocol.
Quantitative real‐time RT‐PCR
The procedure for PCR quantification was described previously.11, 16, 17 TaqMan probes and primers for ITGA3 (P/N: Hs01076873_ml), ITGB1 (P/N: Hs00559595_ml), and ACTB (internal control; P/N: Hs01060665_gl) (all Applied Biosystems, Foster City, CA, USA) were assay‐on‐demand gene expression products. The expression levels of miR‐223 (assay ID: 002295; Applied Biosystems) were analyzed by TaqMan quantitative real‐time RT‐PCR (qRT‐PCR) (TaqMan MicroRNA Assay; Applied Biosystems) and normalized to the expression of RNU48 (assay ID: 001006; Applied Biosystems). All reactions were carried out in triplicate, and each assay included negative control reactions that lacked cDNA.
Mature miRNA, siRNA, and plasmid vector transfection
The following miRNA and siRNAs were used: Pre‐miR miRNA precursor (hsa‐miR‐223‐3p; P/N: AM12301; Applied Biosystems), Stealth Select RNAi siRNAs; si‐ITGA3 (cat. nos. HSS105529 and HSS179967; Invitrogen Carlsbad, CA, USA), si‐ITGB1 (cat nos. HSS105559 and HSS105561; Invitrogen), and negative control miRNA/siRNA (P/N: AM17111; Applied Biosystems). RNAs were incubated with Opti‐MEM (Invitrogen) and Lipofectamine RNAiMax transfection reagent (Invitrogen) as described previously.11, 16, 17
For ITGA3 or ITGB1 rescue experiments, 2.5 g pF4A CMV Flexi‐plasmid vector containing ITGA3 or ITGB1 (C848A; Promega, Madison, WI, USA) were transfected 24 h before miRNA transfection by using Lipofectamine 2000 transfection reagent (Life Technologies, Carlsbad, CA, USA).
Cell proliferation, migration, and invasion assays
Cell proliferation, migration, and invasion assays were carried out as previously described.11, 16, 17
Western blot analysis
Cells were harvested 72 h after transfection, and lysates were prepared. Next, 20 μg each cell lysate was separated on Mini‐PROTEAN TGX Gels (Bio‐Rad, Hercules, CA, USA) and transferred to PVDF membranes. Immunoblotting was carried out with rabbit anti‐ITGA3 antibodies (HPA008572, 1:250 dilution; Sigma‐Aldrich, St. Louis, MO, USA), rabbit anti‐ITGB1 antibodies (9699, 1:1000 dilution; Cell Signaling Technology, Danvers, MA, USA), rabbit anti‐focal adhesion kinase (FAK) antibodies (#3285, 1:1000 dilution; Cell Signaling Technology), anti‐phospho‐FAK (Tyr397) (D20B1) rabbit mAbs (#8556, 1:1000 dilution; Cell Signaling Technology), anti‐Akt (pan) (11E7) rabbit mAbs (#4685, 1:1000 dilution; Cell Signaling Technology), anti‐phospho‐Akt (Ser473) (D9E) XP rabbit mAbs (#4060, 1:1000 dilution; Cell Signaling Technology), anti‐Src (32G6) rabbit mAbs (#2123, 1:1000 dilution; Cell Signaling Technology), anti‐phospho‐Src family (Tyr416) (D49G4) rabbit mAbs (#6943, 1:1000 dilution; Cell Signaling Technology), anti‐p44/42 MAPK (also known as ERK1/2) antibodies (#9102, 1:1000 dilution; Cell Signaling Technology), anti‐phospho‐p44/42 MAPK (Erk1/2) (Thr202/Tyr204) (D13.14.4E) XP rabbit mAbs (#4370, 1:1000 dilution; Cell Signaling Technology), and anti‐GAPDH antibodies (ab8245, 1:1000 dilution; Abcam, Cambridge, UK) as a loading control. The membranes were washed and incubated with anti‐rabbit IgG HRP‐linked antibodies (#7074; Cell Signaling Technology). Complexes were visualized with Clarity Western ECL Substrate (Bio‐Rad).
Screening of miR‐223 target genes using in silico analysis and genome‐wide gene expression analysis
To identify miR‐223 target genes, we used in silico analysis and genome‐wide gene expression analysis, as described previously.18, 19 The strategy for selection of miR‐223 target genes is shown in Figure S1.
Plasmid construction and dual‐luciferase reporter assay
Partial wild‐type sequences of the ITGA3/ITGB1 3′‐UTR or those with deleted miR‐223 target sites were inserted between the XhoI–PmeI restriction sites in the 3′‐UTR of the hRluc gene in the psiCHECK‐2 vector (C8021; Promega). The synthesized DNA was cloned into the psiCHECK‐2 vector. PC3 cells were transfected with 50 ng vector and 10 nM miR‐223 using Lipofectamine 2000 (Invitrogen). The activities of firefly and Renilla luciferases in cell lysates were determined with a dual‐luciferase assay system (E1910; Promega). Normalized data were calculated as the ratio of Renilla/firefly luciferase activities.
Immunohistochemistry
A total of 17 radical prostatectomy specimens were used (Table 1). Tissue specimens were immunostained using an Ultra‐Vision Detection System (Thermo Scientific, Fremont, CA, USA) according to the manufacturer's instructions. Primary rabbit polyclonal antibodies against ITGA3 (HPA008572; Sigma‐Aldrich) were diluted 1:15, and primary mouse mAbs against ITGB1 (ab3167; Abcam) were diluted 1:100. The slides were treated with biotinylated goat antibodies.
A tissue microarray containing 60 PCa specimens, 10 prostatic intraepithelial neoplasias, and 10 prostatic hyperplastic samples was obtained from Provitro (Berlin, Germany) (Cat. #401 2209, Lot #146.1 P020212, 26‐46). Detailed information on all cancer specimens can be found at http://www.provitro.com/fileadmin/provitro-data/TMA/4012209.pdf. Immunostaining was evaluated according to the scoring method described previously.11
Statistical analysis
The relationships between two groups and the numerical values obtained by real‐time RT‐PCR were analyzed using the Mann–Whitney U‐test. The relationships among three variables and numerical values were analyzed using the Bonferroni‐adjusted Mann–Whitney U‐test. All analyses were carried out using Expert StatView (version 5; SAS Institute Inc., Cary, NC, USA).
Results
Expression levels of miR‐223 in PCa clinical specimens and cell lines
To validate our past PCa miRNA signature results, we evaluated the expression levels of miR‐223 in 34 radical prostatectomy specimens and 29 transrectal needle biopsy specimens. The expression levels of miR‐223 were significantly lower in PCa clinical specimens than in non‐cancerous specimens (P = 0.0069, Fig. 1a; P = 0.0184, Fig. 1b). The miR‐223 expression was also reduced in PC3 and PC3M cells compared with that in non‐cancerous specimens.
Figure 1.
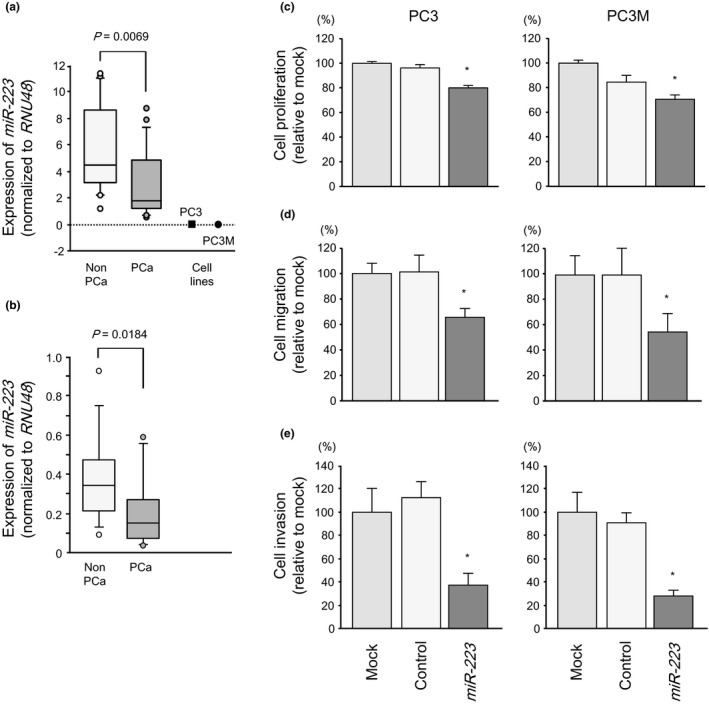
Expression levels of miR‐223 in prostate cancer (PCa) clinical specimens and PCa cell lines PC3 and PC3M. (a, b) Quantitative real‐time RT‐PCR showed that the expression levels of miR‐223 were significantly lower in PCa tissues and PCa cell lines than in normal prostate tissues. RNU48 was used as an internal control. Effects of miR‐223 transfection on PCa cell lines PC3 and PC3M. (c) Cell proliferation was determined by XTT assays 72 h after transfection with miR‐223 (10 nM). (d) Cell migration activity was determined by wound‐healing assays 48 h after transfection with miR‐223 (10 nM). (e) Cell invasion activity was determined by Matrigel invasion assays 48 h after transfection with miR‐223 (10 nM). *P < 0.05.
However, it was not able to assess the correlation between miR‐223 expression and clinicopathological characteristics due to the limited number of clinical specimens. The cohort study with increased number of specimens will be important in the future.
Effects of miR‐223 restoration on cell proliferation, migration, and invasion in PCa cells
To investigate the functional effects of miR‐223, we carried out gain‐of‐function studies using miRNA transfection of PC3 and PC3M cells.
The XTT assays revealed significant inhibition of cell proliferation in PC3 and PC3M cells transfected with miR‐223 in comparison with mock‐ or control‐transfected cells (PC3, P < 0.0001; PC3M, P = 0.0002; Fig. 1c).
Similarly, wound healing assays showed significant inhibition of cell migration activities in miR‐223 transfectants compared with that in mock‐ or miR‐control‐transfected cells (PC3, P = 0.0176; PC3M, P < 0.0001; Fig. 1d).
Moreover, Matrigel invasion assays revealed that miR‐223 transfection significantly inhibited cell invasion. The number of invaded cells was significantly reduced in miR‐223‐transfected cells (PC3, P < 0.0001; PC3M, P < 0.0001; Fig. 1e).
Identification of candidate target genes of miR‐223 in PCa cells
To identify target genes of miR‐223, we carried out a combination of in silico and oligomicroarray analyses. First, we undertook genome‐wide gene expression analysis using PC3 and PC3M cells. A total of 936 genes that were downregulated (average log2 ratio < −0.5) following miR‐223 transfection as compared with expression levels in miR‐control‐transfected cells were selected. Next, we screened these genes using the TargetScan database and found that 247 genes had putative target sites for miR‐223 in their 3′‐UTRs. Finally, we categorized these genes into KEGG pathways using GeneCodis analysis; 14 pathways were identified as significantly enriched (Table 2).
Table 2.
Significantly enriched pathways following miR‐223 transfection in PC3 and PC3M prostate cancer cells
| KEGG entry number | Annotation | P‐value | Genes |
|---|---|---|---|
| 4512 | ECM–receptor interaction | 0.0001809 | SDC4, ITGA3, LAMC2, ITGB1, CD44 |
| 4010 | MAPK signaling pathway | 0.0002460 | MAP3K13, AKT3, PRKCA, MKNK2, GNG12, RRAS2, STMN1, FLNB |
| 4810 | Regulation of actin cytoskeleton | 0.0003455 | ABI2, ITGA3, TMSB4X, GNG12, ARPC5L, RRAS2, ITGB1 |
| 5130 | Pathogenic Escherichia coli infection | 0.0003558 | PRKCA, TUBA1B, ARPC5L, ITGB1 |
| 4141 | Protein processing in endoplasmic reticulum | 0.0004903 | ERLEC1, UFD1L, HSPH1, RRBP1, TRAM1, HSP90B1 |
| 5200 | Pathways in cancer | 0.0009929 | PPARD, EPAS1, ITGA3, AKT3, PRKCA, LAMC2, ITGB1, HSP90B1 |
| 4530 | Tight junction | 0.0013334 | MPP5, AKT3, PRKCA, EPB41L3, RRAS2 |
| 4510 | Focal adhesion | 0.0014889 | ITGA3, AKT3, PRKCA, LAMC2, ITGB1, FLNB |
| 4120 | Ubiquitin‐mediated proteolysis | 0.0015753 | UBE2A, UBE3B, CDC27, UBE2L3, TRIM37 |
| 5222 | Small‐cell lung cancer | 0.0018785 | ITGA3, AKT3, LAMC2, ITGB1 |
| 4970 | Salivary secretion | 0.0019618 | ATP1B1, KCNMA1, ITPR3, PRKCA |
| 4972 | Pancreatic secretion | 0.0032883 | ATP1B1, KCNMA1, ITPR3, PRKCA |
| 5010 | Alzheimer's disease | 0.0035642 | NDUFA5, ITPR3, BACE1, NDUFA3, PSEN1 |
| 4978 | Mineral absorption | 0.0039263 | ATP1B1, MT1E, STEAP2 |
Because miR‐223 significantly inhibited cancer cell migration and invasion, we focused on three annotations: ECM–receptor interaction, regulation of actin cytoskeleton, and focal adhesion. These three annotations all included ITGA3 and ITGB1; therefore, these genes were subjected to further analysis.
Immunohistochemical detection of ITGA3 and ITGB1 in PCa clinical specimens
Next, we examined the expression levels of ITGA3 and ITGB1 in PCa specimens by immunohistochemical staining. ITGA3 and ITGB1 were strongly expressed in several cancer tissues, while low expression was observed in normal tissues (Fig. 2). To gain further insights into whether the upregulation of ITGA3 and ITGB1 correlates with clinicopathological features, we used tissue microarray (Table S1). Immunostaining was evaluated according to the scoring method as described previously.11 Each case was scored on the basis of the intensity and area of staining. Both upregulation of ITGA3 and ITGB1 were confirmed in the PCa tissue compared with non‐PCa tissue (Fig. S4, P = 0.0294 and P = 0.0003). The expression levels of ITGA3 or ITGB1 were not associated with clinicopathological features of PCa in this analysis.
Figure 2.
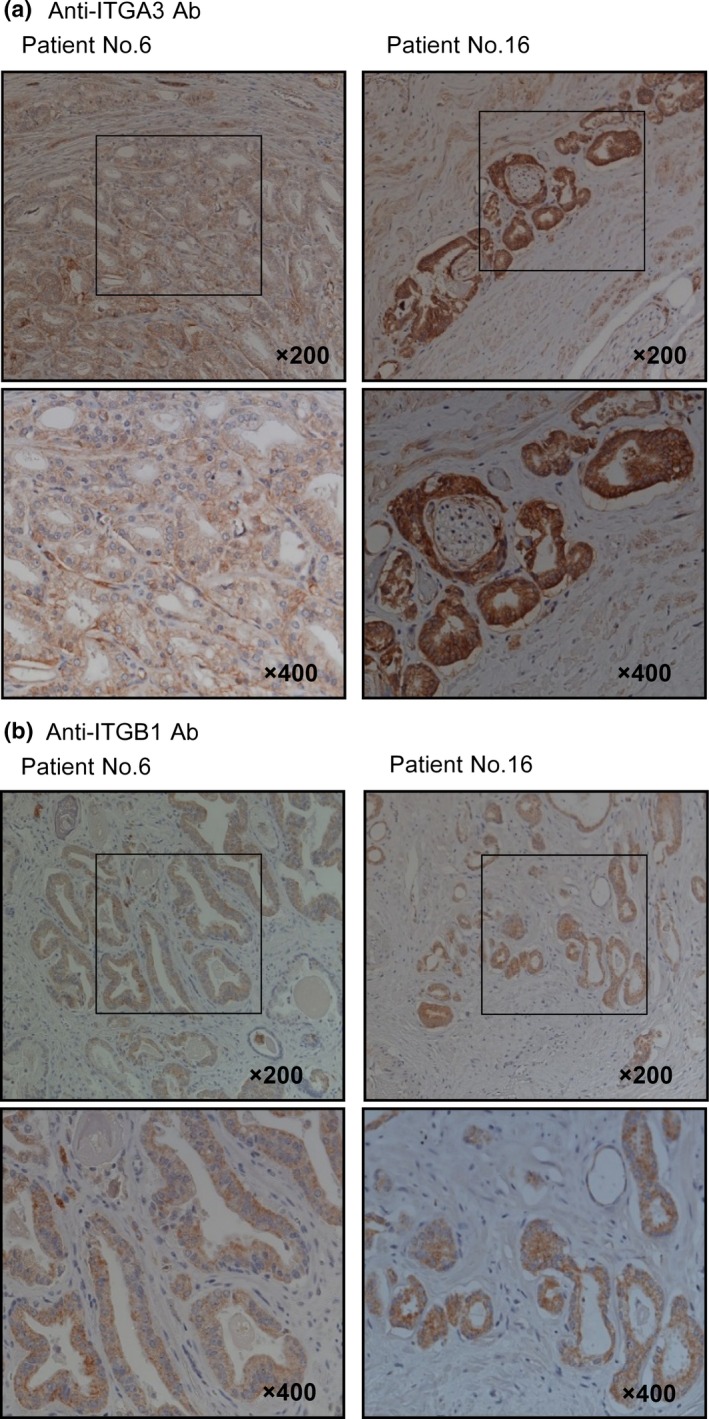
Immunohistochemical staining of integrin A3 (ITGA3) and integrin B1 (ITGB1) in clinical specimens of prostate cancer and normal prostate tissues. (a) ITGA3 was expressed more strongly in several cancer lesions than in normal tissues. (b) ITGB1 was also overexpressed in cancer lesions.
ITGA3 and ITGB1 were directly regulated by miR‐223
We then carried out qRT‐PCR and Western blotting to confirm that restoration of miR‐223 resulted in downregulation of ITGA3 and ITGB1 in PC3 and PC3M cells. The mRNA and protein expression levels of ITGA3 and ITGB1 were significantly repressed in miR‐223 transfectants compared with mock or miR‐control transfectants (PC3, P = 0.0051; PC3M, P = 0.0029; Fig. 3) (PC3, P = 0.0014; PC3M, P = 0.0017; Fig. 4).
Figure 3.
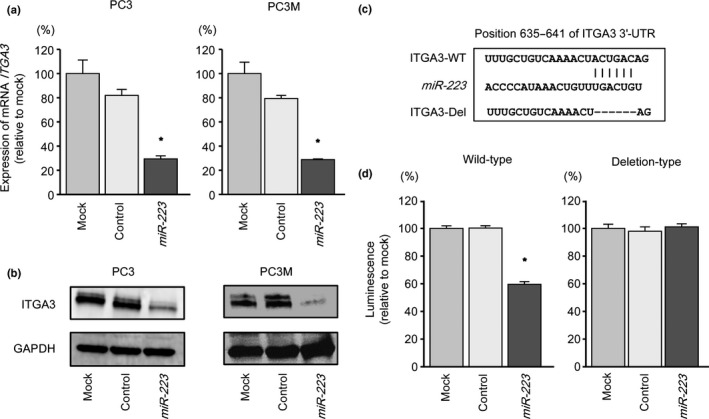
Expression of the gene encoding integrin A3 (ITGA3) was suppressed by transfection of prostate cancer cell lines PC3 and PC3M with miR‐223. (a) ITGA3 mRNA expression was evaluated by quantitative RT‐PCR 72 h after transfection with miR‐223 (10 nM). ACTB was used as an internal control. *P < 0.01. (b) ITGA3 protein expression was evaluated by Western blotting 72 h after transfection with miR‐223 (10 nM). GAPDH was used as a loading control. (c) miR‐223 binding site in the 3′‐UTR of ITGA3 mRNA. (d) Luciferase reporter assays in PC3 cells using vectors encoding a putative miR‐223 target site at position 635–641 of ITGA3 3′‐UTR. Renilla luciferase values were normalized to firefly luciferase values. *P < 0.0001.
Figure 4.
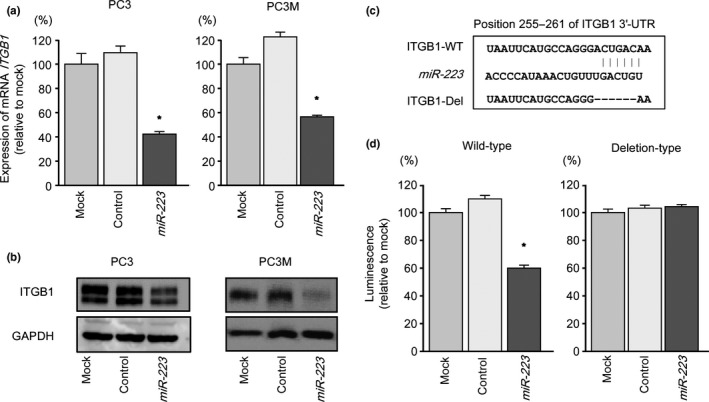
Expression of the gene encoding integrin B1 (ITGB1) was suppressed by transfection of prostate cancer cell lines PC3 and PC3M with miR‐223. (a) ITGB1 mRNA expression was evaluated by quantitative RT‐PCR 72 h after transfection with miR‐223 (10 nM). ACTB was used as an internal control. *P < 0.005. (b) ITGB1 protein expression was evaluated by Western blotting 72 h after transfection with miR‐223 (10 nM). GAPDH was used as a loading control. (c) miR‐223 binding site in the 3′‐UTR of ITGB1 mRNA. (d) Luciferase reporter assays in PC3 cells using vectors encoding a putative miR‐223 target site at position 255–261 of the ITGB1 3′‐UTR. Renilla luciferase values were normalized to firefly luciferase values. *P < 0.0001.
We used luciferase reporter assays in PC3 cells to determine whether ITGA3 and ITGB1 mRNAs were directly regulated by miR‐223. The TargetScan database predicted that putative miR‐223‐binding sites existed in the 3′‐UTR of ITGA3 (position 635–641; Fig. 3c) and of ITGB1 (position 255–261; Fig. 4c). We used vectors encoding either the partial wild‐type sequence of the 3′‐UTR of ITGA3 or ITGB1 mRNA, including the predicted miR‐223 target sites, or deletion vectors lacking the miR‐223 target sites. We found that the luminescence intensities were significantly reduced by transfection with miR‐223 and vectors carrying the wild‐type 3′‐UTR of ITGA3 and ITGB1, whereas transfection with deletion vectors blocked the decrease in luminescence (P < 0.0001 and P < 0.0001, respectively; Figs. 3d,4d). These data suggested that miR‐223 bound directly to specific sites in the 3′‐UTRs of ITGA3 and ITGB1 mRNA.
Effects of silencing ITGA3 and ITGB1 on cell proliferation, migration, and invasion in PCa cells
To investigate the functional role of ITGA3 and ITGB1 in PCa cells, we carried out loss‐of‐function studies using si‐ITGA3 and si‐ITGB1 transfectants. First, we evaluated the knockdown efficiency of si‐ITGA3 and si‐ITGB1 transfection in PC3 cells. Quantitative RT‐PCR and Western blotting indicated that si‐ITGA3 transfection effectively downregulated ITGA3 expression and that si‐ITGB1 transfection effectively downregulated ITGB1 expression in PC3 cells (P < 0.0005 and P < 0.0001, respectively; Fig. 5a,b).
Figure 5.
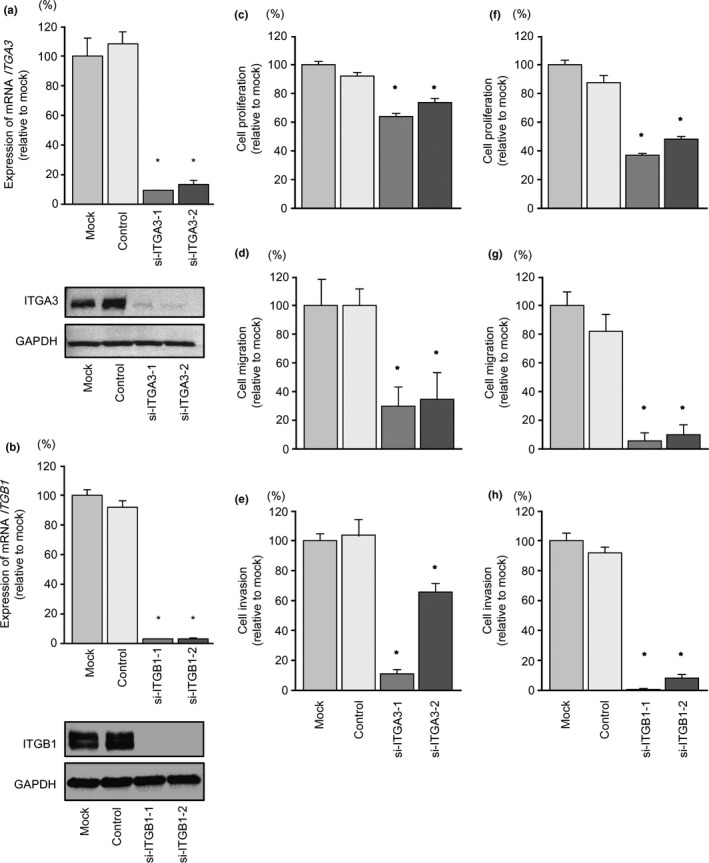
Expression levels of the genes encoding integrins A3 (ITGA3) and B1 (ITGB1) were suppressed by transfection of PC3 prostate cancer cells with si‐ITGA3 and si‐ITGB1. (a, b) ITGA3 and ITGB1 mRNA expression levels were evaluated by quantitative RT‐PCR 72 h after transfection with si‐ITGA3 and si‐ITGB1 (10 nM). ACTB was used as an internal control. *P < 0.0005. ITGA3 and ITGB1 expression levels were evaluated by Western blotting 72 h after transfection with si‐ITGA3 and si‐ITGB1 (10 nM). GAPDH was used as a loading control. (c–e) Effects of ITGA3 silencing on PC3 cells. (c) Cell proliferation was determined by XTT assays. (d) Cell migration activity was determined by wound‐healing assays. (e) Cell invasion activity was determined by Matrigel invasion assays. (f–h) Effects of silencing ITGB1 on PC3 cells. (f) Cell proliferation was determined by XTT assays. (g) Cell migration activity was determined by wound‐healing assays. (h) Cell invasion activity was determined by Matrigel invasion assays. *P < 0.0001.
In functional assays, cell proliferation, migration, and invasion assays indicated that cancer cell proliferation, migration, and invasion activity were significantly inhibited in si‐ITGA3‐transfected PC3 cells in comparison with mock‐ or si‐control‐transfected PC3 cells (P < 0.0001, P < 0.0001, and P < 0.0001, respectively; Fig. 5c–e). Similarly, transfection with si‐ITGB1 significantly inhibited cancer cell proliferation, migration, and invasion (P < 0.0001, P < 0.0001, and P < 0.0001, respectively; Fig. 5f–h).
We also evaluated the knockdown efficiency of si‐ITGA3 and si‐ITGB1 transfection in PC3M cells. Cancer cell proliferation, migration, and invasion activity were significantly inhibited in si‐ITGA3‐ and si‐ITGB1‐transfected cells in comparison with mock‐ or si‐control‐transfected cells (Fig. S2).
Effects of cotransfection of ITGA3/miR‐223 or ITGB1/miR‐223 in PC3 cell line
To confirm that ITGA3/miR‐223 or ITGB1/miR‐223 mediated the antitumor effect in PCa cells, we co‐expressed ITGA3 and miR‐223 or ITGB1 and miR‐223 in PCa cells. ITGA3 or ITGB1 rescue studies indicated that cell migration and invasion properties were rescued by ITGA3 or ITGB1 transfectants compared with cells with restored miR‐223 only (Fig. S3). These data suggested that the role of ITGA3 or ITGB1 protein was modulated by miR‐223 and the effects of migration and invasion in PCa cells.
Effects of ITGB1 knockdown on ITGB1 downstream signaling
We analyzed the effects of ITGA3/ITGB1 knockdown on downstream signaling in PC3 cells using si‐ITGA3 and si‐ITGB1 transfectants. To examine the effects of knockdown on ITGB1‐mediated survival pathways, the phosphorylation of FAK (Tyr 397), SRC (Tyr 416), AKT (Ser 473), and ERK1/2 (Thr 202/Tyr 204) was examined. Knockdown of ITGB1 greatly reduced the phosphorylation of FAK, SRC, AKT, and ERK1/2 (Fig. 6). In contrast to knockdown of ITGB1, knockdown of ITGA3 did not cause changes in the phosphorylation levels of these proteins (data not shown).
Figure 6.
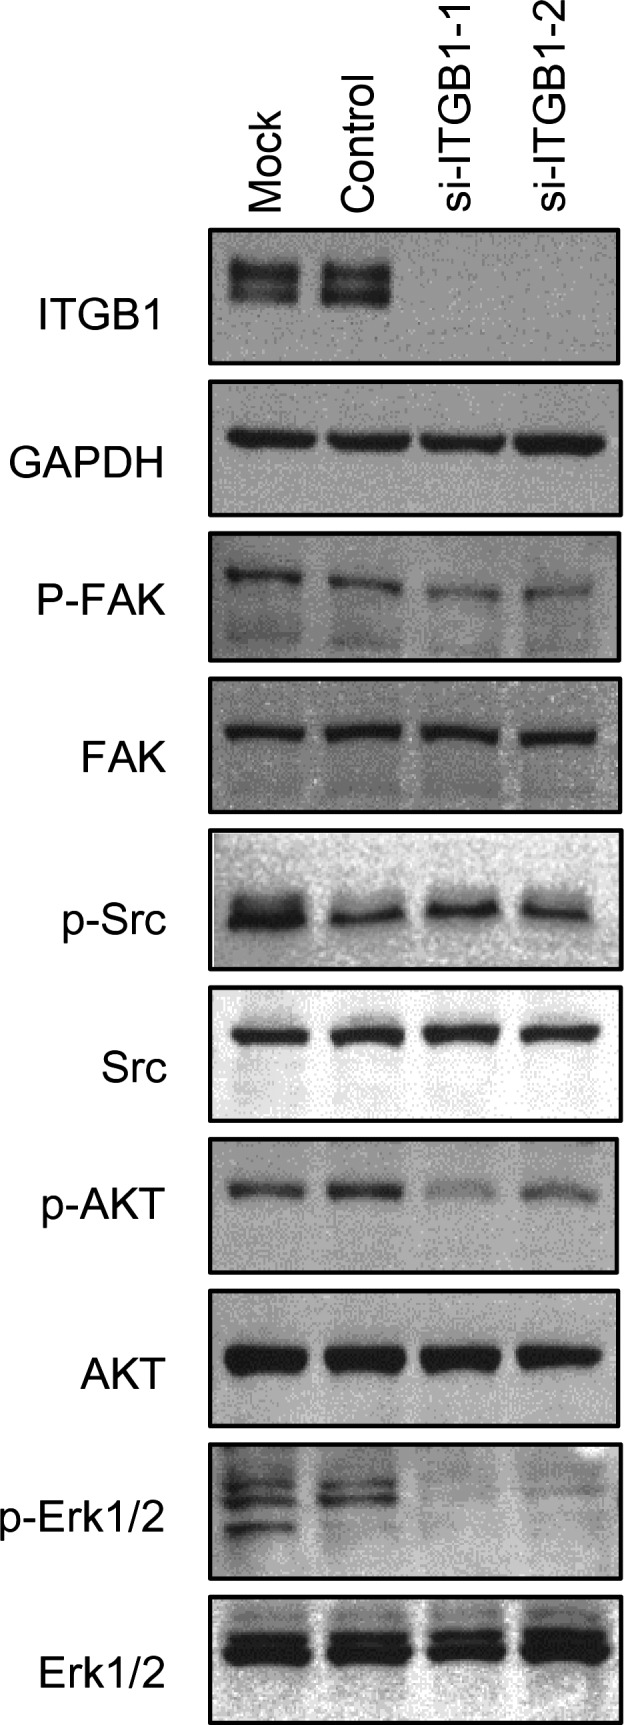
Effects of the knockdown of the gene encoding integrin B1 (ITGB1) on ITGB1 downstream signaling. Knockdown of ITGB1 in PC3 cells reduced the phosphorylation of FAK (Tyr 397), SRC (Tyr 416), AKT (Ser 473), and ERK1/2 (Thr 202/Tyr 204).
Discussion
A growing body of evidence has indicated that normal RNA regulatory mechanisms can be disrupted by the aberrant expression of tumor‐suppressive or oncogenic miRNAs in cancer cells. Therefore, identification of aberrantly expressed miRNAs is an important first step toward elucidating novel miRNA regulatory networks in PCa cells. Based on this, we constructed the miRNA expression signatures of PCa and CRPC using clinical specimens and identified tumor‐suppressive miRNAs regulating novel oncogenic pathways.5, 6, 7, 8, 9, 10, 11, 12 Castration‐resistant PCa is difficult to treat using currently available therapies, and most clinical trials for advanced PCa have shown limited benefits, with disease progression and metastasis to the bone or other sites.3 Thus, understanding the molecular mechanisms of the metastatic signaling pathways underlying PCa using current genomic approaches would help to improve therapies for and prevention of the disease. Our miRNA signatures in PCa revealed that miR‐223 was significantly downregulated in naïve PCa and CRPC tissues. In the present study, we validated the downregulation of miR‐223 in PCa clinical specimens. Additionally, we focused on miR‐223 and investigated the functional roles of miR‐223 and miR‐223‐regulated novel oncogenic pathways in PCa.
In this study, we evaluated the low expression of miR‐223 and the effects of miR‐223 regulation on metastatic signaling pathways in PC3 and PC3M cells, two representative PCa cell lines. PC3M cells were derived from a liver metastasis in a nude mouse bearing a spleen explant of PC3 cells; these cells have increased metastatic ability compared with PC3 cells.20, 21 Restoration of miR‐223 significantly inhibited cancer cell migration and invasion in both PC3 and PC3M cells, suggesting that miR‐223 acts as a tumor‐suppressive miRNA in PCa cells. The tumor‐suppressive function of miR‐223 has been reported in various other types of cancers and is thought to occur through regulation of several oncogenic genes.22, 23 Previous reports have shown that IGF‐1R is directly regulated by miR‐223 and that restoration of miR‐223 inhibits cell proliferation through suppression of downstream phosphoinositol 3‐kinase/AKT/mammalian target of rapamycin pathways.24, 25 Moreover, overexpression of miR‐223 suppresses cell proliferation in colorectal cancer, cervical cancer, and hepatoma cells by targeting forkhead box transcriptional factor 1.26 These findings indicate that miR‐223 is downregulated in cancer cells and functions as a tumor‐suppressive miRNA by targeting oncogenic genes.
In contrast to our data, a recent report showed that expression of miR‐223 is upregulated in PCa tissues and cell lines, including LNCaP, DU145, and PC3 cells.27 Moreover, knockdown of miR‐223 using antisense oligonucleotides leads to G0/G1 arrest and induces apoptosis in LNCaP, DU145, and PC3 cells.27 Another study showed that overexpression of miR‐223 in primary gastric carcinoma is associated with poor metastasis‐free survival.28 Interestingly, overexpression of miR‐223 has been shown to result in acquisition of invasive ability in non‐metastatic gastric cancer cells.28 Thus, these studies of miR‐223 indicate that this miRNA has opposing roles as a tumor suppressor or oncogene in different types of cancer cells. Therefore, it is necessary to investigate the molecular targets and RNA networks regulated by miR‐223 in different types of cancers. Our recent data of CRPC miRNA expression signatures showed that miR‐223 was significantly reduced in CRPC specimens.29 Downregulation of miR‐223 in PCa specimens has been reported by another group based on deep sequencing analysis.12 These data strongly suggest that miR‐223 is frequently reduced in PCa tissues and acts as a tumor suppressor.
Recent bioinformatic predictions have indicated that miRNAs regulate more than 30–60% of protein‐coding genes in the human genome.30, 31 Improving our understanding of miR‐223‐mediated targets and signaling pathways in PCa may provide important insights into the mechanisms of PCa metastasis. We used a combination of genome‐wide gene expression analysis and in silico analysis to identify novel molecular targets and pathways regulated by tumor‐suppressive miRNAs in cancer cells.4, 5, 6, 7, 8, 9, 10, 11 Using this strategy, we identified several pathways and targets regulated by miR‐223 in PCa cells. Among them, we further investigated the ITGA3 and ITGB1 genes, which are involved in focal adhesion and ECM receptor interaction according to KEGG pathway analysis. Integrins are a large family of cell surface receptors composed of specific two subunits (α and β) that bind to ECM components. Most types of cells require integrin‐mediated signaling pathways for proliferation, migration, invasion, and survival.14, 15 ITGA3 and ITGB1 are components of a specific subset of integrins and are expressed PCa cells.14, 15, 32, 33, 34
In this study, we confirmed the upregulation of ITGA3 and ITGB1 in PCa clinical specimens. We showed that ITGA3 and ITGB1 were directly regulated by miR‐223 and that silencing of ITGA3 or ITGB1 significantly inhibited cancer cell migration and invasion in PC3 and PC3M cells. Moreover, our present data showed that knockdown of ITGB1 inhibited downstream signals contributing to cell adhesion and invasion. Overexpression of ITGB1 has been observed in several cancer types in previous studies.35, 36 Additionally, a recent study showed that ITGB1 is activated in highly metastatic PCa cells, but not in PCa cells with low metastatic potential or normal prostate epithelial cells.37 Both ECM ligands and Talin‐1 have been shown to induce the activation of ITGB1 in cancer cells.37, 38 Interestingly, our recent studies showed that tumor‐suppressive miR‐29s and miR‐218 are frequently downregulated in cancer cells, including PCa cells, and cause upregulation of ECM components.9, 17, 39 Moreover, expression of Talin‐1 is increased in metastatic tissues compared with that in primary prostate tumors.40 Thus, these studies indicate that aberrant expression of miRNAs disrupts tightly regulated integrin‐mediated signaling in the prostate and promotes cancer cell migration and invasion.
In conclusion, downregulation of miR‐223 was validated in PCa clinical specimens, and these miRNAs were shown to function as tumor suppressors in PCa. To the best of our knowledge, this is the first report showing that tumor‐suppressive miR‐223 directly targeted ITGA3 and ITGB1 in PCa cells. Moreover, these integrins were upregulated in PCa clinical specimens and contributed to cancer cell migration and invasion. Metastatic progression of PCa significantly impacts the survival of men with prostate cancer. Suppression of ITGA3/ITGB1 signaling in PCa cells may have applications in the development of novel therapies for PCa.
Disclosure Statement
The authors have no conflicts of interest.
Supporting information
Fig. S1. Strategy for selecting target pathways regulated by miR‐223 in prostate cancer cells.
Fig. S2. Effects of ITGA3 and ITGB1 silencing on PC3M prostate cancer cells.
Fig. S3. Effects of cotransfection of ITGA3/miR‐223 or ITGB1/miR‐223 in PC3 prostate cancer cell line.
Fig. S4. Immunohistochemical staining of integrin A3 (ITGA3) or integrin B1 (ITGB1) in prostate cancer by tissue microarray.
Table S1. Clinical characteristics and immunohistochemistry scores of integrins A3 and B1 (ITGA3/ITGB1) in tissue microarray.
Acknowledgments
We are indebted to Dr. Masafumi Kurosumi at the Saitama Cancer Center for helpful suggestions with the pathological data presented in this manuscript. This study was supported by the Japanese Society for the Promotion of Science (KAKENHI), grant numbers (C) 15K10801, (C) 15K20070, (C) 15K20071, and (B) 25293333.
Cancer Sci 107 (2016) 84–94
Funding Information
Japan Society for the Promotion of Science.
References
- 1. Siegel RL, Miller KD, Jemal A. Cancer statistics, 2015. CA Cancer J Clin 2015; 65: 5–29. [DOI] [PubMed] [Google Scholar]
- 2. Sridhar SS, Freedland SJ, Gleave ME et al Castration‐resistant prostate cancer: from new pathophysiology to new treatment. Eur Urol 2014; 65: 289–99. [DOI] [PubMed] [Google Scholar]
- 3. Sturge J, Caley MP, Waxman J. Bone metastasis in prostate cancer: emerging therapeutic strategies. Nat Rev Clin Oncol 2011; 8: 357–68. [DOI] [PubMed] [Google Scholar]
- 4. Fuse M, Kojima S, Enokida H et al Tumor suppressive microRNAs (miR‐222 and miR‐31) regulate molecular pathways based on microRNA expression signature in prostate cancer. J Hum Genet 2012; 57: 691–99. [DOI] [PubMed] [Google Scholar]
- 5. Goto Y, Kojima S, Nishikawa R et al The microRNA‐23b/27b/24‐1 cluster is a disease progression marker and tumor suppressor in prostate cancer. Oncotarget 2014; 5: 7748–59. [DOI] [PMC free article] [PubMed] [Google Scholar]
- 6. Kojima S, Enokida H, Yoshino H et al The tumor‐suppressive microRNA‐143/145 cluster inhibits cell migration and invasion by targeting GOLM1 in prostate cancer. J Hum Genet 2014; 59: 78–87. [DOI] [PubMed] [Google Scholar]
- 7. Nishikawa R, Goto Y, Sakamoto S et al Tumor‐suppressive microRNA‐218 inhibits cancer cell migration and invasion via targeting of LASP1 in prostate cancer. Cancer Sci 2014; 105: 802–11. [DOI] [PMC free article] [PubMed] [Google Scholar]
- 8. Goto Y, Nishikawa R, Kojima S et al Tumour‐suppressive microRNA‐224 inhibits cancer cell migration and invasion via targeting oncogenic TPD52 in prostate cancer. FEBS Lett 2014; 588: 1973–82. [DOI] [PubMed] [Google Scholar]
- 9. Nishikawa R, Goto Y, Kojima S et al Tumor‐suppressive microRNA‐29s inhibit cancer cell migration and invasion via targeting LAMC1 in prostate cancer. Int J Oncol 2014; 45: 401–10. [DOI] [PubMed] [Google Scholar]
- 10. Fuse M, Nohata N, Kojima S et al Restoration of miR‐145 expression suppresses cell proliferation, migration and invasion in prostate cancer by targeting FSCN1. Int J Oncol 2011; 38: 1093–101. [DOI] [PubMed] [Google Scholar]
- 11. Kojima S, Chiyomaru T, Kawakami K et al Tumour suppressors miR‐1 and miR‐133a target the oncogenic function of purine nucleoside phosphorylase (PNP) in prostate cancer. Br J Cancer 2012; 106: 405–13. [DOI] [PMC free article] [PubMed] [Google Scholar]
- 12. Szczyrba J, Loprich E, Wach S et al The microRNA profile of prostate carcinoma obtained by deep sequencing. Mol Cancer Res 2010; 8: 529–38. [DOI] [PubMed] [Google Scholar]
- 13. Goto Y, Kurozumi A, Enokida H, Ichikawa T, Seki N. Functional significance of aberrantly expressed microRNAs in prostate cancer. Int J Urol 2015; 22: 242–52. [DOI] [PubMed] [Google Scholar]
- 14. Gilcrease MZ. Integrin signaling in epithelial cells. Cancer Lett 2007; 247: 1–25. [DOI] [PubMed] [Google Scholar]
- 15. Givant‐Horwitz V, Davidson B, Reich R. Laminin‐induced signaling in tumor cells. Cancer Lett 2005; 223: 1–10. [DOI] [PubMed] [Google Scholar]
- 16. Hidaka H, Seki N, Yoshino H et al Tumor suppressive microRNA‐1285 regulates novel molecular targets: aberrant expression and functional significance in renal cell carcinoma. Oncotarget 2012; 3: 44–57. [DOI] [PMC free article] [PubMed] [Google Scholar]
- 17. Kinoshita T, Nohata N, Hanazawa T et al Tumour‐suppressive microRNA‐29s inhibit cancer cell migration and invasion by targeting laminin–integrin signalling in head and neck squamous cell carcinoma. Br J Cancer 2013; 109: 2636–45. [DOI] [PMC free article] [PubMed] [Google Scholar]
- 18. Yoshino H, Chiyomaru T, Enokida H et al The tumour‐suppressive function of miR‐1 and miR‐133a targeting TAGLN2 in bladder cancer. Br J Cancer 2011; 104: 808–18. [DOI] [PMC free article] [PubMed] [Google Scholar]
- 19. Nohata N, Hanazawa T, Kikkawa N et al Tumour suppressive microRNA‐874 regulates novel cancer networks in maxillary sinus squamous cell carcinoma. Br J Cancer 2011; 105: 833–41. [DOI] [PMC free article] [PubMed] [Google Scholar]
- 20. Kozlowski JM, Fidler IJ, Campbell D, Xu ZL, Kaighn ME, Hart IR. Metastatic behavior of human tumor cell lines grown in the nude mouse. Cancer Res 1984; 44: 3522–29. [PubMed] [Google Scholar]
- 21. Sobel RE, Sadar MD. Cell lines used in prostate cancer research: a compendium of old and new lines–part 1. J Urol 2005; 173: 342–59. [DOI] [PubMed] [Google Scholar]
- 22. Xu J, Yao Q, Hou Y et al MiR‐223/Ect2/p21 signaling regulates osteosarcoma cell cycle progression and proliferation. Biomed Pharmacother 2013; 67: 381–86. [DOI] [PubMed] [Google Scholar]
- 23. Birnie KA, Yip YY, Ng DC et al Loss of mir‐223 and JNK signalling contribute to elevated stathmin in malignant pleural mesothelioma. Mol Cancer Res 2015; 13: 1106–18. [DOI] [PubMed] [Google Scholar]
- 24. Jia CY, Li HH, Zhu XC et al MiR‐223 suppresses cell proliferation by targeting IGF‐1R. PLoS ONE 2011; 6: e27008. [DOI] [PMC free article] [PubMed] [Google Scholar]
- 25. Bruchim I, Werner H. Targeting IGF‐1 signaling pathways in gynecologic malignancies. Expert Opin Ther Targets 2013; 17: 307–20. [DOI] [PubMed] [Google Scholar]
- 26. Wu L, Li H, Jia CY et al MicroRNA‐223 regulates FOXO1 expression and cell proliferation. FEBS Lett 2012; 586: 1038–43. [DOI] [PubMed] [Google Scholar]
- 27. Wei Y, Yang J, Yi L et al MiR‐223‐3p targeting SEPT6 promotes the biological behavior of prostate cancer. Sci Rep 2014; 4: 7546. [DOI] [PMC free article] [PubMed] [Google Scholar]
- 28. Li X, Zhang Y, Zhang H et al miRNA‐223 promotes gastric cancer invasion and metastasis by targeting tumor suppressor EPB41L3. Mol Cancer Res 2011; 9: 824–33. [DOI] [PubMed] [Google Scholar]
- 29. Goto Y, Kojima S, Nishikawa R et al MicroRNA expression signature of castration‐resistant prostate cancer: the microRNA‐221/222 cluster functions as a tumour suppressor and disease progression marker. Br J Cancer 2015; 113: 1055–65. [DOI] [PMC free article] [PubMed] [Google Scholar]
- 30. Filipowicz W, Bhattacharyya SN, Sonenberg N. Mechanisms of post‐transcriptional regulation by microRNAs: are the answers in sight? Nat Rev Genet 2008; 9: 102–14. [DOI] [PubMed] [Google Scholar]
- 31. Friedman RC, Farh KK, Burge CB, Bartel DP. Most mammalian mRNAs are conserved targets of microRNAs. Genome Res 2009; 19: 92–105. [DOI] [PMC free article] [PubMed] [Google Scholar]
- 32. Goel HL, Alam N, Johnson IN, Languino LR. Integrin signaling aberrations in prostate cancer. Am J Transl Res 2009; 1: 211–20. [PMC free article] [PubMed] [Google Scholar]
- 33. Goel HL, Li J, Kogan S, Languino LR. Integrins in prostate cancer progression. Endocr Relat Cancer 2008; 15: 657–64. [DOI] [PMC free article] [PubMed] [Google Scholar]
- 34. Fornaro M, Manes T, Languino LR. Integrins and prostate cancer metastases. Cancer Metastasis Rev 2001; 20: 321–31. [DOI] [PubMed] [Google Scholar]
- 35. Han TS, Hur K, Xu G et al MicroRNA‐29c mediates initiation of gastric carcinogenesis by directly targeting ITGB1. Gut 2015; 64: 203–14. [DOI] [PMC free article] [PubMed] [Google Scholar]
- 36. Liu LX, Jiang HC, Liu ZH et al Integrin gene expression profiles of human hepatocellular carcinoma. World J Gastroenterol 2002; 8: 631–37. [DOI] [PMC free article] [PubMed] [Google Scholar]
- 37. Lee YC, Jin JK, Cheng CJ et al Targeting constitutively activated beta1 integrins inhibits prostate cancer metastasis. Mol Cancer Res 2013; 11: 405–17. [DOI] [PMC free article] [PubMed] [Google Scholar]
- 38. Jin JK, Tien PC, Cheng CJ et al Talin1 phosphorylation activates beta1 integrins: a novel mechanism to promote prostate cancer bone metastasis. Oncogene 2015; 34: 1811–21. [DOI] [PMC free article] [PubMed] [Google Scholar]
- 39. Kinoshita T, Hanazawa T, Nohata N et al Tumor suppressive microRNA‐218 inhibits cancer cell migration and invasion through targeting laminin‐332 in head and neck squamous cell carcinoma. Oncotarget 2012; 3: 1386–400. [DOI] [PMC free article] [PubMed] [Google Scholar]
- 40. Sakamoto S, McCann RO, Dhir R, Kyprianou N. Talin1 promotes tumor invasion and metastasis via focal adhesion signaling and anoikis resistance. Cancer Res 2010; 70: 1885–95. [DOI] [PMC free article] [PubMed] [Google Scholar]
Associated Data
This section collects any data citations, data availability statements, or supplementary materials included in this article.
Supplementary Materials
Fig. S1. Strategy for selecting target pathways regulated by miR‐223 in prostate cancer cells.
Fig. S2. Effects of ITGA3 and ITGB1 silencing on PC3M prostate cancer cells.
Fig. S3. Effects of cotransfection of ITGA3/miR‐223 or ITGB1/miR‐223 in PC3 prostate cancer cell line.
Fig. S4. Immunohistochemical staining of integrin A3 (ITGA3) or integrin B1 (ITGB1) in prostate cancer by tissue microarray.
Table S1. Clinical characteristics and immunohistochemistry scores of integrins A3 and B1 (ITGA3/ITGB1) in tissue microarray.