

Abstract
Antiangiogenic agents transiently normalize tumor vessel structure and improve vessel function, thereby providing a window of opportunity for enhancing the efficacy of chemotherapy or radiotherapy. Currently, there are no reliable predictors or markers reflecting this vessel normalization window during antiangiogenic therapy. Apelin, the expression of which is regulated by hypoxia, and which has well‐described roles in tumor progression, is an easily measured secreted protein. Here, we show that apelin can be used as a marker for the vessel normalization window during antiangiogenic therapy. Mice bearing s.c. tumors resulting from inoculation of the colon adenocarcinoma cell line HT29 were treated with a single injection of bevacizumab, a mAb neutralizing vascular endothelial growth factor. Tumor growth, vessel density, pericyte coverage, tumor hypoxia, and small molecule delivery were determined at four different times after treatment with bevacizumab (days 1, 3, 5, and 8). Tumor growth and vessel density were significantly reduced after bevacizumab treatment, which also significantly increased tumor vessel maturity, and improved tumor hypoxia and small molecule delivery between days 3 and 5. These effects abated by day 8, suggesting that a time window for vessel normalization was opened between days 3 and 5 during bevacizumab treatment in this model. Apelin mRNA expression and plasma apelin levels decreased transiently at day 5 post‐treatment, coinciding with vessel normalization. Thus, apelin is a potential indicator of the vessel normalization window during antiangiogenic therapy.
Keywords: Angiogenesis, apelin, hypoxia, tumor, vascular normalization
It is widely believed that antiangiogenic agents causing regression of tumor vessels reduce the blood supply to tumors, and thus starve them of oxygen and nutrients.1 Because this leads to tumor hypoxia and decreases tumor blood perfusion, antiangiogenic therapy would be anticipated to render many chemotherapy and radiotherapy schedules less effective.2 However, paradoxically, emerging data suggest that antiangiogenic agents enhance rather than diminish the anticancer effects of radiation or chemotherapy both in mice3, 4, 5 and humans.6 Therefore, a new concept has emerged that antiangiogenic therapy transiently normalizes abnormal tumor vasculature both structurally and functionally.7, 8 These normalized vessels are less leaky, less dilated, and less tortuous, with a more normal basement membrane and greater coverage by pericytes.7, 8 Therefore, delivery of cancer drugs is improved by the normalization of permeability and radiotherapy can act more effectively by the oxygenation of the tumor microenvironment where blood perfusion is induced.7, 8, 9, 10, 11 A better understanding of the vessel normalization time window would aid in the design of optimal scheduling for combination therapies.7, 8 However, there are currently no reliable predictors or markers for identifying the tumor vessel normalization window during antiangiogenic therapy.
Apelin, first isolated from bovine stomach tissue extracts in 1998, has been identified as the endogenous ligand of APJ, a G‐protein‐coupled receptor that had been considered an orphan receptor for many years.12, 13 Apelin/APJ signaling regulates a wide range of physiological and pathological actions on cardiovascular function,14, 15, 16 fluid homeostasis,17, 18 glycolipid metabolism,19, 20 HIV pathology,21 and also on the vasculature.22, 23, 24, 25, 26 Apelin is overexpressed in several human cancers including glioblastoma multiforme,27 colon adenocarcinoma,28 non‐small‐cell lung cancer,29 oral squamous cell carcinoma,30 prostate cancer,31 and hepatocellular carcinoma.32 High levels of apelin expression are associated with poor prognosis in numerous cancer types.29, 30, 31 Hypoxia, a major feature of solid tumors, can promote malignant progression by enhancing the invasive and metastatic potential of cancer cells and can trigger tumor angiogenesis by stimulating the secretion of proangiogenic factors such as vascular endothelial growth factor (VEGF).33, 34 A hypoxia response element/hypoxia‐inducible factor‐1α (HIF‐1α) binding site is located within the first intron of the apelin gene, and it has been reported that apelin expression induced by hypoxia is mediated by HIF‐1α.35
Antiangiogenic agents decrease rather than increase hypoxia during the time window of tumor vascular normalization.36 However, sustained antiangiogenic therapy eventually leads to excess tumor vessel regression and worsens tumor hypoxia.36, 37 Therefore, we hypothesized that apelin expression would be transiently decreased during the vessel normalization window and restored again at the time of excess tumor vessel regression which is mediated by tumor hypoxia during antiangiogenic therapy. In the present study, an ectopically transplanted human colorectal adenocarcinoma (HT29) was used as the tumor model. We analyzed whether an antiangiogenic agent normalizes tumor vasculature in this model, and related this to how apelin expression is altered in the tumor microenvironment after such treatment.
Materials and Methods
Cell line
The HT29 human colorectal adenocarcinoma cell line was purchased from ATCC (Manassas, VA, USA). Cells were cultured in RPMI‐1640 (Sigma, St. Louis, MO, USA) supplemented with 10% FBS (Equitech‐Bio, Kerrville, TX, USA) and 1% penicillin/streptomycin (Invitrogen, Carlsbad, CA, USA). Cells were routinely maintained in 5% CO2 and 95% air at 37°C.
Mouse xenografts
6 or 8‐week‐old female KSN nude mice (SLC, Shizuoka, Japan) were injected s.c. in the right flank with 1 × 10⁶ HT29 cells in a volume of 100 μL PBS. Tumor volumes were measured in two dimensions with calipers and calculated with the formula (L × W 2) × 0.5, where L is length and W is width of the tumor. Mice were housed in environmentally controlled rooms of the animal experimentation facility approved by the Animal Care Committee of Osaka University (Osaka, Japan). All experiments were carried out in accordance with the guidelines of Osaka University Committee for animal and recombinant DNA experiments.
Drug administration and study design
For treatment with bevacizumab (humanized anti‐VEGF mAb; Genentech South San Francisco, CA), when tumors reached a volume of 45–55 mm3, mice were given a single i.p. injection of 5 mg/kg (designated as day 0). In order to study the time course of the effects of bevacizumab, mice were killed at days 1, 3, 5, or 8 after bevacizumab injection (n = 3 per time point). The experiment was carried out in duplicate. For combination treatment, a single i.p. injection of 5 mg/kg bevacizumab was given when tumors reached 45–55 mm3 to induce vessel normalization before treatment with 5‐fluorouracil (5‐FU; Kyowa Kirin, Tokyo, Japan). Treatment with suboptimal doses of 5‐FU (i.p., 20 mg/kg every day) for 5 days began 1 day after starting bevacizumab. Control mice were injected with saline. Therapeutic efficacy was evaluated by measuring tumor growth.
Immunofluorescence
Dissected tumor tissues were immediately fixed in 4% paraformaldehyde overnight and embedded in Tissue‐Tek OCT compound (Sakura Finetek, Tokyo, Japan), and sections of several thicknesses (8–12 μm) were prepared. For the determination of tumor vessel density, sections were incubated with a mAb against the endothelial cell‐specific marker CD31 (1:200; BD Pharmingen, Franklin Lakes, NJ, USA), followed by an anti‐rat IgG Alexa Fluor 488 or 546 secondary antibody (1:400; Invitrogen). For the staining of α‐smooth muscle actin (α‐SMA)‐positive mesenchymal cells, sections were incubated with Cy3‐conjugated mouse anti‐α‐SMA antibody (1:400; Sigma).
Tumor hypoxia
To examine hypoxia, mice were given the hypoxia marker pimonidazole HCL (60 mg/mL) (Hypoxyprobe‐1 Plus Kit; Hypoxyprobe, Burlington, MA, USA) i.p. 2 h before they were killed. Pimonidazole is reductively activated in hypoxic cells that have a pO2 level ≤10 mmHg and forms stable adducts with thiol groups in proteins, peptides, and amino acids. The formation of pimonidazole protein adducts was detected by FITC‐conjugated antibody (1:200) provided in the Hypoxyprobe‐1 Plus Kit.
Small molecule delivery
Small molecule delivery was assessed by analyzing the distribution of low molecular weight fluorescent probe Hoechst 33342 (Sigma) into tumors.38 Mice were injected with Hoechst 33342 (40 mg/kg) into the tail vein 1 min prior to being killed. Sections were then examined under fluorescence microscopy.
Image acquisition and analysis
Tumor sections were analyzed under a Leica DM5500 B upright microscope (Leica, Wetzlar, Germany). To assess vessel density and α‐SMA‐positive cell coverage of endothelial cells, images were taken from eight random fields per tumor section at 20× magnification and analyzed with NIH ImageJ software (http://rsb.info.nih.gov/ij/). Vessel density was determined by counting the number of CD31‐positive vessels per field. Vessels with the smallest luminal diameter still >7 μm (the size of an erythrocyte) were defined as large vessels.39 The α‐SMA‐positive cell coverage was quantified as those vessels surrounded by α‐SMA‐positive areas per field. A vessel maturity index was calculated as the ratio of the α‐SMA‐positive area to the CD31‐positive area. To assess the fraction of tumor that was hypoxic and Hoechst 33342 delivery, images of the whole tumor section were captured at 5× magnification. Pimonidazole‐ and Hoechst 33342‐positive areas were quantified using NIH ImageJ software. The hypoxic fraction or Hoechst 33342‐positive fraction was calculated as the percentage of total tumor area. Necrotic areas were excluded.
Isolation and sorting of endothelial cells
After resection, tumor or skin tissues were finely minced with scissors and sequentially digested with Dispase II (Godo Shusei, Chiba, Japan), collagenase type I (Wako, Osaka, Japan) and collagenase type II (Worthington Biochemical Corp., Lakewood, NJ, USA) in a 50‐mL tube. In each step the tube was incubated in a 37°C water bath for 15 min and then vigorously shaken for 10 min to dissolve the tissues. The final cell suspension was filtered through a 70‐μm strainer (BD Biosciences, Erembodegem, Belgium). Erythrocytes were lysed on ice in 1 mL ACK buffer (0.15 M NH4Cl, 10 mM KHCO3, and 0.1 mM Na2‐EDTA) for 10 min. Cells were resuspended and then stained with FITC‐conjugated anti‐CD31 mAb and phycoerythrin‐conjugated anti‐CD45 mAb (BD Pharmingen). CD31+CD45− ECs were sorted using a FACSAria (BD Biosciences, San Diego, CA).
Real‐time quantitative PCR
Total RNA was extracted from tumor tissues or ECs with the RNeasy Mini Kit (Qiagen, Hilden, Germany) according to the manufacturer's instructions. Total RNA was converted to cDNA by RT with the PrimeScript RT reagent Kit (Takara, Kyoto, Japan). Complementary DNA was used in real‐time quantification with Platinum SYBR green qPCR SuperMix‐UDC (Invitrogen) and the program was run on an Mx3000P QPCR System (Stratagene, La Jolla, CA, USA). All reactions were run in duplicate. Each target gene was quantified relative to the expression of the reference gene (GAPDH). Primer sequences of the reference and target genes were as follows: mouse GAPDH, 5′‐TGG CAA AGT GGA GAT TGT TGC C‐3′ (forward), 5′‐AAG ATG GTG ATG GGC TTC CCG‐3′ (reverse); mouse Apelin, 5′‐GTG CCC TCC CGG TGC CGG TCT CT‐3′ (forward), 5′‐GAG ACC ACG CCA TTA GAG GAA CT‐3′ (reverse). Fold‐changes were calculated using the comparative CT method.
Protein extraction and Western blot analysis
Tumor tissues were lysed with RIPA lysis buffer (Santa Cruz Biotechnology, Santa Cruz, CA, USA). Protein concentrations were measured using BCA protein assay kits (Takara). Proteins were electrophoretically separated on 7.5% SDS‐PAGE gels. Forty micrograms of protein were loaded per lane. Proteins were then transferred to PVDF membranes, and Western blotting carried out to detect HIF‐1α. Anti‐HIF‐1α mouse monoclonal IgG2b (1:500, NB100‐105; Novus Biologicals, Littleton, CO, USA) was used as the primary antibody. Anti‐mouse IgG‐HRP (1:1000; Jackson ImmunoResearch Laboratories, West Grove, PA, USA) was used as the secondary antibody. Horseradish peroxidase was detected with the ECL system (Amersham Biosciences, GE Healthcare, Diegem, Belgium) using an imaging densitometer LAS‐3000 mini system (Fujifilm, Kanagawa, Japan).
Plasma apelin ELISA
Blood was collected in test tubes with EDTA. Samples were centrifuged at 2000 g for 15 min and stored at −80°C until analysis. Levels of apelin in plasma were measured using the Apelin‐12 Extraction‐Free EIA Kit (Human, Rat, Mouse; Phoenix Pharmaceuticals, Burlingame, CA, USA) according to the manufacturer's instructions.
Statistical analysis
Data are expressed as mean ± SEM. The principal statistical test was Student's t‐test (two tailed). P < 0.05 was considered to be statistically significant.
Results
Bevacizumab delays tumor growth
To determine the time window for tumor vessel normalization in the HT29 xenograft tumor model, mice received a single i.p. injection of 5 mg/kg bevacizumab when the tumor volume reached 45–55 mm3 following inoculation of cancer cells. Tumors were then harvested 1, 3, 5, and 8 days after bevacizumab treatment (Fig. 1a) and analyzed as described below. A single injection of bevacizumab significantly delayed tumor growth at day 3 (72.77 ± 6.6 vs 90.9 ± 10.5 mm3, P = 0.038), day 5 (88.8 ± 9.2 vs 124.7 ± 12.7 mm3, P = 0.026), and day 8 (106.5 ± 9.8 vs 182.07 ± 20.2 mm3, P = 0.0036), suggesting that bevacizumab alone has antitumor effects in the HT29 xenograft tumor model (Fig. 1b).
Figure 1.
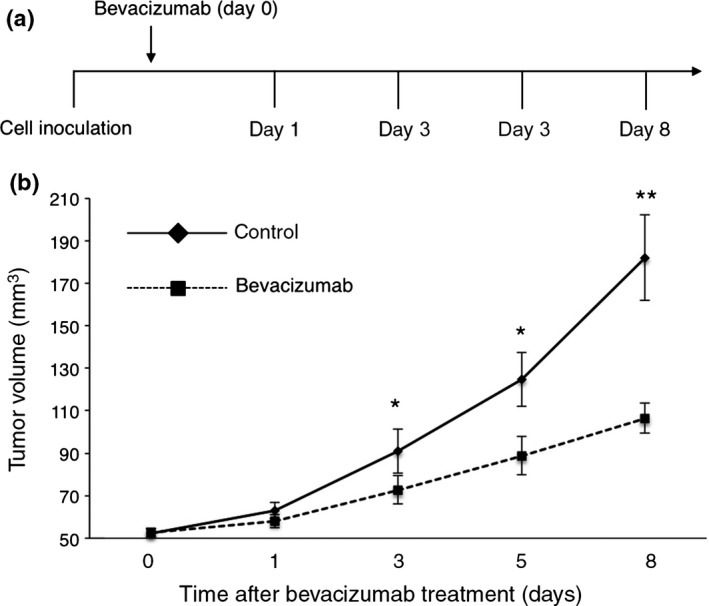
Effect of bevacizumab on tumor growth. (a) Schematic representation of the study design. HT29‐bearing mice received a single injection of bevacizumab (5 mg/kg) when tumor volume reached 45–55 mm3. Evaluation of tumor vessel structure and function was carried out on days 1, 3, 5, and 8. (b) Quantitative evaluation of tumor growth on treatment with bevacizumab (n = 3 per time point) and saline (n = 3). Bevacizumab treatment significantly delayed tumor growth at days 3 (P = 0.038), 5 (P = 0.026), and 8 (P = 0.0036). Data are mean ± SEM. *P < 0.05; **P < 0.01.
Bevacizumab reduces vessel density and remodels vessel morphology
To evaluate the effect of bevacizumab on tumor vessel morphology, tumor sections were stained with the endothelial cell‐specific marker CD31 and/or α‐SMA, a pericyte marker. CD31 staining revealed that vessels in control tumors were more dilated and tortuous than vessels in bevacizumab‐treated tumors (Fig. 2a,b). There was no significant difference in vessel density between the bevacizumab‐treated tumors at day 1 and control tumors (38.29 ± 1.63 vs 38.95 ± 2.29 n/field), but a significant decrease in vessel density was observed at day 3 (30.20 ± 1.82 n/field, P = 0.006), which persisted at day 5 (21.00 ± 1.08 n/field, P = 0.0002), and day 8 (14.5 ± 1.125 n/field, P = 0.00007) after bevacizumab treatment (Fig. 2a,c).
Figure 2.
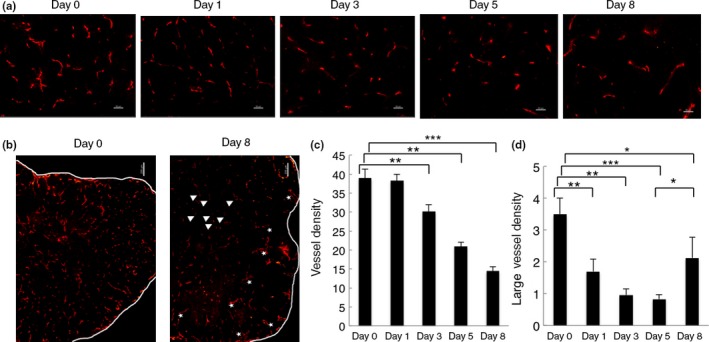
Effect of bevacizumab on vessel density and vessel morphology. (a) Representative images of HT29 tumor sections from control (day 0, n = 3) and bevacizumab‐treated groups (day 1, 3, 5, and 8, n = 3). Sections were stained with anti‐CD31 antibody (red). Magnification, ×20. Scale bar = 50 μm. (b) Representative images of tumor vessels of day 0 and day 8. Tumor vessels were collapsed (arrows) in the central region but dilated (asterisks) again in the periphery of the tumors at day 8. Magnification, ×5. Scale bar = 200 μm. (c,d) Quantification of vessel density (c) and large vessel density (d). Eight random fields were assessed. Large vessels refer to vessels with their smallest luminal diameter larger than the size of an erythrocyte (≥7 μm). All quantitative data are mean ± SEM. *P < 0.05; **P < 0.01; ***P < 0.001.
In contrast, the number of dilated vessels (defined as large vessel density) was significantly decreased in bevacizumab‐treated tumors at day 1 (1.73 ± 0.38 n/field, P = 0.007), day 3 (0.95 ± 0.19 n/field, P = 0.001), and day 5 (0.83 ± 0.14 n/field, P = 0.0008) compared with the control tumors (3.5 ± 0.5 n/field) (Fig. 2a,d). However, at day 8 (2.1 ± 0.64 n/field, P = 0.04), vessels were collapsed in the central region but dilated again in the periphery of the tumors, compared with vessels at days 3 and 5. (Fig. 2b,d). On day 10 after bevacizumab treatment, vascular density was less abundant compared to that observed in tumors on day 8 (data not shown).
Next, we studied the α‐SMA‐positive cells covering the blood vessels in tumors. As shown in Figure 3(a), α‐SMA‐positive cells were frequently observed at the perivascular area in HT29 xenograft tumors before treatment with bevacizumab (day 0); however, they were not tightly adhered to the endothelial cells (Fig. 3a). After treatment with bevacizumab, the α‐SMA‐positive cells showed a more uniform distribution and came into closer contact with endothelial cells than in control tumors at days 3 and 5 (Fig. 3a,b). However, at day 8, as the number of blood vessels decreased (Fig. 2a,b), the number of α‐SMA‐positive cells also decreased (Fig. 3a,b). We defined blood vessels with adherent α‐SMA‐positive cells as mature blood vessels and calculated a vessel maturity index as the ratio of the α‐SMA‐positive area to the CD31‐positive area. This vessel maturity index significantly increased at days 3 and 5 due to the decrease of CD31 staining and slight increase of α‐SMA staining, although the latter was not statistically significant (Fig. 3b,c). These findings suggest that bevacizumab can transiently normalize tumor vessel morphology, as judged by less dilation and more α‐SMA‐positive cell accumulation near endothelial cells.
Figure 3.
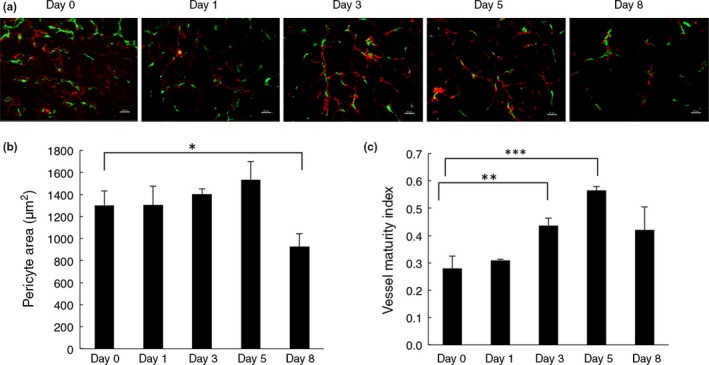
Effect of bevacizumab on pericyte coverage. (a) Tumor sections from control mice (day 0, n = 3) and bevacizumab‐treated mice (day 1, 3, 5, and 8, n = 3) were stained with anti‐CD31 antibody (green) and anti‐α‐smooth muscle actin (α‐SMA) antibody (red). Magnification, ×20. Scale bar = 50 μm. (b) Quantification of α‐SMA‐positive areas around CD31‐positive blood vessels per field. Data represent the mean ± SEM. *P = 0.019. (c) Vessel maturity index is the ratio of α‐SMA‐positive areas to CD31‐positive areas. A significant increase in vessel maturity index in bevacizumab‐treated tumors was observed at days 3 (P = 0.007) and 5 (P = 0.0004), slightly restored by day 8 (P = 0.076). Eight random fields were assessed. All quantitative data are mean ± SEM. *P < 0.05; **P < 0.01; ***P < 0.001.
Bevacizumab improves tumor hypoxia and Hoechst 33342 delivery
The morphological changes of tumor blood vessels following anti‐angiogenic treatment would be expected to be accompanied by functional changes. Therefore, we assessed vessel function regarding tumor oxygenation and small molecule delivery. Evaluating hypoxia by pimonidazole staining, we found that tumor hypoxia was significantly reduced at days 3 and 5, especially at day 5, but increased again at day 8 after bevacizumab treatment (Fig. 4a,b). Hoechst 33342 (Hoechst), a low molecular weight fluorescent DNA binding dye, can be used as a marker of tumor perfusion37 as well as to determine vessel leakage.40 Here, we analyzed the delivery and distribution of Hoechst 33342 to evaluate vessel function.38 In line with the published data, the Hoechst and pimonidazole staining showed an inverse relationship.41 There was a significant increase in dye delivery into tumor parenchyma between days 3 and 5 after bevacizumab treatment. At day 5, in particular, bevacizumab‐treated tumors showed a more homogeneous distribution of the dye, compared to its low, heterogeneous distribution in control tumors. However, the delivery of Hoechst dye was significantly impaired at day 8 and it was mostly observed in the periphery of the tumors (Fig. 4a,c). These data indicate that bevacizumab normalizes tumor vessels, resulting in an improvement in vessel function at days 3 and 5 post‐treatment in this HT29 tumor xenograft model.
Figure 4.
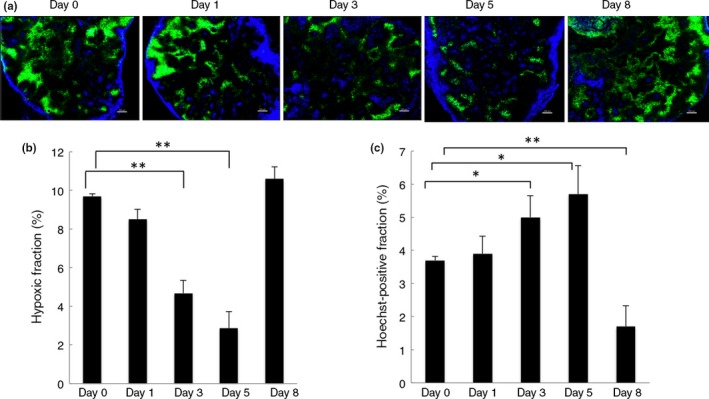
Effect of bevacizumab on tumor hypoxia and Hoechst dye delivery. (a) Representative immunofluorescence images of Hoechst 33342 (blue) and hypoxia marker pimonidazole stained area (green) in sections from control mice (day 0, n = 3) and bevacizumab‐treated mice (days 1, 3, 5, and 8, n = 3). Images were scanned at ×5 magnification. Scale bar = 200 μm. (b) Quantification of pimonidazole‐positive areas as a percentage of the whole tumor area. Hypoxia was significantly decreased at day 3 (P = 0.007) and day 5 (P = 0.003). Data were compared with day 0. Data represent the mean ± SEM. **P < 0.01. (c) Quantification of Hoechst‐positive areas as a percentage of the whole tumor area. Hoechst delivery was significantly increased in bevacizumab‐treated tumors at days 3 (P = 0.02) and 5 (P = 0.01), but decreased at day 8 (P = 0.005). All quantitative data are mean ± SEM. *P < 0.05; **P < 0.01.
Bevacizumab increases the efficacy of chemotherapy
It has been suggested that changes of vessel structure and function could enhance the efficacy of chemotherapy.7, 8 Therefore, we explored the effect of combined treatment with bevacizumab and 5‐FU on HT29 xenograft growth. We divided mice into four groups when tumor volumes reached 45–55 mm3 after tumor cell inoculation as follows: (i) control; (ii) bevacizumab only; (iii) 5‐FU only; and (iv) bevacizumab plus 5‐FU. For combination treatment, bevacizumab was injected 1 day prior to the administration of 5‐FU to induce vessel normalization. 5‐Fluorouracil was then injected daily for 5 days after bevacizumab treatment (Fig. 5a). As shown in Figure 5(b,c), the combination of bevacizumab with 5‐FU increased the anticancer effect on HT29 xenografts compared with 5‐FU or bevacizumab monotherapy, suggesting that normalization of vessels by bevacizumab improves 5‐FU delivery, in line with the observed increased Hoechst dye delivery.
Figure 5.
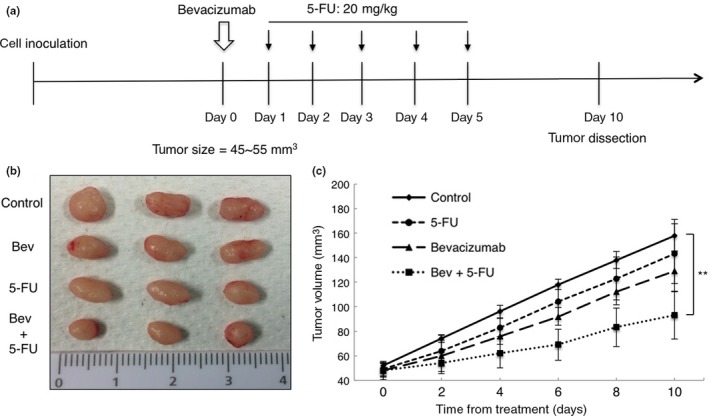
Effect of bevacizumab on tumor chemosensitivity. (a) Schematic representation of combined therapy schedule. (b) Representative images of HT29 tumors resected from mice of control, bevacizumab (Bev) alone, 5‐fluorouracil (5‐FU) alone, and bevacizumab plus 5‐FU groups on day 10 (n = 3 per group). (c) Tumor growth curves. Tumor volume from animals treated with bevacizumab + 5‐FU was 92.99 ± 19.37 mm3 on day 10, compared with those from control, 5‐FU alone, and bevacizumab alone, which were 158.1 ± 13.29 mm3 (P = 0.0086), 143.19 ± 24.4 mm3 (P = 0.04), and 129.15 ± 16.54 mm3 (P = 0.06), respectively. Data represent mean ± SEM. **P < 0.01.
Apelin expression is altered during the vessel normalization time window
It has been reported that apelin is overexpressed in human colon adenocarcinomas.28 Apelin expression has been reported to increase in endothelial cells under hypoxia.35 In our model, we could not detect apelin mRNA in tumor cells sorted from tumor tissues (data not shown). We found that apelin mRNA expression was overexpressed in endothelial cells of tumor tissues compared to those of normal skin tissues; however, there were no significant changes in apelin mRNA expression after growth of HT29 tumor (Fig. 6a). To investigate whether apelin can be used as a marker to determine the vessel normalization window, we then assessed changes in apelin expression in tumor tissues and plasma at days 0, 5, and 8 after bevacizumab treatment. Apelin mRNA expression was decreased at day 5 but restored to the control levels at day 8 (Fig. 6b). Plasma apelin levels were also significantly decreased at day 5 and increased again at day 8 after bevacizumab treatment (Fig. 6c).
Figure 6.
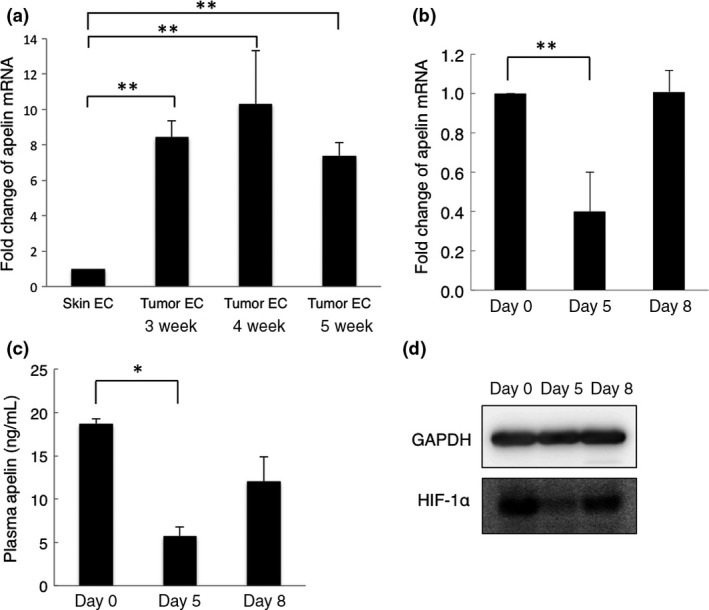
Apelin and hypoxia‐inducible factor‐1α (HIF‐1α) expression during the vessel normalization window. (a) Quantitative RT‐PCR analysis of mouse apelin mRNA expression in endothelial cells from growing tumor tissues (n = 3 each time point) and normal skin tissues (n = 3). Data are mean ± SEM. **P < 0.01. W, weeks. (b) Quantitative RT‐PCR analysis of mouse apelin mRNA expression in tumors from control mice (day 0, n = 3) and bevacizumab‐treated mice (days 5 and 8, n = 3). Data are mean ± SEM. **P < 0.01. (c) Quantitative evaluation of plasma apelin expression by ELISA. Blood samples were collected on days 0, 5, and 8. Data are mean ± SEM. *P < 0.05. (d) Western blot analysis for HIF‐1α expression in tumor xenografts. GAPDH was used as an internal control.
Hypoxia regulates many genes, mediated by HIF‐1α;33 apelin expression is also induced through HIF‐1α.35 Therefore, we assessed changes in HIF‐1α mRNA and protein expression in tumors at days 0, 5, and 8 after bevacizumab treatment. There was no significant difference in HIF‐1α mRNA expression at any time point (data not shown), whereas, consistent with changes of apelin expression, the expression of HIF‐1α protein was significantly decreased at day 5, and increased again at day 8 after bevacizumab treatment (Fig. 6d). These data suggest that apelin, as a target gene of HIF‐1α, could be used as a marker to determine the tumor vasculature normalization window opened by antiangiogenic agents.
Discussion
In this report, we analyzed the usefulness of a biomarker to detect normalization of the tumor vasculature after treatment with an antiangiogenic agent. Using histological and functional methodology, we initially determined that our cancer cell inoculation xenograft model using HT29 human colon cancer cells was adequate for observing the normalization of tumor vasculature following treatment with bevacizumab. Based on the confirmation that our model is suitable to detect the normalization of tumor vasculature, we found that apelin is a candidate marker for monitoring tumor vascular normalization during antiangiogenic therapy.
In our colorectal tumor model, a single dose of bevacizumab treatment significantly reduced vessel density at day 3 and persisted throughout the study period of 8 days. This may due to bevacizumab's circulating half‐life of ~20 days.42 We did not determined the serum VEGF level; however, continuous vessel regression strongly suggests that VEGF levels were kept low by bevacizumab treatment.
To investigate the changes in vessel structure, we analyzed large vessel density39 and pericyte coverage after bevacizumab treatment. A significant decrease was observed in large vessel density, especially between days 3 and 5 after bevacizumab administration. Pericyte coverage increased at day 3 and 5 in bevacizumab‐treated tumors, although this change was not statistically significant. Vessel maturity index significantly increased at days 3 and 5, possibly due to the regression of immature blood vessels and a slight increase in the pericyte coverage after bevacizumab treatment. Angiopoietin‐1 (Ang‐1) has been shown to be involved in the recruitment of pericytes during the normalization window by DC101 (VEGFR2‐specific mAb) treatment in a human glioblastoma U87 orthotopical xenograft model.36 However, in our HT29 xenografts, no changes in Ang‐1 expression in the tumors were observed at any time points after bevacizumab treatment (data not shown). To investigate whether the vessel structure changes by bevacizumab treatment are accompanied by functional improvements, we analyzed the changes in tumor hypoxia and small molecule delivery. Tumor hypoxia was reduced at days 3 and 5 after bevacizumab treatment. Hoechst delivery was improved at the same time, and a similar observation was also made in HT29 xenografts.39 In addition, the distribution of Hoechst in bevacizumab‐treated tumors was more homogeneous compared with the control tumors, especially at day 5. Furthermore, a greater antitumor effect was observed when 5‐FU was given during the normalization window after bevacizumab treatment. All these observations suggest that vessel normalization occurred between days 3 and 5 after bevacizumab treatment. Consistent with much published data relating to bevacizumab treatment in rectal cancer,43 rhabdomyosarcoma,44 and other murine cancer models,45, 46 our data support the proposed concept of tumor vessel normalization by antiangiogenic therapy.7, 8
Based on the original concept of tumor vascular disruption, much effort has been expended to identify predictive biomarkers for the inhibition of tumor growth focusing on the change in proangiogenic factors, including the level of expression of VEGF, placental growth factor, and interleukin‐6, and genotypes of VEGF or the VEGF receptor, and circulating endothelial progenitors.9 It has also been suggested that systemic hypertension can predict the efficacy of antiangiogenic treatment.9 However, hypertension may merely reflect toxicity for normal vessels, that is, hypertension is induced by the use of excessive amounts of antiangiogenic agents for patients who may achieve a good outcome.
Currently, it is widely accepted that normalization of the tumor vasculature by angiogenic inhibitors represents their major mode of action for tumor growth suppression when combined with anticancer drugs, by balancing the pro‐ and anti‐angiogenic factors in the tumor microenvironment.7, 8, 9, 10, 11 Therefore, there is now a requirement for a reliable marker to monitor when angiogenic inhibitors are acting as normalization factors for the tumor vasculature and thus to identify the correct time to treat the patient with anticancer drugs.
Several ways to monitor the normalization of tumor vasculature have been considered. One can directly observe morphological changes in vascularity in tumor biopsies before and after treatment with antiangiogenic agents by using histological methods. Such direct comparisons of tumor vascularity are feasible, but this is invasive and yields no information on vascular function. Other accepted ways to detect normalization of the tumor vasculature is to use dynamic MRI or computed tomography for direct imaging. Especially in the former, measurement of Ktrans is useful to detect vascular permeability after treatment with antiangiogenic agents.9
There are no established ways to detect normalization of the tumor vasculature using only a blood sample (serum or plasma). It has been suggested that the serum level of soluble VEGFR, that is, the sFlt1 level, may be a marker for predicting the efficacy of antiangiogenic therapy.47 As sFlt1 neutralizes VEGF, additional VEGF blockade may not be effective in patients who have a high level of sFlt1 before therapy. However, it is suggested that sFlt1 is produced by endothelial cells, so‐called “phalanx cells,” to finalize angiogenesis for maturation of neovasculature.48 Therefore, the monitoring of sFlt1 is a candidate approach for detecting blood vessel maturation.
Recently, it has been reported that Ang‐2 may be a predictive marker in antiangiogenic therapy.49, 50 Angiopoietin‐2 is one of the ligands for the receptor tyrosine kinase Tie2, which is expressed on endothelial cells.49, 50 Angiopoietin‐1 is an agonistic ligand for Tie2 and phosphorylates it; however, Ang‐2 does not activate Tie2 at any reasonable dose and therefore acts as an antagonist for Ang‐1. Activation of Tie2 induces endothelial‐to‐endothelial and endothelial‐to‐mural cell adhesion to increase the structural stability of blood vessels. Angiopoietin‐2 inactivates Tie2 to induce blood vessel instability, resulting in initiation of sprouting angiogenesis. Therefore, a high level of Ang‐2 indicates that sprouting angiogenesis is ongoing. In the tumor microenvironment, excessive amounts of proangiogenic factors induce immature blood vessels, and hypoxia persists due to poor perfusion. Angiopoietin‐2 is produced by endothelial cells under hypoxia, as observed for apelin. This suggests that angiogenesis‐related factors upregulated by hypoxia are general candidates for monitoring the normalization of tumor blood vessels. However, it is possible that gene transcription is negatively regulated in the tumor microenvironment in a manner that is different from normal organs. Therefore, we need to confirm whether factors upregulated under tissue hypoxia in the physiological situation are also upregulated in the tumor microenvironment. Here, we found that apelin expression is altered by hypoxia in the tumor microenvironment. Therefore, apelin can be used as a monitoring indicator to detect vascular normalization.
Bevacizumab seems not to affect transcription of the HIF‐1α gene (data not shown), whereas HIF‐1α protein levels showed a transient but significant decrease at day 5. Thus, bevacizumab may indirectly, through HIF‐1α activation, regulate the expression of apelin. It has been reported that VEGF increases apelin mRNA expression in vitro.51 Moreover, in a Xenopus model, VEGF overexpression upregulated apelin.22 Whether bevacizumab is directly involved in regulating apelin expression remains unknown. Our findings could be tested in the clinic, in order to allow a more rational application of bevacizumab in combination with chemotherapeutic agents. However, plasma apelin levels are positively correlated with body mass index in humans and increase in obese patients.52 In patients with heart failure, plasma apelin seems to increase in the early stages of disease progression53 but to decrease again later.53, 54 Therefore, the clinical usefulness of apelin to identify the normalization window in the tumor microenvironment needs to be analyzed in future work, taking into account the multiple influences on the transcriptional control of apelin expression. At present, a clinical trial to observe the serum apelin expression in cancer patients before and after bevacizumab treatment is underway under the direction of the members of the Anti‐Angiogenesis Biomarker Conference at Osaka University (Institutional Review Board authorization no. 11331‐2). It seems that apelin expression tends to decrease in patients who respond well to anticancer agents. Based on the precise data from this study, we will be able to discuss apelin expression more extensively in the near future.
Disclosure Statement
The authors have no conflict of interest.
Acknowledgments
We thank Ms. K. Fukuhara and Ms. N. Fujimoto for technical assistance. We also thank members of the Anti‐Angiogenesis Biomarker Conference, Osaka University (Drs. T. Kijima, T. Otsuka, S. Kin, T. Nakayama, T. Sato, D. Sakai, N. Hashimoto, N. Kagawa, S. Mabuchi, N. Tomiyama, M. Yanagawa, and T. Nojiri) for inspiring discussions. This work was supported by Grants‐in Aid for Scientific Research from the Ministry of Education, Culture, Sports, Science and Technology of Japan, the Japan Society for the Promotion of Science, and Grant‐in Research Center Network for Realization of Regenerative Medicine of Agency for Medical Research and Development.
Cancer Sci 107 (2016) 36–44
Funding Information
Ministry of Education, Culture, Sports, Science and Technology of Japan; Japan Society for the Promotion of Science; Research Center Network for Realization of Regenerative Medicine; Japan Agency for Medical Research and Development.
References
- 1. Folkman J. Anti‐angiogenesis: new concept for therapy of solid tumors. Ann Surg 1972; 175: 409–16. [DOI] [PMC free article] [PubMed] [Google Scholar]
- 2. Jain RK. Antiangiogenesis strategies revisited: from starving tumors to alleviating hypoxia. Cancer Cell 2014; 26: 605–22. [DOI] [PMC free article] [PubMed] [Google Scholar]
- 3. Browder T, Butterfield CE, Kräling BM et al Anti‐angiogenic scheduling of chemotherapy improves efficacy against experimental drug‐resistant cancer. Cancer Res 2000; 60: 1878–86. [PubMed] [Google Scholar]
- 4. Klement G, Baruchel S, Rak J et al Continuous low‐dose therapy with vinblastine and VEGF receptor‐2 antibody induces sustained tumor regression without overt toxicity. J Clin Invest 2000; 105: R15–24. [DOI] [PMC free article] [PubMed] [Google Scholar]
- 5. Kozin SV, Boucher Y, Hicklin DJ et al VEGF receptor‐2 blocking antibody potentiates radiation‐induced long‐term control of human tumor xenografts. Cancer Res 2001; 61: 39–44. [PubMed] [Google Scholar]
- 6. Hurwitz H, Fehrenbacher L, Novotny W et al Bevacizumab plus irinotecan, fluorouracil, and leucovorin for metastatic colorectal cancer. N Engl J Med 2004; 350: 2335–42. [DOI] [PubMed] [Google Scholar]
- 7. Jain RK. Normalizing tumor vasculature with anti‐angiogenic therapy: a new paradigm for combination therapy. Nat Med 2001; 7: 987–9. [DOI] [PubMed] [Google Scholar]
- 8. Jain RK. Normalization of tumor vasculature: an emerging concept in antiangiogenic therapy. Science 2005; 307: 58–62. [DOI] [PubMed] [Google Scholar]
- 9. Goel S, Duda DG, Xu L et al Normalization of the vasculature for treatment of cancer and other diseases. Physiol Rev 2011; 91: 1071–121. [DOI] [PMC free article] [PubMed] [Google Scholar]
- 10. Jain RK. Normalizing tumor microenvironment to treat cancer: bench to bedside to biomarkers. J Clin Oncol 2013; 31: 2205–18. [DOI] [PMC free article] [PubMed] [Google Scholar]
- 11. Carmeliet P, Jain RK. Molecular mechanisms and clinical applications of angiogenesis. Nature 2011; 473: 298–307. [DOI] [PMC free article] [PubMed] [Google Scholar]
- 12. Tatemoto K, Hosoya M, Habata Y et al Isolation and characterization of a novel endogenous peptide ligand for the human APJ receptor. Biochem Biophys Res Commun 1998; 251: 471–6. [DOI] [PubMed] [Google Scholar]
- 13. O'Dowd BF, Heiber M, Chan A et al A human gene that shows identity with the gene encoding the angiotensin receptor is located on chromosome 11. Gene 1993; 136: 355–60. [DOI] [PubMed] [Google Scholar]
- 14. Berry MF, Pirolli TJ, Jayasankar V et al Apelin has in vivo inotropic effects on normal and failing hearts. Circulation 2004; 110: II187–93. [DOI] [PubMed] [Google Scholar]
- 15. Atluri P, Morine KJ, Liao GP et al Ischemic heart failure enhances endogenous myocardial apelin and APJ receptor expression. Cell Mol Biol Lett 2007; 12: 127–38. [DOI] [PMC free article] [PubMed] [Google Scholar]
- 16. Ashley EA, Powers J, Chen M et al The endogenous peptide apelin potently improves cardiac contractility and reduces cardiac loading in vivo. Cardiovasc Res 2005; 65: 73–82. [DOI] [PMC free article] [PubMed] [Google Scholar]
- 17. Roberts EM, Newson MJ, Pope GR, Landgraf R, Lolait SJ, O'Carroll AM. Abnormal fluid homeostasis in apelin receptor knockout mice. J Endocrinol 2009; 202: 453–62. [DOI] [PMC free article] [PubMed] [Google Scholar]
- 18. Roberts EM, Pope GR, Newson MJ, Landgraf R, Lolait SJ, O'Carroll AM. Stimulus‐specific neuroendocrine responses to osmotic stimuli in apelin receptor knockout mice. J Neuroendocrinol 2010; 22: 301–8. [DOI] [PubMed] [Google Scholar]
- 19. Boucher J, Masri B, Daviaud D et al Apelin, a newly identified adipokine up‐regulated by insulin and obesity. Endocrinology 2005; 146: 1764–71. [DOI] [PubMed] [Google Scholar]
- 20. Dray C, Knauf C, Daviaud D et al Apelin stimulates glucose utilization in normal and obese insulin‐resistant mice. Cell Metab 2008; 8: 437–45. [DOI] [PubMed] [Google Scholar]
- 21. Edinger AL, Hoffman TL, Sharron M et al An orphan seven‐transmembrane domain receptor expressed widely in the brain functions as a coreceptor for human immunodeficiency virus type 1 and simian immunodeficiency virus. J Virol 1998; 72: 7934–40. [DOI] [PMC free article] [PubMed] [Google Scholar]
- 22. Cox CM, D'Agostino SL, Miller MK, Heimark RL, Krieg PA. Apelin, the ligand for the endothelial G‐protein‐coupled receptor, APJ, is a potent angiogenic factor required for normal vascular development of the frog embryo. Dev Biol 2006; 296: 177–89. [DOI] [PubMed] [Google Scholar]
- 23. Kasai A, Shintani N, Oda M et al Apelin is a novel angiogenic factor in retinal endothelial cells. Biochem Biophys Res Commun 2004; 325: 395–400. [DOI] [PubMed] [Google Scholar]
- 24. Kasai A, Shintani N, Kato H et al Retardation of retinal vascular development in apelindeficient mice. Arterioscler Thromb Vasc Biol 2008; 28: 1717–22. [DOI] [PubMed] [Google Scholar]
- 25. Kidoya H, Naito H, Muramatsu F et al APJ regulates parallel alignment of arteries and veins in the skin. Dev Cell 2015; 33: 247–59. [DOI] [PubMed] [Google Scholar]
- 26. Kidoya H, Ueno M, Yamada Y et al Spatial and temporal role of the apelin/APJ system in the caliber size regulation of blood vessels during angiogenesis. EMBO J 2008; 27: 522–34. [DOI] [PMC free article] [PubMed] [Google Scholar]
- 27. Kalin RE, Kretz MP, Meyer AM, Kispert A, Heppner FL, Brandli AW. Paracrine and autocrine mechanisms of apelin signaling govern embryonic and tumor angiogenesis. Dev Biol 2007; 305: 599–614. [DOI] [PubMed] [Google Scholar]
- 28. Picault FX, Chaves‐Almagro C, Projetti F, Prats H, Masri B, Audigier Y. Tumour co‐expression of apelin and its receptor is the basis of an autocrine loop involved in the growth of colon adenocarcinomas. Eur J Cancer 2014; 50: 663–74. [DOI] [PubMed] [Google Scholar]
- 29. Berta J, Kenessey I, Dobos J et al Apelin expression in human non‐small cell lung cancer: role in angiogenesis and prognosis. J Thorac Oncol 2010; 5: 1120–9. [DOI] [PubMed] [Google Scholar]
- 30. Heo K, Kim YH, Sung HJ et al Hypoxia‐induced up‐regulation of apelin is associated with a poor prognosis in oral squamous cell carcinoma patients. Oral Oncol 2012; 48: 500–6. [DOI] [PubMed] [Google Scholar]
- 31. Wan Y, Zeng ZC, Xi M et al Dysregulated microRNA‐224/apelin axis associated with aggressive progression and poor prognosis in patients with prostate cancer. Hum Pathol 2015; 46: 295–303. [DOI] [PubMed] [Google Scholar]
- 32. Muto J, Shirabe K, Yoshizumi T et al The apelin‐APJ system induces tumor arteriogenesis in hepatocellular carcinoma. Anticancer Res 2014; 34: 5313–20. [PubMed] [Google Scholar]
- 33. Facciabene A, Peng X, Hagemann IS et al Tumour hypoxia promotes tolerance and angiogenesis via CCL28 and T(reg) cells. Nature 2011; 475: 226–30. [DOI] [PubMed] [Google Scholar]
- 34. Wilson WR, Hay MP. Targeting hypoxia in cancer therapy. Nat Rev Cancer 2011; 11: 393–410. [DOI] [PubMed] [Google Scholar]
- 35. Eyries M, Siegfried G, Ciumas M et al Hypoxia‐induced apelin expression regulates endothelial cell proliferation and regenerative angiogenesis. Circ Res 2008; 103: 432–40. [DOI] [PubMed] [Google Scholar]
- 36. Winkler F, Kozin SV, Tong RT et al Kinetics of vascular normalization by VEGFR2 blockade governs brain tumor response to radiation: role of oxygenation, angiopoietin‐1, and matrix metalloproteinases. Cancer Cell 2004; 6: 553–63. [DOI] [PubMed] [Google Scholar]
- 37. Franco M, Man S, Chen L et al Targeted antivascular endothelial growth factor receptor‐2 therapy leads to short‐term and long‐term impairment of vascular function and increase in tumor hypoxia. Cancer Res 2006; 66: 3639–48. [DOI] [PubMed] [Google Scholar]
- 38. Datta M, Via LE, Kamoun WS et al Anti‐vascular endothelial growth factor treatment normalizes tuberculosis granuloma vasculature and improves small molecule delivery. Proc Natl Acad Sci USA 2015; 112: 1827–32. [DOI] [PMC free article] [PubMed] [Google Scholar]
- 39. Wildiers H, Guetens G, De Boeck G et al Effect of antivascular endothelial growth factor treatment on the intratumoral uptake of CPT‐11. Br J Cancer 2003; 88: 1979–86. [DOI] [PMC free article] [PubMed] [Google Scholar]
- 40. Wong PP, Demircioglu F, Ghazaly E et al Dual‐action combination therapy enhances angiogenesis while reducing tumor growth and spread. Cancer Cell 2015; 27: 123–37. [DOI] [PubMed] [Google Scholar]
- 41. Li XF, Carlin S, Urano M, Russell J, Ling CC, O'Donoghue JA. Visualization of hypoxia in microscopic tumors by immunofluorescent microscopy. Cancer Res 2007; 67: 7646–53. [DOI] [PubMed] [Google Scholar]
- 42. Ellis LM, Hicklin DJ. VEGF‐targeted therapy: mechanisms of anti‐tumour activity. Nat Rev Cancer 2008; 8(8): 579–91. [DOI] [PubMed] [Google Scholar]
- 43. Vangestel C, Van de Wiele C, Van Damme N et al (99)mTc‐(CO)(3) His‐annexin A5 micro‐SPECT demonstrates increased cell death by irinotecan during the vascular normalization window caused by bevacizumab. J Nucl Med 2011; 52: 1786–94. [DOI] [PubMed] [Google Scholar]
- 44. Myers AL, Williams RF, Ng CY, Hartwich JE, Davidoff AM. Bevacizumab‐induced tumor vessel remodeling in rhabdomyosarcoma xenografts increases the effectiveness of adjuvant ionizing radiation. J Pediatr Surg 2010; 45: 1080–5. [DOI] [PMC free article] [PubMed] [Google Scholar]
- 45. Dings RP, Loren M, Heun H et al Scheduling of radiation with angiogenesis inhibitors anginex and Avastin improves therapeutic outcome via vessel normalization. Clin Cancer Res 2007; 13: 3395–402. [DOI] [PMC free article] [PubMed] [Google Scholar]
- 46. Dickson PV, Hamner JB, Sims TL et al Bevacizumab‐induced transient remodeling of the vasculature in neuroblastoma xenografts results in improved delivery and efficacy of systemically administered chemotherapy. Clin Cancer Res 2007; 13: 3942–50. [DOI] [PubMed] [Google Scholar]
- 47. Duda DG, Willett CG, Ancukiewicz M et al Plasma soluble VEGFR‐1 is a potential dual biomarker of response and toxicity for bevacizumab with chemoradiation in locally advanced rectal cancer. Oncologist 2010; 15: 577–83. [DOI] [PMC free article] [PubMed] [Google Scholar]
- 48. Mazzone M, Dettori D, Leite de Oliveira R et al Heterozygous deficiency of PHD2 restores tumor oxygenation and inhibits metastasis via endothelial normalization. Cell 2009; 136: 839–51. [DOI] [PMC free article] [PubMed] [Google Scholar]
- 49. Nixon AB, Pang H, Starr MD et al Prognostic and predictive blood‐based biomarkers in patients with advanced pancreatic cancer: results from CALGB80303 (Alliance). Clin Cancer Res 2013; 19: 6957–66. [DOI] [PMC free article] [PubMed] [Google Scholar]
- 50. Augustin HG, Koh GY, Thurston G, Alitalo K. Control of vascular morphogenesis and homeostasis through the angiopoietin‐Tie system. Nat Rev Mol Cell Biol 2009; 10: 165–77. [DOI] [PubMed] [Google Scholar]
- 51. del Toro R, Prahst C, Mathivet T et al Identification and functional analysis of endothelial tip cell‐enriched genes. Blood 2010; 116: 4025–33. [DOI] [PMC free article] [PubMed] [Google Scholar]
- 52. Heinonen MV, Purhonen AK, Miettinen P et al Apelin, orexin‐A and leptin plasma levels in morbid obesity and effect of gastric banding. Regul Pept 2005; 130: 7–13. [DOI] [PubMed] [Google Scholar]
- 53. Chen MM, Ashley EA, Deng DX et al Novel role for the potent endogenous inotrope apelin in human cardiac dysfunction. Circulation 2003; 108: 1432–9. [DOI] [PubMed] [Google Scholar]
- 54. Chong KS, Gardner RS, Morton JJ, Ashley EA, McDonagh TA. Plasma concentrations of the novel peptide apelin are decreased in patients with chronic heart failure. Eur J Heart Fail 2006; 8: 355–60. [DOI] [PubMed] [Google Scholar]