

Abstract
Objective
Administrative data is used for research, quality improvement, and health policy in severe sepsis. However, there is not a sepsis-specific tool applicable to administrative data with which to adjust for illness severity. Our objective was to develop, internally validate, and externally validate a severe sepsis mortality prediction model and associated mortality prediction score.
Design
Retrospective cohort study using 2012 administrative data from five US states. Three cohorts of patients with severe sepsis were created: 1) ICD-9-CM codes for severe sepsis/septic shock, 2) ‘Martin’ approach, and 3) ‘Angus’ approach. The model was developed and internally validated in ICD-9-CM cohort and externally validated in other cohorts. Integer point values for each predictor variable were generated to create a sepsis severity score.
Setting
Acute care, non-federal hospitals in NY, MD, FL, MI, and WA
Subjects
Patients in one of three severe sepsis cohorts: 1) explicitly coded (n=108,448), 2) Martin cohort (n=139,094), and 3) Angus cohort (n=523,637)
Interventions
None
Measurements and Main Results
Maximum likelihood estimation logistic regression to develop a predictive model for in-hospital mortality. Model calibration and discrimination assessed via Hosmer-Lemeshow goodness-of-fit (GOF) and C-statistics respectively. Primary cohort subset into risk deciles and observed versus predicted mortality plotted. GOF demonstrated p>0.05 for each cohort demonstrating sound calibration. C-statistic ranged from low of 0.709 (sepsis severity score) to high of 0.838 (Angus cohort) suggesting good to excellent model discrimination. Comparison of observed versus expected mortality was robust although accuracy decreased in highest risk decile.
Conclusions
Our sepsis severity model and score is a tool that provides reliable risk adjustment for administrative data.
Keywords: sepsis, severe sepsis, risk adjustment, severity of illness, administrative data, critical care, intensive care, health service research
Introduction
The need for risk adjustment is essential when heterogeneous patient cohorts are compared. Patient socio-demographics, concomitant comorbid disease(s), indicators of acute illness severity, and procedures are often included in such prediction models.1–4 In critical care research the need to adjust for illness severity was identified over thirty years ago and thus multiple illness severity adjustment tools derived from clinical data have been developed, validated, and refined.5–9
More recently, a severity score specific to severe sepsis was derived from a large clinical database obtained during the international Surviving Sepsis Campaign.10,11 An important limitation to general ICU severity adjustment tools, as well as the tool specific to severe sepsis, is that detailed clinical information is necessary and, unless proprietary systems are purchased, the time required to abstract necessary data from the medical record is time-consuming and costly.4,12–15 Thus, only a tiny proportion of US ICU’s utilize the clinically derived, severity adjustment tools,16 limiting the ability to evaluate risk-adjusted outcomes for the majority of US critically ill patients including those with severe sepsis.
Fortunately, the granularity of hospital administrative data has increased significantly over time and is now widely used in both research and quality improvement efforts.17,18 A distinguishing feature in ICU risk adjustment is the need to account for acute illness severity which has been considered a limitation of administrative data for purposes of ICU research.19 Recognizing the need for a risk-adjustment tool specific to severe sepsis that could be applied to administrative data, Lagu and colleagues developed and validated a mortality prediction model using clinically enhanced, detailed administrative data.20 While this model performed well, its general applicability is limited since key clinical information is still required.
Thus, we sought to develop and validate a severe sepsis mortality prediction model and mortality prediction score using solely administrative data. We then sought to ascertain how this model performed when applied to cohorts of patients with severe sepsis identified from administrative data using alternative, and widely employed, cohort identification strategies.21–23 Our intent was to provide a tool for researchers, administrators, and policy makers who utilize administrative data when seeking to better understand issues related to severe sepsis care and outcomes. Such a tool will become increasingly important as the Center for Medicare and Medicaid Services (CMS) advances the agenda of improving quality of inpatient care and includes severe sepsis measures in fiscal year 2017 along with subsequent impact to hospital reimbursement.24
Materials and Methods
Study Design
We conducted a retrospective cohort study of adults hospitalized with severe sepsis to non-federal hospitals in five geographically representative states (NY, MD, FL, MI, and WA). We obtained 2012 hospital discharge data from the Healthcare Cost and Utilization Project (HCUP) state inpatient databases (SID). We chose these states because they are geographically diverse and contain charges for ICU level care. This study was designated non-human research by our Institutional Review Board.
Severe Sepsis Cohort Identification
All admissions, from the calendar year 2012, with the International Classification of Disease, Ninth Revision, Clinical Modification (ICD-9-CM) codes of severe sepsis and/or septic shock (995.92, 785.52) were chosen for analysis. These ICD-9 codes were chosen to maximize the specificity of the severe sepsis diagnosis.25,26 Admissions for patients who were transferred between acute care hospitals or had age < 20 years were excluded. We randomly selected 60% of the sample as the development cohort and the remaining 40% as the validation cohort.
Outcome Measure
Our outcome was in-hospital mortality.
Predictor Variable Development
We constructed predictor variables based on the three cornerstones of clinically derived, ICU severity adjustment tools including patient demographics, acute illness severity, and co-morbid disease.20,27
Patient demographic characteristics included patient age by decade, sex, and race.
-
Measures of acute illness severity and number of organs failing are significantly associated with mortality in severe sepsis.23 We identified proxies for organ failure in our data. For respiratory failure, we constructed a variable termed ‘early mechanical ventilation’ to reflect severe sepsis and concomitant acute respiratory failure present upon admission. This variable was constructed by using the date and time of the admission combined with the date for a procedure code corresponding to mechanical ventilation (96.7x). Since procedure codes are not given specific times, we created an algorithm that categorized any patient receiving mechanical ventilation within 0–2 days of the admission date and time as representing early mechanical ventilation and cases where mechanical ventilation was initiated after 2 days as ‘late mechanical ventilation.’
Patients with septic shock who receive vasopressors represent a subset of severe sepsis with especially high mortality.23 Thus, we a priori defined an ICD-9-CM code of septic shock (785.52) or shock (785.50) as a proxy for receipt of vasopressor medications. Additionally, as acute kidney injury is independently associated with death from severe sepsis,28 we used procedure code (39.95) for hemodialysis as an indicator for renal failure. Finally, we included treatment in the ICU for at least one day based on charge codes for ICU-level care as an additional proxy for acute illness severity, acknowledging that there is significant variation between hospitals with respect to ICU admission.29
Pre-existing chronic disease, as reflected in administrative data sources, has been associated with increased mortality in sepsis.30 Thus, to control for comorbidities we used the Elixhauser comorbidity index31 which has discriminatory capability for in-hospital mortality.32 We combined indicator variables for anemia and blood loss, as well as the two variables for diabetes with and without complications.
Model Development and Internal Validation
We constructed a maximum likelihood estimation logistic regression model and applied it to the development cohort. Using manual backward elimination, we sequentially removed several comorbidities from the Elixhauser index because they did not contribute to the model’s predictive power. Specifically, ulcer disease, AIDS and alcohol-related comorbidities, were removed during our initial model development as they did not predict sepsis mortality. The revised model was then applied to the remaining 40% cohort for internal validation. For both the development and validation models, calibration (i.e. how well observed mortality compares to predicted mortality across risk deciles) was assessed using the Hosmer-Lemeshow goodness-of-fit (GOF) test on random samples of 1000 observations.33 Model discrimination (i.e. the probability that a patient who dies will have higher predicted mortality) was examined using the area under the receiver operator characteristic curve (C-statistic). Subsequently, we stratified our overall sample into risk deciles using our mortality prediction score and graphically compared our observed to our predicted outcomes by risk decile.
Sensitivity Analysis and External Validation
In order to assess model performance when applied to cohorts of patients with severe sepsis identified by common methodologies other than explicitly ICD-9-CM coded severe sepsis, we constructed two new patient cohorts. First, we created a cohort using the ‘Martin approach’ in which ICD-9-CM codes reflecting septicemia or disseminated infection are combined with ICD-9-CM codes for acute organ dysfunction.22 Second, we used a historical and strategy that combines an extensive list of ICD-9-CM codes corresponding to infection in conjunction with ICD-9-CM codes corresponding to organ dysfunction referred to as the ‘Angus approach.’23 These different strategies for cohort development in severe sepsis have been compared and the use of explicit coding is more specific but less sensitive when compared to the Martin and Angus approaches versus a gold standard of clinical chart abstraction.21,34
Sepsis Severity Score Development
To generate a sepsis severity score for use with administrative data, we adapted the technique of Osborn et al10 and assigned integer point values to each predictor variable from the multivariable logistic regression model. The score value for each variable in the model was calculated as the value of the beta coefficients in the prediction model multiplied by 10 and rounding to the nearest integer. In addition, a constant of five was added to each integer coefficient to eliminate any negative values. These nonnegative integers are the point values that make up the sepsis severity score when summed. A summary score was created for each observation in the total data set of 108,603 admissions and used as the predictor of hospital mortality in a univariate logistic regression model to predict mortality. Model performance was evaluated for GOF, C-statistic, and graphically by deciles of predicted mortality using the same approach as used for the original model development. All analyses were conducted using SAS version 9.3 (Cary, NC) and the statistical code for our specification of the ventilator variables and model is provided in the Appendix.
Results
We examined a total of 7,785,846 acute care hospital discharge records from 2012 SID from NY, MD, FL, MI, and WA states. We extracted data for 563,155 admissions that could be considered an admission for severe sepsis using any of the three criteria for severe sepsis cohort identification. Thus, severe sepsis could constitute as much as 7.2% of all acute care admissions. To provide insight into potential differences between the three cohorts, we determined the proportion of the Martin and Angus cohorts that were also explicitly coded as severe sepsis or septic shock. Only 18.8% of the cohort obtained via the Angus approach had an explicit code for severe sepsis or septic shock whereas 53% of the Martin cohort were coded explicitly. Table 1 provides descriptive statistics for the three cohorts.
Table 1.
Characteristics of Severe Sepsis Patient Cohorts Identified Via Explicit ICD-9-CM Coding, Martin Definition, and Angus Definition
| Variable | Explicit Coding n=108,448 |
Martin Def.35 n=139,094 |
Angus Def.36 n=523,637 |
|---|---|---|---|
| Demographics | |||
| Mean Age (SD) | 68.8 (16.0) | 69.8 (16.1) | 69.8 (16.1) |
| Female sex, n (%) | 52,813 (48.6) | 69,207 (49.8) | 269,938 (51.6) |
| Race, n (%) | |||
| White | 69,116 (63.6) | 91,669 (65.9) | 346,680 (66.2) |
| Black | 19,048 (17.5) | 22,936 (16.5) | 88,945 (17.0) |
| Hispanic | 9,015 (8.3) | 10,005 (7.2) | 40,653 (7.8) |
| Other | 11,465 (10.6) | 14,484 (10.4) | 47,359 (9.0) |
| Insurance, n (%) | |||
| Medicare | 75,024 (69.1) | 99,598 (71.6) | 369,781 (70.6) |
| Medicaid | 12,479 (11.5) | 13,869 (10.0) | 54,498 (10.4) |
| Commercial | 16,194 (14.9) | 19,582 (14.1) | 75,324 (14.4) |
| Other | 4,947 (4.5) | 6,045 (4.3) | 24,034 (4.6) |
| Measures of acute illness severity, n (%) | |||
| Early mechanical ventilationa | 26,588 (24.5) | 23,163 (16.7) | 47,985 (9.16) |
| Late mechanical ventilationb | 17,118 (15.8) | 8,394 (6.0) | 30,930 (5.8) |
| Shock | 71,426 (65.7) | 62,663 (45.1) | 164,828 (31.5) |
| Hemodialysis | 7,322 (11.2) | 11,996 (8.6) | 34,032 (6.5) |
| ICU care (at least one day) | 78,172 (72.0) | 61,521 (44.2) | 185,482 (35.42) |
| Comorbidities, n (%) | |||
| Anemia | 25,156 (38.6) | 55,125 (39.6) | 208,919 (39.9) |
| Depression | 7,536 (11.6) | 17,515 (12.6) | 69,989 (13.4) |
| Diabetes | 22,860 (35.1) | 52,847 (38.0) | 192,460 (36.8) |
| Drug and substance abuse | 2,687 (4.1) | 4,980 (3.6) | 21,094 (4.0) |
| Chronic lung disease | 19,527 (30.0) | 41,114 (29.6) | 153,100(29.2) |
| Congestive heart failure | 19,507 (29.9) | 38,505 (27.7) | 146,568 (28.0) |
| Hypertension | 40,432 (62.0) | 91,010 (65.4) | 358,616 (68.5) |
| Hypothyroid disease | 9,361 (14.4) | 21,441 (15.4) | 83,609 (16.0) |
| Liver disease | 5,075 (7.8) | 10,318 (7.4) | 37,214 (7.1) |
| Lymphoma | 1,634 (2.5) | 3.225 (2.3) | 10,344 (2.0) |
| Metastatic carcinomas | 4,335 (6.7) | 7,782 (5.6) | 27,464 (5.2) |
| Neurological conditions | 11,118 (17.1) | 25,170 (18.1) | 72,555 (13.7) |
| Obesity | 8,988 (13.8) | 18,791 (13.5) | 76,730 (14.7) |
| Paraplegia | 4,810 (7.4) | 9,752 (7.0) | 27,884 (5.3) |
| Perivascular conditions | 7,419 (11.4) | 14,934 (10.7) | 59,167 (11.3) |
| Psychiatric diseases | 3,678 (5.6) | 7,659 (5.5) | 30,864 (5.9) |
| Pulmonary-circulatory | 5,919 (9.1) | 10,306 (7.4) | 44,658 (8.5) |
| Renal failure, chronic | 20,225 (31.0) | 48,465 (34.8) | 188,865 (36.1) |
| Malignant solid tumors | 2,948 (4.5) | 6,218 (4.5) | 19,927 (3.8) |
| Weight loss | 13,870 (21.3) | 22,650 (16.3) | 70,173 (13.4) |
| Outcomes, n (%) | |||
| Died in-hospital | 31,625 (29.1) | 24,525 (17.6) | 53,784 (10.3) |
| Discharged home | 22,470 (34.5) | 64,003 (46.0) | 289,167 (55.2) |
| Geographic Region, n | |||
| New York | 34,517 | 40,639 | 134,983 |
| Maryland | 10,448 | 15,197 | 58,508 |
| Florida | 34,404 | 39,633 | 184,029 |
| Michigan | 19,321 | 29,438 | 100,324 |
| Washington | 9,954 | 14,187 | 45,801 |
early mechanical ventilation = 0–2 days from admission
late mechanical ventilation > 2 days from admission
We used admissions with an explicit ICD-9-CM code of severe sepsis or septic shock for our model’s development and internal validation. Table 2 provides the composite list of variables included in our final mortality prediction model categorized into demographics, measures of acute illness severity, and comorbidities. The odds of death increased for each additional decade of age and mortality was higher among black and Hispanic patients as compared to white patients. The proxy measures we generated to reflect acute illness severity were all significantly associated with in-hospital mortality including early and late mechanical ventilation, codes for shock or septic shock, and receipt of hemodialysis. Admission to an ICU for at least one day was associated with significantly reduced odds of death. Also provided in Table 2 are the point values for each predictor variable that can be used to generate a severe sepsis mortality score.
Table 2.
Severe Sepsis Mortality Prediction Model and Sepsis Severity Score
| Variable | Coefficient | se | OR | 95% CI | p | Score Point Values |
|---|---|---|---|---|---|---|
| Demographics | ||||||
| Age < 40 reference | 0 | |||||
| Age 40–49 | 0.321 | 0.050 | 1.38 | 1.25–1.52 | <0.0001 | 8 |
| Age 50–59 | 0.504 | 0.045 | 1.66 | 1.52–1.81 | <0.0001 | 10 |
| Age 60–69 | 0.690 | 0.044 | 1.99 | 1.83–2.17 | <0.0001 | 12 |
| Age 70–79 | 0.954 | 0.044 | 2.60 | 2.38–2.83 | <0.0001 | 15 |
| Age 80–89 | 1.33 | 0.044 | 3.78 | 3.47–4.12 | <0.0001 | 18 |
| Age 90+ | 1.76 | 0.050 | 5.78 | 5.25–6.37 | <0.0001 | 23 |
| Female sex | 0.104 | 0.015 | 1.11 | 1.08–1.14 | <0.0001 | 6 |
| White/Other reference Black Hispanic |
0.112 0.074 |
0.021 0.021 |
1.12 1.08 |
1.08–1.17 1.02–1.14 |
<0.0001 0.006 |
0 6 6 |
| Measures of acute illness severity | ||||||
| Early mechanical ventilationa | 1.50 | 0.018 | 4.46 | 4.31–4.63 | <0.0001 | 20 |
| Late mechanical ventilationb | 1.84 | 0.021 | 6.27 | 6.01–6.53 | <0.0001 | 23 |
| Shock | 0.653 | 0.017 | 1.92 | 1.86–1.99 | <0.0001 | 12 |
| Hemodialysis | 0.469 | 0.024 | 1.60 | 1.52–1.68 | <0.0001 | 10 |
| ICU care (at least one day) | −0.255 | 0.018 | 0.775 | 0.748–0.802 | <0.0001 | 2 |
| Comorbidities | ||||||
| Anemia | −0.428 | 0.016 | 0.652 | 0.632–0.673 | <0.0001 | 1 |
| Depression | −0.186 | 0.025 | 0.830 | 0.787–0.868 | <0.0001 | 3 |
| Diabetes | −0.120 | 0.017 | 0.887 | 0.858–0.916 | <0.0001 | 4 |
| Drug and substance abuse | −0.374 | 0.044 | 0.688 | 0.631–0.751 | <0.0001 | 1 |
| Chronic lung disease | −0.107 | 0.017 | 0.898 | 0.869–0.928 | <0.0001 | 4 |
| Congestive heart failure | 0.046 | 0.017 | 1.047 | 1.01–1.08 | <0.0001 | 5 |
| Hypertension | −0.243 | 0.017 | 0.784 | 0.760–0.810 | <0.0001 | 3 |
| Hypothyroid disease | −0.119 | 0.022 | 0.887 | 0.850–0.927 | <0.0001 | 4 |
| Liver disease | 0.752 | 0.027 | 2.12 | 2.01–2.24 | <0.0001 | 13 |
| Lymphoma | 0.574 | 0.046 | 1.78 | 1.62–1.94 | <0.0001 | 11 |
| Metastatic carcinomas | 1.01 | 0.029 | 2.75 | 2.01–2.24 | <0.0001 | 15 |
| Neurological conditions | −0.106 | 0.018 | 0.900 | 0.864–0.937 | <0.0001 | 4 |
| Obesity | −0.329 | 0.024 | 0.719 | 0.686–0.754 | <0.0001 | 2 |
| Paraplegia | −0.216 | 0.030 | 0.806 | 0.760–0.856 | <0.0001 | 3 |
| Perivascular conditions | 0.163 | 0.023 | 1.18 | 1.13–1.23 | <0.0001 | 7 |
| Psychiatric diseases | −0.413 | 0.037 | 0.661 | 0.615–0.711 | <0.0001 | 1 |
| Pulmonary-circulatory | 0.121 | 0.026 | 1.13 | 1.07–1.19 | <0.0001 | 6 |
| Renal failure, chronic | 0.052 | 0.018 | 1.05 | 1.02–1.09 | 0.004 | 6 |
| Malignant solid tumors | 0.495 | 0.034 | 1.64 | 1.53–1.76 | <0.0001 | 10 |
| Weight loss | −0.231 | 0.018 | 0.794 | 0.765–0.823 | <0.0001 | 3 |
| Intercept | −2.65 | 0.046 | <0.0001 | |||
early mechanical ventilation = 0–2 days from admission
late mechanical ventilation > 2 days from admission
Measures of model performance for the development and validation cohorts are provided in Table 3. For external validation, we applied the model to the ‘Martin’ and ‘Angus’ cohorts22,23 and additionally present the model’s performance in these cohorts in Table 3. Lastly, we measured the performance of the integer-based mortality prediction score to the entire explicitly coded cohort. The p-values for all GOF statistics were greater than 0.05 suggesting our model is well calibrated. Additionally, the area under the curve for the model in each different cohort ranged from a low of C=0.709 (mortality prediction score) to a high of C = 0.838 (Angus cohort) demonstrating robust ability to discriminate hospital mortality.
Table 3.
Measure of Model Performance: Development, Internal Validation, and External Validation
| Model | N | Percent of Population |
Hosmer- Lemeshow GOF statisticsc X2, df, p |
Area Under the Receiver Operator Curve (C) |
|---|---|---|---|---|
| Development | 65,069 | 60% | 8.72, 8, 0.37 | 0.801 |
| Validation | 43,379 | 40% | 6.76, 8, 0.56 | 0.765 |
| Combined | 108,448 | 100% | 7.09, 8, 0.53 | 0.772 |
| External Validation | ||||
| Martin Cohort | 139,094 | 100% | 6.71, 8, 0.57 | 0.803 |
| Angus Cohort | 523,645 | 100% | 5.14, 8, 0.74 | 0.838 |
| Sepsis severity score | 108,448 | 100% | 14.4, 8, 0.07 | 0.709 |
GOF = goodness of fit; was performed on a random sample of 1000 observations, p>.05 indicates a good fit of the model to the data
Finally, model performance was evaluated graphically by looking at observed versus predicted mortality by decile of predicted mortality. This is provided in Figure 1 and demonstrates that our model is highly accurate in predicting in-hospital mortality for each decile of risk although model performance diminishes in the highest predicted mortality decile. We evaluated the highest risk decile further and found that 6% who survived the admission, were discharged to hospice and if this designation were considered a mortality, our model would predict 87% mortality compared with 82% actual mortality (data not shown). Also provided in Figure 1 are the specific mortality ratios of observed versus predicted for each decile of mortality risk. Figure 2 provides a graphical illustration of the severe sepsis mortality prediction score again with observed versus predicted mortality plotted for each decile of risk.
Figure 1.

Observed Versus Predicted Hospital Mortality and Associated Mortality Ratios by Risk Deciles in Development and Validation Cohorts
Figure 2.
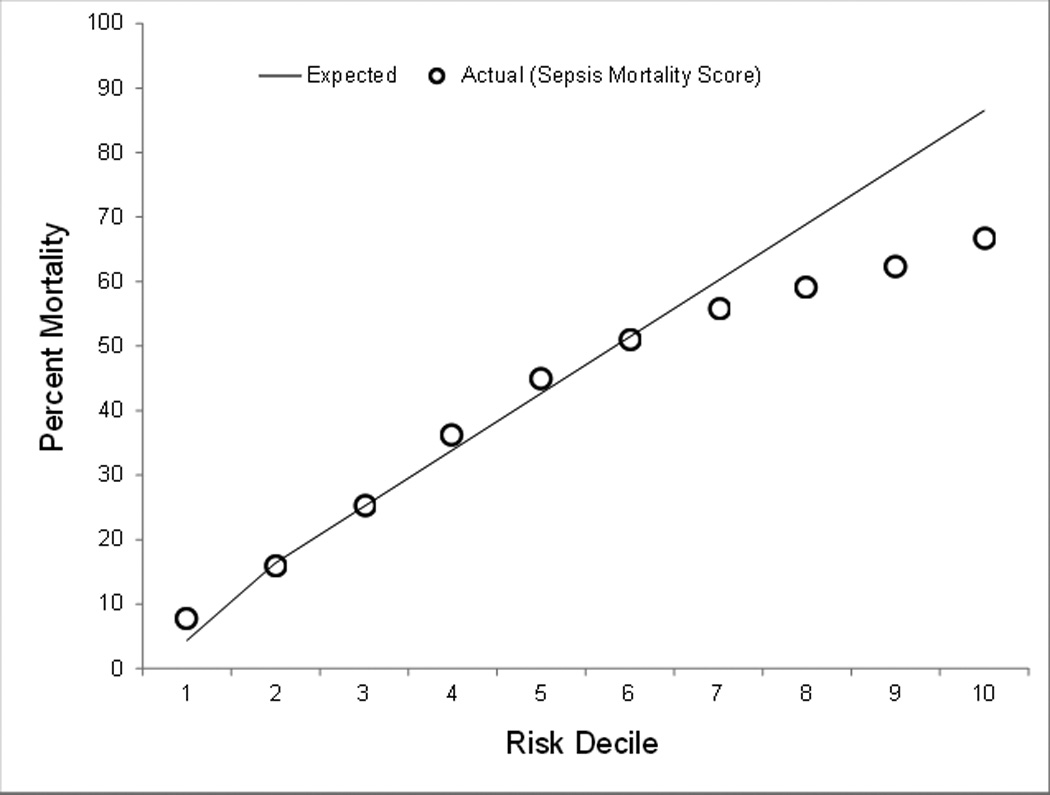
Observed versus predicted hospital mortality associated with sepsis severity score by risk decile
Discussion
Severe sepsis is a leading cause of death and is increasingly prevalent in the US22 and represents one of the most common diagnoses leading to ICU admission, a major driver of cost in the US healthcare system.23,35 Thus, there is a clinical and economic imperative to optimize treatment among patients with severe sepsis. However, severe sepsis is heterogeneous and, therefore, severity adjustment tools are important for efforts seeking to improve patient care and outcomes. To date, there has not been a simple-to-use, publicly available, sepsis severity adjustment tool that can be applied to administrative data sources. We felt this was an important gap in the arsenal of techniques relevant to sepsis research, quality improvement, and policy making and thus, sought to close this gap by developing a severe sepsis mortality prediction model and associated mortality prediction score for use with administrative data.
The basis for the three major categories of predictor variables we chose is well established in ICU clinical research and includes patient demographics, measures of acute illness severity, and comorbid disease.5–9,36–38 Indeed, although our data were not derived directly from patient medical records, the variables we chose to reflect acute illness severity performed in a fashion that would be clinically expected since mortality in severe sepsis is highly associated with the number of organs failing.23
For example, we found that requiring mechanical ventilation within the first 2 days of admission was associated with a 4.5 fold increase in the odds of death. This is likely because mechanical ventilation among patients with severe sepsis is typically due to concomitant Acute Respiratory Distress Syndrome (ARDS), which has especially high mortality when associated with severe sepsis.11 Furthermore, in order to provide a more nuanced understanding of the role that timing of initiation of mechanical ventilation has, we created an ‘early’ (within 2 days of hospitalization) and ‘late’ (after 2 days of hospitalization) mechanical ventilation variable. Notably, receiving mechanical ventilation several days after being hospitalized had an even greater odds of mortality (OR, 6.23; 95% CI, 6.01–6.53). This is congruent with reports from clinical studies showing that patients admitted to the ICU after a period of acute care hospitalization have worse outcomes than patients directly admitted to ICU.39 Finally, the proxies we selected to reflect acute illness severity included ICD-9-CM codes for shock and procedure codes for receipt of hemodialysis each of which was associated with increased odds of mortality and further reflected multiple organ failure (OR, 1.92; 95% CI, 1.86–1.99 and OR, 1.60; 95% CI, 1.52–1.68 respectively).
We evaluated model performance with regards to calibration and discrimination using statistical and graphical techniques. The Hosmer-Lemeshow GOF statistic for the development, internal validation, and combined explicitly coded severe sepsis cohort suggested that predicted mortality reflects true mortality and thus our model is well-calibrated (Table 3). Additionally, the C-statistic, reflecting the area under the ROC curve ranged from very good to excellent (0.765–0.801) supporting the model’s ability to discriminate patient mortality (Table 3). Finally, we examined the calibration of the model across different risk deciles and demonstrated that the predicted mortality nearly perfectly reflects observed mortality. An exception was the highest risk decile in which observed mortality was significantly lower than predicted mortality. The highest risk decile had a significant proportion discharged to hospice which was treated as survival in our analysis. Other possible explanations include a non-linear relationship with mortality seen at the extremes of illness severity, small sample size in this decile leading to greater variance in predictors, and potential ‘overcoding’ among highly complex patient discharges which would increase predicted mortality in our model.
We used Martin22 and Angus23 cohorts to conduct a sensitivity analysis. As reflected by differences in the percent mortality and variation in the measures of acute illness severity seen in Table 1, there is a gradient of illness severity with the Angus cohort representing the largest, but least severely ill population, progressing to the smaller, but more seriously ill Martin cohort, and finally moving to the smallest, but most seriously ill explicitly coded ICD-9-CM severe sepsis cohort. This variation in sensitivity and specificity for identification of severe sepsis cohorts has been previously described by Iwashyna et al.21 Despite the heterogeneity between the three cohorts, our model retained excellent discrimination and manifest better calibration with area under the ROCs in the excellent range for our external validation cohorts (C=0.803 to C=0.838 for Martin and Angus cohorts respectively).
We suggest that our prediction model represents an excellent tool for health services researchers using administrative data. To enhance utilization of our model and ease the time burden required for researchers, we provide part of our statistical programming code in an Appendix. Additionally, we developed a corollary tool that could be utilized by hospital administrators, policy makers, and others who may not have ready access to necessary expertise and resources to utilize the logistic regression model. Our sepsis severity score is derived from our model and each variable is associated with an integer value and culminates in a summative risk of mortality.10 Our score performed well in the first six risk deciles (Figure 2) which included 93% of the studied population. However, the sepsis severity score overestimated mortality across the four highest risk deciles.
We believe that our mortality prediction model and associated score for severe sepsis represents an important new tool that can be applied in a variety of contexts including research, quality improvement, and health policy. However, we acknowledge some limitations to our study. First, our data was derived from administrative sources and thus it’s unknown how it would function if applied to clinically identified cohorts or to clinically derived data sources. Related to this limitation, our large sample size means that statistical significance may be achieved for some variables which have unclear clinical significance. Second, the states we selected provide relatively granular information in their hospital discharge data such that we could ascertain measures such as time to mechanical ventilation and receipt of ICU care. These may not be available for every state in the US thus potentially limiting widespread applicability to administrative data sources. Finally, there are inherent weaknesses in using hospital discharge data which include the retrospective nature of data collection and dependence on the presence or absence of specific ICD-9 and procedure codes.17 However, in severe sepsis specifically, hospital discharge data have been shown to perform well outcome evaluations.18
Conclusions
We developed a severe sepsis mortality prediction model and associated severity score for use with administrative data. We validated the model internally and then externally using three distinct cohorts of patients with severe sepsis. We believe the model and score are important tools that should be utilized to adjust for illness severity within administrative data.
Supplementary Material
Acknowledgments
Financial Support: Telemedicine & Advanced Technology Research Center, Department of Defense grant number W81XWH-10-2-0057 (DWF) and the South Carolina Clinical & Translational Research (SCTR) institute at the Medical University of South Carolina, NIH/NCATS Grant numbers KL2 TR000060 (AJG) and UL1 TR000062 (DWF)
Dr. Ford received support for article research from the National Institutes of Health (NIH) and the department of defense. Dr. Goodwin received support for article research from the NIH. His institution received grant support from the NIH/NCATS (KL2 TR000060 and UL1 TR000062). Dr. Simpson’s institution received funding from the Duke Endowment Foundation and Department of Defense research grant.
Footnotes
Copyright form disclosures: The remaining authors have disclosed that they do not have any potential conflicts of interest.
References
- 1.Smith EE, Shobha N, Dai D, et al. A Risk Score for In-Hospital Death in Patients Admitted With Ischemic or Hemorrhagic Stroke. Journal of the American Heart Association. 2013;2:e005207. doi: 10.1161/JAHA.112.005207. [DOI] [PMC free article] [PubMed] [Google Scholar]
- 2.Kansagara D, Englander H, Salanitro A, et al. Risk prediction models for hospital readmission: a systematic review. Jama. 2011 Oct 19;306(15):1688–1698. doi: 10.1001/jama.2011.1515. [DOI] [PMC free article] [PubMed] [Google Scholar]
- 3.Uematsu H, Kunisawa S, Sasaki N, Ikai H, Imanaka Y. Development of a risk-adjusted in-hospital mortality prediction model for community-acquired pneumonia: a retrospective analysis using a Japanese administrative database. BMC pulmonary medicine. 2014;14:203. doi: 10.1186/1471-2466-14-203. [DOI] [PMC free article] [PubMed] [Google Scholar]
- 4.Chang HY, Weiner JP, Richards TM, Bleich SN, Segal JB. Validating the adapted Diabetes Complications Severity Index in claims data. Am J Manag Care. 2012 Nov;18(11):721–726. [PubMed] [Google Scholar]
- 5.Knaus WA. APACHE 1978–2001: the development of a quality assurance system based on prognosis: milestones and personal reflections. Arch Surg. 2002 Jan;137(1):37–41. doi: 10.1001/archsurg.137.1.37. [DOI] [PubMed] [Google Scholar]
- 6.Ferreira FL, Bota DP, Bross A, Melot C, Vincent JL. Serial evaluation of the SOFA score to predict outcome in critically ill patients. Jama. 2001 Oct 10;286(14):1754–1758. doi: 10.1001/jama.286.14.1754. [DOI] [PubMed] [Google Scholar]
- 7.Le Gall JR, Lemeshow S, Saulnier F. A new Simplified Acute Physiology Score (SAPS II) based on a European/North American multicenter study. Jama. 1993 Dec 22–29;270(24):2957–2963. doi: 10.1001/jama.270.24.2957. [DOI] [PubMed] [Google Scholar]
- 8.Lemeshow S, Teres D, Klar J, Avrunin JS, Gehlbach SH, Rapoport J. Mortality Probability Models (MPM II) based on an international cohort of intensive care unit patients. Jama. 1993 Nov 24;270(20):2478–2486. [PubMed] [Google Scholar]
- 9.Zimmerman JE, Kramer AA, McNair DS, Malila FM. Acute Physiology and Chronic Health Evaluation (APACHE) IV: hospital mortality assessment for today's critically ill patients. Crit Care Med. 2006 May;34(5):1297–1310. doi: 10.1097/01.CCM.0000215112.84523.F0. [DOI] [PubMed] [Google Scholar]
- 10.Osborn TM, Phillips G, Lemeshow S, et al. Sepsis severity score: an internationally derived scoring system from the surviving sepsis campaign database*. Crit Care Med. 2014 Sep;42(9):1969–1976. doi: 10.1097/CCM.0000000000000416. [DOI] [PubMed] [Google Scholar]
- 11.Dellinger RP, Levy MM, Rhodes A, et al. Surviving sepsis campaign: international guidelines for management of severe sepsis and septic shock: 2012. Crit Care Med. 2013 Feb;41(2):580–637. doi: 10.1097/CCM.0b013e31827e83af. [DOI] [PubMed] [Google Scholar]
- 12.Ting G, Schneeweiss S, Scranton R, et al. Development of a health care utilisation data-based index for rheumatoid arthritis severity: a preliminary study. Arthritis research & therapy. 2008;10(4):R95. doi: 10.1186/ar2482. [DOI] [PMC free article] [PubMed] [Google Scholar]
- 13.Ananthakrishnan AN, McGinley EL, Binion DG, Saeian K. A novel risk score to stratify severity of Crohn's disease hospitalizations. Am J Gastroenterol. 2010 Aug;105(8):1799–1807. doi: 10.1038/ajg.2010.105. [DOI] [PubMed] [Google Scholar]
- 14.Pavlovic I, Kern T, Miklavcic D. Comparison of paper-based and electronic data collection process in clinical trials: costs simulation study. Contemporary clinical trials. 2009 Jul;30(4):300–316. doi: 10.1016/j.cct.2009.03.008. [DOI] [PubMed] [Google Scholar]
- 15.Newgard CD, Zive D, Jui J, Weathers C, Daya M. Electronic versus manual data processing: evaluating the use of electronic health records in out-of-hospital clinical research. Acad Emerg Med. 2012 Feb;19(2):217–227. doi: 10.1111/j.1553-2712.2011.01275.x. [DOI] [PMC free article] [PubMed] [Google Scholar]
- 16.Higgins TL. Quantifying risk and benchmarking performance in the adult intensive care unit. J Intensive Care Med. 2007 May-Jun;22(3):141–156. doi: 10.1177/0885066607299520. [DOI] [PubMed] [Google Scholar]
- 17.Greenberg M, Haviland A, Yu H, Farley D. Safety outcomes in the United States: Trends and challenges in measurement. HSR. 2009;44(2):739–755. doi: 10.1111/j.1475-6773.2008.00926.x. [DOI] [PMC free article] [PubMed] [Google Scholar]
- 18.Aylin P, Bottle A, Majeed A. Use of administrative data or clinical databases as predictors of risk of death in hospital: comparison of models. BMJ. 2007 doi: 10.1136/bmj.39168.496366.55. [DOI] [PMC free article] [PubMed] [Google Scholar]
- 19.Cooke CR, Iwashyna TJ. Using existing data to address important clinical questions in critical care. Crit Care Med. 2013 Mar;41(3):886–896. doi: 10.1097/CCM.0b013e31827bfc3c. [DOI] [PMC free article] [PubMed] [Google Scholar]
- 20.Lagu T, Lindenauer PK, Rothberg MB, et al. Development and validation of a model that uses enhanced administrative data to predict mortality in patients with sepsis. Crit Care Med. 2011 Nov;39(11):2425–2430. doi: 10.1097/CCM.0b013e31822572e3. [DOI] [PubMed] [Google Scholar]
- 21.Iwashyna TJ, Odden A, Rohde J, et al. Identifying patients with severe sepsis using administrative claims: patient-level validation of the angus implementation of the international consensus conference definition of severe sepsis. Med Care. 2014 Jun;52(6):e39–e43. doi: 10.1097/MLR.0b013e318268ac86. [DOI] [PMC free article] [PubMed] [Google Scholar]
- 22.Martin GS, Mannino DM, Eaton S, Moss M. The epidemiology of sepsis in the United States from 1979 through 2000. New England Journal of Medicine. 2003;348(16):1546–1554. doi: 10.1056/NEJMoa022139. [DOI] [PubMed] [Google Scholar]
- 23.Angus DC, Linde-Zwirble WT, Lidicker J, Clermont G, Carcillo J, Pinsky MR. Epidemiology of severe sepsis in the United States: analysis of incidence, outcome, and associated costs of care. Crit Care Med. 2001 Jul;29(7):1303–1310. doi: 10.1097/00003246-200107000-00002. [DOI] [PubMed] [Google Scholar]
- 24.Centers for Medicare and Medicaid Services. [Accessed March 13, 2015];2014 http://www.cms.gov/Newsroom/MediaReleaseDatabase/Fact-sheets/2014-Fact-sheets-items/2014-08-04-2.html. 2015. [PubMed]
- 25.Poulose JT, Cartin-Ceba R, Shoja A, et al. Comparison of International Classification of Disease Ninth Revision (ICD-9) coding with retrospective case review for the diagnosis of septic shock. Am J Respir Crit Care Med. 2009;179:A4361. [Google Scholar]
- 26.Whittaker SA, Mikkelsen ME, Gaieski DF, Koshy S, Kean C, Fuchs BD. Severe sepsis cohorts derived from claims-based strategies appear to be biased toward a more severely ill patient population. Critical Care Medicine. 2013;41(4):945–953. doi: 10.1097/CCM.0b013e31827466f1. [DOI] [PMC free article] [PubMed] [Google Scholar]
- 27.Elias KM, Moromizato T, Gibbons FK, Christopher KB. Derivation and validation of the acute organ failure score to predict outcome in critically ill patients: a cohort study. Crit Care Med. 2015 Apr;43(4):856–864. doi: 10.1097/CCM.0000000000000858. [DOI] [PubMed] [Google Scholar]
- 28.Oppert M, Engel C, Brunkhorst F-M, et al. Acute renal failure in patients with severe sepsis and septic shock—a significant independent risk factor for mortality: results from the German Prevalence Study. Nephrology Dialysis Transplantation. 2008 Mar 1;23(3):904–909. doi: 10.1093/ndt/gfm610. 2008. [DOI] [PubMed] [Google Scholar]
- 29.Seymour CW, Iwashyna TJ, Ehlenbach WJ, Wunsch H, Cooke CR. Hospital-level variation in the use of intensive care. Health services research. 2012 Oct;47(5):2060–2080. doi: 10.1111/j.1475-6773.2012.01402.x. [DOI] [PMC free article] [PubMed] [Google Scholar]
- 30.Oltean S, Tatulescu D, Bondor C, et al. Charlson's weighted index of comorbidities is useful in assessing the risk of death in septic patients. Journal of critical care. 2012 Aug;27(4):370–375. doi: 10.1016/j.jcrc.2011.08.021. [DOI] [PubMed] [Google Scholar]
- 31.Elixhauser A, Steiner C, Harris DR, Coffey RM. Comorbidity Measures for Use with Administrative Data. Medical Care. 1998;36(1):8–27. doi: 10.1097/00005650-199801000-00004. [DOI] [PubMed] [Google Scholar]
- 32.van Walraven C, Austin PC, Jennings A, Quan H, Forster AJ. A modification of the Elixhauser comorbidity measures into a point system for hospital death using administrative data. Med Care. 2009 Jun;47(6):626–633. doi: 10.1097/MLR.0b013e31819432e5. [DOI] [PubMed] [Google Scholar]
- 33.Paul P, Pennell ML, Lemeshow S. Standardizing the power of the Hosmer-Lemeshow goodness of fit test in large data sets. Statistics in medicine. 2013 Jan 15;32(1):67–80. doi: 10.1002/sim.5525. [DOI] [PubMed] [Google Scholar]
- 34.Whittaker SA, Mikkelsen ME, Gaieski DF, Koshy S, Kean C, Fuchs BD. Severe sepsis cohorts derived from claims-based strategies appear to be biased toward a more severely ill patient population. Crit Care Med. 2013 Apr;41(4):945–953. doi: 10.1097/CCM.0b013e31827466f1. [DOI] [PMC free article] [PubMed] [Google Scholar]
- 35.Goodwin AJ, Rice DA, Simpson KN, Ford DW. Frequency, cost, and risk factors of readmissions among severe sepsis survivors. Crit Care Med. 2015 Apr;43(4):738–746. doi: 10.1097/CCM.0000000000000859. [DOI] [PMC free article] [PubMed] [Google Scholar]
- 36.Knaus W, Zimmerman J, Wagner D, Draper E, Lawrence D. APACHE-acute physiology and chronic health evaluation: a physiologically based classification system. Crit Care Med. 1981 Aug;9(8):591–597. doi: 10.1097/00003246-198108000-00008. [DOI] [PubMed] [Google Scholar]
- 37.Knaus WA, Draper EA, Wagner DP, Zimmerman JE. APACHE II: a severity of disease classification system. Crit Care Med. 1985 Oct;13(10):818–829. [PubMed] [Google Scholar]
- 38.Knaus WA, Wagner DP, Draper EA, et al. The APACHE III prognostic system. Risk prediction of hospital mortality for critically ill hospitalized adults. Chest. 1991 Dec;100(6):1619–1636. doi: 10.1378/chest.100.6.1619. [DOI] [PubMed] [Google Scholar]
- 39.Norton SA, Hogan LA, Holloway RG, Temkin-Greener H, Buckley MJ, Quill TE. Proactive palliative care in the medical intensive care unit: effects on length of stay for selected high-risk patients. Crit Care Med. 2007 Jun;35(6):1530–1535. doi: 10.1097/01.CCM.0000266533.06543.0C. [DOI] [PubMed] [Google Scholar]
Associated Data
This section collects any data citations, data availability statements, or supplementary materials included in this article.