

Abstract
Objectives
To use statistical modeling of neuropsychological data to determine subgroups of dementia patients clinically diagnosed with Alzheimer’s disease (AD) or vascular dementia (VaD) and then, using brain imaging, investigate between group differences in gray and white matter regions of interest.
Methods
An analysis of neuropsychological functioning was obtained from dementia patients clinically diagnosed with AD/VaD characterized with significant leukoaraiosis (LA) and/or lacunes where a k-means cluster analysis requested a 3-group solution. MRI measures of hippocampal, caudate, ventricular, subcortical lacunar infarction, whole brain volume and LA were analyzed. Three regions of LA volumes were quantified and these included the periventricular (5mm around the ventricles), infracortical (5mm beneath the gray matter), and deep (between periventricular and infracortical) regions.
Results
Cluster analysis sorted AD/VaD patients into single domain amnestic (n=41), single-domain dysexecutive (n=26), and multi-domain (n=26) phenotypes. The multi-domain patients exhibited worst performance on language tests; however, multi-domain patients were equally impaired on memory tests when compared to amnestic patients. Statistically-determined groups were relatively dissociated using neuroradiological parameters such that amnestic and multi-domain groups presented with smaller hippocampal volume while the dysexecutive group presented with greater deep, periventricular, and whole brain LA. Neither caudate nor lacunar infarction volume differed between cluster-determined groups. Caudate nucleus volume negatively correlated with total LA in the dysexecutive and multi-domain groups.
Conclusions
Results suggest that embedded within patients diagnosed clinically with AD/VaD spectrum dementia there are at least three distinct subtypes which can be operationally-defined. Further research is needed to assess the neuroradiological substrates underlying statistically-determined AD/VaD spectrum dementia and how statistical modeling can be integrated into existing diagnostic criteria.
Keywords: white matter abnormalities, leukoaraiosis, hippocampus, caudate nucleus, lacune, ventricles, Philadelphia (repeatable) Verbal Learning Test, memory, learning, executive function
Introduction
Recent research suggests that simple and concrete clinical/pathological relationship(s) are lacking in many patients with insidious onset dementia. Indeed, it has been suggested that mixed dementia syndromes consisting of Alzheimer’s and some other neuropathological substrate is the most common form of dementia1, representing as many as 50 percent of cases. Research has demonstrated that Alzheimer’s and vascular pathology appear to represent the most common mixed dementia subtype2–4. The lack of clear linear relationships between clinical presentation and underlying neuropathology is reflected in the remarkable heterogeneity of many patients diagnosed clinically with either Alzheimer disease (AD) or vascular dementia (VaD5–9).
For example, Murray et al.5 described detailed neuropathological profiles obtained from approximately 900 brains of patients diagnosed with AD with Braak neurofibrillary tangle staging equal to or greater than IV. Neurobrillary tangles were measured within two sectors of the hippocampus (CA1 and subiculum) and three cortical association areas (mid-frontal, inferior parietal, and superior temporal). Evidence for three subtypes of AD was found: an association cortex subtype with sparse neuropathological alterations involving hippocampal regions relative to the three cortical association areas; a limbic predominant subtype with significant hippocampal involvement but less neuropathology involving association cortices; and a typical subtype with relatively equal hippocampal and association cortex involvement. Collectively, the association cortical and limbic subtypes accounted for approximately 25 percent of patients studied. Although some clinical differences were reported detailed neuropsychological information regarding these pathological subtypes was not available. Also, the potential effect of vascular disease, well-known to affect the phenotypic expression of dementia8 was not well described.
Noh et al.6 described the MRI phenotypic heterogeneity in patients clinically diagnosed with AD. These researchers examined approximately 150 MRI scans from patients with AD focusing on atrophic alterations as measured by cortical thickness. Cluster analysis, a person-centered statistical algorithm, was used to sort patients into groups. Like Murray et al.5, Noh et al.6 found evidence for three distinct groups: a bilateral medial temporal subtype; a bilateral parietal-precuneus/dorsolateral frontal subtype; and a diffuse atrophy subtype where almost all cortical association areas were involved. Detailed neuropsychological assessment was obtained on these patients. The bilateral parietal/dorsolateral, pre-frontal group presented with a multi-domain neuropsychological profile involving worse performance on tests of verbal serial list learning and language than other groups.
Leukoaraiosis (LA) severity is another factor that may identify group differences. Hachinski et al.10, 11 first used the term leukoaraiois for the hyperintense regions seen on T2 and FLAIR images on magnetic resonance imaging (MRI). Although LA has been reported to be associated with a variety of different pathological processes, LA is often seen in patients clinically diagnosed with dementia and specifically Alzheimer’s disease (AD). For example, it has been reported that up to 86% of patients meeting clinical criteria for AD were found to have evidence of LA12. LA has been attributed to disorders such as amyloid angiopathy that is often associated with AD13 as well as small vessel disease with ischemic injury to the white matter of the cerebral hemispheres14.
Libon et al.7 examined the severity of LA in a group of participants meeting clinical criteria for AD8 or VaD9. All individuals had completed a core protocol of neuropsychological measures that assessed three broad neuropsychological functions. Using latent class analysis (LCA), a person-centered statistical algorithm, the participants with dementia were sorted into distinct clinical cognitive phenotypes. There were two clear single-domain phenotypes: amnesia or a prominent dysexecutive disorder with the latter clearly associated with MRI evidence of LA. Two multi-domain phenotypes were also observed including a mild/multi-domain phenotype with deficits involving declarative memory and naming/lexical access; and a moderate/multi-domain group with deficits in all three neurocognitive domains. The moderate/multi-domain group was particularly interesting for two reasons. First, when neuropsychological performance was examined and compared to the other groups, these patients obtained their lowest scores on tests that assessed naming/lexical access tests. Second, in addition to the low performance on tests that assessed naming/lexical retrieval these patients also revealed an impairment on memory tests that was equal to that of the single-domain amnestic group. Libon et al.7 speculated that the moderate/multi-domain syndrome might be analogous to Murray’s et al.5 ‘typical’ group and when compared to the other groups may have more widespread dysfunction, as well as having greater neuropathological changes involving bitemporal/biparietal association areas of the brain.
The purpose of the current study was to further examine gray and white matter differences within AD and VaD participants previously described by Libon et al.7 To date we know of no study that examined how MRI-defined neuroradiological alterations may be related to neurobehavioral based statistically-determined groups in the AD/VaD spectrum of dementia. In the current research a person-centered statistical algorithm was used to sort dementia patients into distinct phenotypic groups. Thus, the current investigation was designed to extend the findings of Libon et al7 and test the hypothesis that statistically-determined neuropsychological groups can further be dissociated using quantitative MRI measures of key anatomic regions such as hippocampi, caudate and/or whole brain volume; as well as critical evidence of vascular injury. The measurement of vascular injury include the volume and location of lacunae and the extent of leukoaraiosis (LA) in the entire brain, as well as determining the presence of leukoaraiosis in three distinct regions of the brain (infracortical, deep and periventricular).
Methods
Participants
This study included 93 participants who were clinically diagnosed with either AD8 or probable/possible vascular dementia9 (VaD) (mean age= 79.38±5.31; mean education= 12.34±2.53; percent female= 76.34%). This sample is a subset of the corpus of patients described by Libon et al7. Institutional Review Board approval was obtained and all procedures adhered to the principles described in the Declaration of Helsinki. Participants were evaluated at an outpatient memory clinic by a neurologist, neuropsychologist, and social worker. MRI studies of the brain and other laboratory studies were obtained. The MRIs used in this study were obtained within two weeks of these patients’ neuropsychological evaluations. None of the participants presented with an ischemic score >415, a sudden onset of cognitive decline, a stepwise course of progression, or focal cranial nerve, motor or sensory neurological signs. Participants were excluded if there was evidence of major depression, substance abuse or other major psychiatric disorders, a major medical disease including organ failure or thyroid disease, a history of prior neurological disease such as seizure disorder or closed head injury. All patients were Caucasian, reasonably well-educated, and medically stable.
Brain MRI Acquisition
MR scans were available from 64 patients with excluded scans due to corrupt or missing sequences. Participants completed a clinical brain MRI on 1.5 Tesla GE Signa or Genesis system. 3D T1-weighted sequences (repetition time range across scans= 1238 to 1467ms; echo time= 2.5 to 4.6ms; inversion time= 450ms; flip angle= 20 degrees; matrix= 320×192) were reconfigured to 112 to 120 gapless, 2.4mm images allowing for image reconstruction into any plane. LA volumetrics were based on 2D Fluid Attenuated Inversion Recovery (FLAIR) protocols (repetition time ranged across scans= 8402–12800, echo time range= 125 to 147, inversion time range= 1800 to 2200; flip angle= 90 degrees, gap= 5 to 7mm) with volume calculated using an algorithm for slice thickness and gap. The following imaging variables were obtained by trained reliable raters blinded to all clinical data and other raters’ scores.
Neuroimaging Control Variables (Total intracranial Volume, Brain Volume)
Supratentorial Intracranial Volume
This measure was calculated as supratentorial (brain plus associated cerebral spinal fluid with the inner table of the skull as the outer boundary of the segmented image) created using BET from FSL16 and BrainSuite17 with manual modifications performed by trained raters [DSC intra- and inter-rater reliability > 0.99, sample of 10 randomly selected de-identified brains completed on two separate occasions].
Supratentorial Total Brain Volume
This measure was created from masks of surface, deep, and periventricular tissue with CSF, brainstem and cerebellum removed. Final variable= Total Brain Volume corrected for intracranial volume − TBVC − (individual’s Total IntraCranial volume/group average Total IntraCranial volume) × uncorrected Individual Brain Volume)18, 19
Ventricular Volume
This volume was assessed to provide input on whether ventricular volume, which can associate with periventricular LA, differed between groups. The volume of the lateral ventricles was calculated by trained raters using a semi-automated segmentation method in ITK-SNAP (http://www.itksnap.org).20 For this method, the images were pre-processed to restrict the range of intensity values of voxels in order to better delineate ventricle from non-ventricle. Next, “bubbles” were placed throughout the ventricles to serve as seed points for the automated “snake.” The particular parameters controlling the growth of the “snakes” were chosen in order to minimize error and manual clean-up time. Manual clean-up was performed when the automated segmentation snakes crossed into areas outside the lateral ventricles. Intra- and inter-rater spatial overlap and reliability were excellent (inter-rater grand DSC=0.92 ± 0.04; ICC= 0.98, Pearson r= 0.99; intra-rater grand DSC= 0.96 ± 0.03, ICC range= 0.98 – 0.99). Total ventricular volume (mm3) was expressed as a function of total supratentorial brain volume corrected for supratentorial intracranial volume18.
Primary Neuroimaging Variables of Interest
Hippocampal Volume
Bilateral hippocampcal volume was manually segmented from T1-weighted scans using ITK-SNAP software20 allowing visualizing in all three planes and saved as 3D binary masks. All ratings occurred in native space. Hippocampi were segmented using guidelines21, by a rater blinded to diagnosis with excellent inter-rater and intra-rater spatial overlap and good volume reliability during training (inter-rater: grand DSC= 0.80 ± 0.02, intra-rater: grand DSC= 0.81 ± 0.05). Total hippocampal volume (mm3) was expressed as a function of total supratentorial brain volume corrected for supratentorial intracranial volume18.
Caudate Nucleus Volume
Bilateral caudate nuclei were manually segmented from T1-weighted scans using ITK-SNAP software20 allowing visualization in all three planes and then saved as 3D binary masks. All ratings occurred in native space22. Caudate nulcei were measured by a trained tracer with excellent inter-rater and intra-rater spatial overlap and volume reliability (inter-rater: grand DSC =.81 ± .05, intra-rater grand DSC = .86 ± .05). Once the completed tracing of the caudate in the sagittal, coronal and axial views were completed for one hemisphere, a 3D image view was visible allowing the rater to further confirm that a head and tail component was exemplified. Total caudate volume (mm3) was expressed as a function of total supratentorial brain volume corrected for supratentorial intracranial volume18.
Leukoaraiosis (LA; Figure 1, Supplementary Figure 1)
Figure 1.
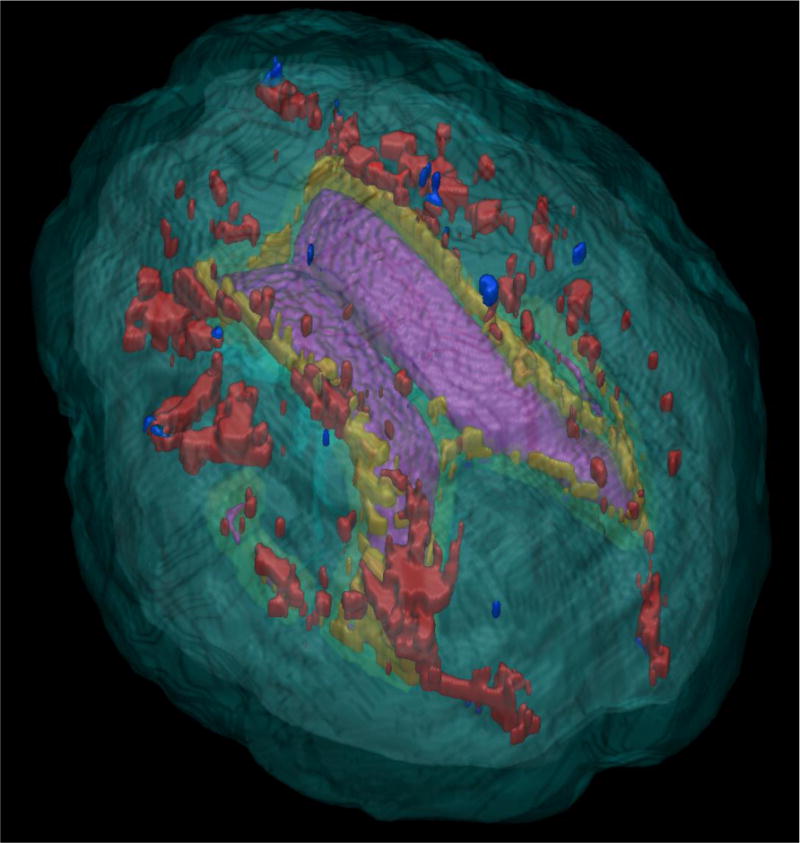
Top-down view of leukoaraiosis (LA) by region. Purple = Lateral Ventricles; Red = Deep region LA; Yellow = Periventricular LA; Blue = Infracortical LA
LA was assessed in native space from FLAIR protocols with semi-automated volumetrics shown to have criterion validity relative to a LA visual rating scale23. A reliable rater (inter-rater range: 0.84 – 0.93; intra-rater range > 0.99) measured all brain scans using in-house macros for ImageJ (http://rsbweb.nih.gov/ij/docs/index.html)24, 25. LA voxels for each brain slice were thresholded (and created into 2D LA binary masks that were then concatenated into a 3D binary mask. Three areas of MRI-LA were a priori operationally defined. For each region of interest, LA was measured as a percent of total white matter and corrected for TBVc. Regions of interest included:
Infracortical LA
LA within 5–8 mm of the internal edge of the cortical gray matter and was hypothesized to disrupt local fiber connections, or u-fibers that travel in a tangential rather than radial fashion connecting areas of cortex to other proximal cortical areas26, 27.
Periventricular LA
LA out to 5mm from the wall of the lateral ventricles. This boundary controlled LA presence induced by partial volume averaging (due to the bending of the lateral ventricles which creates a halo within 2mm of the ventricle wall) and/or loss of ependymal cell layer due to reactive gliosis, both of which may implicate LA as a consequence of artifact or ventricular widening rather than vascular pathology.
Deep LA
LA outside the infracortical and periventricular border zones, so that LA within frontal-striatal as well as long association fibers could be well characterized.
From the binary LA masks, three final proportional LA imaging variables were created: periventricular LA (PV LA= Periventricualar LA seen on FLAIR/Periventricular WM as seen on a T1 weighted image); Infracortical LA (InfraLA= Infracortical LA/Infracortical WM); and Deep LA (Deep LA/Deep WM). Mechanistically, the regions were delineated from binary masks of T1 and FLAIR images. Brains were extracted from T1-weighted brain MRIs using BET from FSL. Raters used brain center of gravity and fractional intensity to achieve the best extraction. BrainSuite928 and rater reviews produced prosencephalon masks (brain minus cerebellum & brainstem) and white matter regions as seen on a T1-weighted image. In-house dilation and erosion scripts using fslmaths aided delineation of LA regions. Brain masks and LA masks were then co-registered using FSL FLIRT29, 30. The BET brain was eroded four times (corresponding to 5mm underneath the cortex) to create a surface mask for this region. Ventricle masks (intra and inter rater reliability >0.99; ITK-SNAP) were dilated four times and then subtracted from the original ventricle masks to create the periventricular masks. The deep region was delineated by subtracting the infracortical and periventricular masks from the entire prosencephalon mask. Three final proportional imaging variables were created: periventricular LA (Periventricualar LA/Periventricular WM); Infracortical LA (Infracortical LA/Infracortical WM); and Deep LA (Deep LA/Deep WM).
Lacunar Infarction
Lacunae were measured for total volume as well as their location within subcortical gray and key frontal-subcortical white matter pathways (i.e., thalamus, basal ganglia structures, internal capsule). Lacune location was recorded in seven areas including four white matter and three gray matter regions by each hemisphere. The white matter regions consisted of the infra-cortical region, periventricular space, deep region, and the anterior limb of the internal capsule. The subcortical gray matter structures that were assessed were the caudate, thalamus, putamen and globus pallidus. A reliable rater (inter-rater ICC=0.85, p< 0.001; CI+0.74–0.92; intra-rater ICC= 0.96; CI = 0.93–0.98 via 15 brains blinded and randomized for a total of 45 scans) trained by a neuroradiologist (IS) examined each brain for lacunae. All ratings were then checked by a second rater blind to diagnosis. Questionable regions were examined with a consensus of three trained raters. Only well-defined, dark lesions with a diameter ≥2 mm that held a stationary position between slices were graded. Lacunae volumes were based on the formula of a sphere (4/3 πr3), with volumes from each brain summed for an overall mm3 volume31.
Neuropsychological Assessment
Three neuropsychological domains were assessed: executive control; language focusing on naming/lexical retrieval; and declarative memory. Full details regarding neuropsychological measures used can be found in Libon et al7.
Executive Control
This domain was assessed with the Boston Revision of the Wechsler Memory Scale-Mental Control subtest (WMS-MC32,33). The dependent variable derived from this test was a mean accuracy index (AcI) derived from the three non-automatized tasks based on the following algorithm: [1− (false positive + misses/# possible correct) * 100]. This algorithm yielded a percentage score ranging from 0–100, such that participants obtaining a score of 100% correctly identified all targets and made no false positive responses or misses. Executive control was also assessed with tests of letter fluency34 (letters ‘FAS’) where participants were given 60s to generate words, excluding proper nouns, beginning with a specified letter. The dependent variable was the number of responses summed across each letter.
Language (naming/lexical retrieval)
This domain was evaluated with the 60-item version of the Boston Naming Test35 (BNT) and a test of semantic fluency36 (‘animals’). The dependent variable derived from the BNT was the number of correct responses. On the ‘animal’ fluency test patients were given 60s to generate exemplars. The dependent variable was the total number of responses excluding perseverations and intrusion errors.
Episodic Memory
This domain was assessed with the nine word Philadelphia (repeatable) Verbal Learning Test37, 38 (P(r)VLT). Two P(r)VLT variables were used in the current research: total delay free recall and a delay recognition discriminability index. The latter index was calculated using the algorithm originally described by Delis et al.39 [1− (false positive + misses/# possible correct)] * 100)].
Neuropsychological Composite Indices
Similar to Libon et al.7, the six neuropsychological parameters described above were converted to z-scores on the basis of grand means obtained from the total sample. Three neuropsychological composite scores reflecting performance on executive, language, and memory tests were calculated by averaging the two neuropsychological parameters from each neurocognitive domain. The rationale for this procedure was to facilitate both between- and within-group analyses; and to reduce the number of statistical comparisons.
Statistical Analyses
A k-means cluster analysis (SPSSv22) was conducted using the six neuropsychological parameters described above specifying a 3-cluster solution. The rationale for requesting a 3-cluster solution was based on prior research where dementia patients have generally been sorted into single domain amnestic, single domain dysexecutive, as well as multi-domain phenotypic groups. The purpose of a k-mean cluster solution is to identify homogeneous groups of participants based on selected neuropsychological characteristics and to assign each participant to a specific group. Cluster distance was calculated on the basis of simple Euclidean distance.
Using cluster-determined group membership as the independent variable the three composite (z-score) neuropsychological indices was subjected to both between-and within-group parametric analysis with post-hoc tests (Tukey HSD). Neuroradiological parameters were assessed with either non-parametric or parametric analysis of variance (ANOVA), as appropriate, with post-hoc comparisons. For LA parametric analyses, a square root transformation was conducted for the LA proportion metrics due to positive skewness. Group differences were summarized with effect sizes using published guidelines (small d= 0.2; medium d= 0.5; large d= 0.8)40.
Results
Cluster Solution
The 93 dementia patients were sorted into three groups that representing a multi-domain phenotype (n= 26; 21.7%) with low scores on all neuropsychological tests; a dysexecutive phenotype (n= 26; 21.7%) typified by low scores on executive tests with relatively intact performance on the P(r)VLT delayed recognition test condition; and an amnestic phenotype (n= 41; 34.2%) where patients scored low on both P(r)VLT test conditions with relatively better performance on executive and language tests (Table 1).
Table 1.
Cluster Analysis for Each Neuropsychological Measure by Defined Group: Mean, standard deviation, range
| amnestic | multi-domain | dysexecutive | |
|---|---|---|---|
| (n=41) | (n=26) | (n=26) | |
| Neuropsychological Test | |||
| WMS- Mental Control (range) |
85.95 (8.09) 70.33–100.00 |
64.44 (9.82) 40.67–82.33 |
46.74 (12.33) 11.33–63.00 |
| letter fluency (range) |
29.9 (10.27) 12.00–54.00 |
18.46 (8.90) 5.00–41.00 |
19.96 (8.63) 5.00–34.00 |
| Boston Naming Test (range) |
44.87 (7.58) 28.00–56.00 |
28.11 (11.76) 3.00–46.00 |
41.61 (9.72) 15.00–58.00 |
| semantic (‘animal’) fluency (range) |
11.26 (3.69) 4.00–22.00 |
6.26 (2.45) 1.00–10.00 |
9.34 (3.88) 1.00–20.00 |
| P(r)VLT- delayed free recall (range) |
1.31 (1.64) 0.00–6.00 |
0.73 (1.28) 0.00–5.00 |
2.38 (1.91) 00.00–7.00 |
| P(r)VLT- delayed recognition (range) |
71.12 (11.49) 42.00–98.00 |
64.06 (11.05) 39.00–87.00 |
81.89 (7.94) 62.00–100.00 |
| Original Clinical Diagnosis | n= 41 | n= 26 | n= 26 |
| Alzheimer’s disease | 34 | 14 | 5 |
| Vascular Dementia | 7 | 12 | 21 |
WMS= Wechsler Memory Scale Mental subtest (Boston Revision)
Demographic Differences
The three statistically-determined groups did not differ for age (p= 0.60), education (p= 0.30), sex (p= 0.23), or depression (p= 0.35) as measured by the Geriatric Depression Scale (GDS). Groups did differ on the MMSE (F[2, 90]= 11.19, p< 0.001), with the amnestic group producing a higher MMSE score compared to the dysexecutive (p< 0.014) and the multi-domain groups (p< 0.001; Table 2).
Table 2.
Demographic Information and Between-Group Neuropsychological Test Performance (means, standard deviations, minimum/maximum)
| amnestic (n=41) |
multi-domain (n=26) |
dysexecutive (n=26) |
F, X2 | p | |
|---|---|---|---|---|---|
| Age | 78.76 ± 4.86 (65/87) |
80.04 ± 5.74 (66/90) |
79.69 ± 5.64 (69/91) |
0.522 | 0.60 |
| Education | 12.78 ± 2.57 (2/16) |
12.19 ± 1.63 (8/16) |
11.81 ± 3.12 (6/20) |
1.24 | 0.29 |
| Sex (M:F) | 12:29 | 3:23 | 7:19 | 2.98 | 0.23 |
| GDS | 3.20 ± 2.77 (0/12) |
3.15 ± 2.72 (0/10) |
4.15 ± 3.30 (0/12) |
1.05 | 0.35 |
| MMSE | 24.10 ± 2.15 (19/29) |
21.12 ± 2.86 (14/25) |
22.23 ± 2.94 (14/28) |
11.19 | <0.001 |
| Executive z-score | 0.79 ± 0.53, (−0.04/2.02) |
−0.27±0.44 (−1.06/0.47) |
−0.67±0.53 (−1.64/0.32) |
73.67 | <0.001 |
| Language z-score | 0.57 ± 0.66 (−0.90/2.09) |
−0.77 ± 0.59 (−2.50/0.20) |
0.19 ± 0.69 (−1.35/1.71) |
34.46 | <0.001 |
| Memory z-score | −0.09 ± 0.80 (−1.64/2.04) |
−0.55 ± 0.65 (−1.76/1.12) |
0.64 ± 0.78 (−0.84/2.70) |
16.39 | <0.001 |
Age = years; Education = years; GDS = Geriatric Depression Scale (max=30; higher=worse); MMSE = Mini Mental State Exam (max=30; higher = better)
Multivariate Between-Group Comparisons
Differences on neuropsychological tests were assessed with a multivariate analysis of variance (MANOVA) where cluster-determined group was the independent variable and three neuropsychological composite z-score indices were the dependent variables. MMSE test performance was co-varied. This analysis yielded significant multivariate effect (Hotelling Trace) for group (F[6, 172]= 28.51 p< 0.001) and performance on the MMSE (F[3, 87]= 7.52, p< 0.001). Subsequent univariate analysis of variance (ANOVA) found significant effects for MMSE performance for the executive (p< 0.002) and language (p< 0.001) z-score composite indices. Despite this, there continued to be significant multivariate effects for groups for all three neuropsychological/z-score composite indices (p< 0.001, all analyses).
Univariate Between-Group Comparisons
Post-hoc ANOVA with Tukey tests generally found that all three groups dissociated from each other on all three neuropsychological/z-score composite indices. For the executive/z-score composite index, the executive group scored lower than both multi-domain (p< 0.017, d= 0.81) and amnestic (p< 0.001, d= 2.72) groups. Also, the multi-domain group scored lower than the amnestic group (p< 0.001, d= 2.17). For the language/z-score composite index, the multi-domain group scored lower than both amnestic and dysexecutive groups (p< 0.001, d’s= −2.14, −1.49 respectively). Finally, on the memory/z-score composite index the amnestic and multi-domain groups scored lowered than the dysexecutive group (p< 0.001, d’s= −0.92, −1.66 respectively).
Univariate Within-Group Comparisons
Within-group analyses found that the multi-domain group performed worse on the language relative to executive composite (p< 0.002, d= −0.95). The dysexecutive group performed worse on executive relative to language and memory composites (p’s< 0.001; d= −1.39 and d= −1.96, respectively); and lower on language compared to memory tests (p< 0.036, d= −0.61). The amnestic group scored lower on memory compared to executive and language tests (p’s< 0.001; d= −1.29, d= −0.89, respectively). There was a modest statistical effect showing that the amnestic group scored lower on language compared to executive tests (p< 0.048; d= −0.37).
Neuroradiological Parameters
Of the 93 participants, 64 had MR scans where movement and full sequences could be analyzed: multi-domain (n= 19); dysexecutive (n= 11); amnestic (n= 34; Table 3). Group differences were assessed with either 1-way ANOVA or non-parametric Kruskal-Wallis analyses followed by Tukey or Mann-Whitney tests (Table 3).
Table 3.
Neuroanatomical Raw Values by Group Type (means, Standard deviations, minimum/maximum)
| amnestic | multi-domain | dysexecutive | F/X2 | p | |
|---|---|---|---|---|---|
| TICV mm3 | 1195889.29 ± 10013.24 (1007631.31/1393192.00) |
1152525.15 ± 106059.68 (926496.13/1387822.75) |
1126177.68 ± 151770.81 (836828.56/1408280.75) |
1.82 | 0.17 |
| Brain mm3 | 1158888.14 ± 108504.72 (985649.63/1353829.97) |
1103237.083±93702.54 (890583.53/1296750.79) |
1081435.36±134714.32 (826828.56/1408280.75) |
2.84 | 0.07 |
| Lat. Vent. mm3 | 46936.13 ± 28036.71 (12665.82/115843.00) |
50108.98 ± 25239.24 (16743.60/105894.92) |
44952.15 ± 28831.24 (12349.72/112043.92) |
0.14 | 0.87 |
| Hippocampi total mm3 | 3872.85 ± 961.85 (2154.88/6643.35) |
3222.90 ± 1032.91 (1464.06/5188.23) |
4236.29 ± 928.26 (2896.20/5758.98) |
4.79 | 0.01 |
| Caudate Nuclei total mm3 | 4768.51 ± 890.53 (2466.83/6625.31) |
4587.54 + 979.67 (3306.30/7665.46) |
4639.44 ± 949.61 (3132.83/5992.92) |
0.26 | 0.78 |
| LA Total mm3 | 16062.11 ± 13785.18 (4493.63/56352.95) |
21525.69 ± 18806.45 (1838.59/72060.74) |
27862.28 ± 16542.23 (6535.69/66731.10) |
7.11 | 0.03 |
| LA PV mm3 | 7714.02 ± 5632.42 (679.52/25417.53) |
10000.81 ± 7670.58 (394.17/35893.22) |
27862.28 ± 16542.23 (6535.69/66731.10) |
7.04 | 0.03 |
| LA Deep mm3 | 7307.50 ± 8208.83 (760.87/35988.04) |
10580.22 ± 11712.16 (1087.03/37297.10) |
13668.72 ± 12283.91 (2580.92/41436.47) |
4.51 | 0.11 |
| LA Infra mm3 | 793.60 ± 914.91 (31.68/4571.41) |
714.93±1025.37 (17.72/4315.51) |
833.41±607.65 (120.31/2120.31) |
2.19 | 0.34 |
| ˆ LA Total % | 4.99 ± 4.91 (1.41/19.20) |
6.70 ± 5.82 (0.63/23.64) |
8.96 ± 5.67 (3.25/23.53) |
10.12 | 0.01 |
| ˆ LA PV % | 20.10 ± 13.86 (1.74/61.37) |
25.38 ± 16.53 (1.17/72.11) |
33.97 ± 18.24 (12.73/70.29) |
7.62 | 0.02 |
| ˆ LA Deep % | 3.89 ± 5.13 (0.40/20.59) |
5.17 ± 5.61 (0.64/18.29) |
7.29 ± 7.22 (1.35/26.36) |
5.96 | 0.05ˆ |
| LA infra % | 0.88±1.03 (0.06/5.34) |
0.99±0.67 (0.02/5.32) |
0.92 ± 1.29 (0.25/2.25) |
2.62 | 0.27 |
| Lacune mm3 | 17.57 ± 50.43 (0.00/231.43) |
11.91±20.10 (0.00/69.64) |
17.09 ± 33.68 (0.00/125.66) |
0.58 | 0.75 |
TICV = Total intracranial volume; Lat. Vent = Lateral Ventricles; LA = Leukoaraiosis; LA PV = LA periventricular; LA Infra = Leukoaraiosis infracortical;
Note; LA % variables are uncorrected for TICV; (Correcting for total intracranial volume, Deep % LA = X2(2)=7.48, p< 0.024)
TBVc/Ventricular Volume
Groups did not differ in total brain volume corrected for intracranial volume (F(2,61)= 2.23, p= 0.18) with post-hoc analyses confirming statistical findings (p’s > 0.27). Similarly, there were no group differences in total raw or normalized ventricle size (p’s > .66).
Leukoaraiosis
A Kruskal-Wallis non-parametric ANOVA found significant group effects for total LA/TICV (H[2]= 12.11, p< 0.002) with this specific to the periventricular (H[2]= 10.43, p< 0.005) and deep white matter regions (H[2]= 7.48, p< 0.024), but not infracortical LA (p= 0.23). Follow-up Mann-Whitney tests showed that the dysexecutive group had a greater distribution of LA relative to the amnestic group for both the periventricular (U= 71, p< 0.002) and deep (U= 92, p< 0.012) regions. The multi-domain group produced a trend relative to the amnestic group for greater LA in periventricular (p< 0.06) and deep regions (p< 0.09), with no statistical difference relative to the dysexecutive group (all p’s > .17). Separate parametric analyses using log transformed LA as a percentage of white matter and controlling for TICV showed the same between- and within-group findings.
Lacunar Infarctions
There were no group differences in total lacune volume for the brain or specific brain regions (basal ganglia, thalamus, or white matter).
Hippocampal Volume
A 1-way ANOVA for group was significant (F[2, 61]= 5.25, p< 0.008). Post-hoc analyses found smaller hippocampal volume for both the amnestic and multi-domain groups compared to executive group (p< 0.028, Cohen’s d= −0.31; p< 0.006, Cohen’s d= −0.44, respectively). Amnestic and multi-domain groups did not differ for hippocampal volume. For all groups, hippocampal volume was not correlated with either total or regional LA.
Caudate volume
Caudate and LA volumes were corrected for TICV, with LA volumes transformed for skewness. There were no between-group differences in caudate volume (p> 0.45). However, within-group Pearson correlations found that reduced caudate volume negatively associated with increasing total LA only for the multi-domain (r(19) = −0.72, p< 0.001) and dysexecutive (r(11)= −.67, p< 0.03) groups (amnestic group; r= −0.04, p= 0.82). One potential outlier was identified in the multi-domain group. The relationship remained after removing the outlier (multi-domain: r(18)= −0.50, p< 0.04).
Discussion
Review of Findings
Heterogeneous dementia syndromes are quite common. Syndromes presenting with concomitant AD and vascular pathology are likely the most common mixed dementia subtype2–4. In the current research, we reassessed a portion of patients previously described by Libon et al.7, who had been diagnosed with either AD or VaD, for clinical heterogeneity. We then assessed if the statistically-determined neuropsychological groups could be dissociated using neuroradiological parameters including measures of regional LA, lacunes, hippocampal, and caudate volume. Whereas clinical heterogeneity was addressed by Libon et al.3; imaging evaluation for lacunes, regional LA, and caudate volume were not fully assessed and not all radiological parameters were quantified.
The cluster analysis used in the current research produced a similar solution as described by Libon et al.7 in that single-domain amnestic, single-domain dysexecutive, and multi-domain domain groups were identified. The single-domain amnestic and dysexecutive groups were typified by worse performance on episodic memory and executive tests, respectively. The multi-domain patients produced their lowest scores on language tests; however, these patients also presented with an impairment on episodic memory tests that was equal to those in the amnestic group.
Consistent with the goals of the current study, between group differences based on statistically-determined analyses of neuropsychological test results, were also obtained using neuroradiological data. The dysexecutive group when compared to the amnestic group presented with greater LA within the deep and periventricular regions as well as in whole brain LA. There were, however, no between-group differences for infracortical LA. The amnestic and multi-domain groups, when compared to the dysexecutive group presented with equally reduced hippocampal volume. No between-group differences were found for caudate volume, total brain size, or ventricular volume; however, reduced caudate volume associated with increased LA were found in the multi-domain and dysexecutive group. Collectively, these data confirm the importance of LA and hippocampal volume as contributing to the phenotypic expression in statistically-determined AD/VaD spectrum dementia.
There is now a growing literature indicating that the clinical heterogeneity in AD/VaD can be operationally defined using statistical algorithms41–46. The significance of the literature addresses how to best characterize antemortem AD/VaD spectrum phenotypes. Traditionally, discussion regarding AD subtypes has revolved around the clinical entities such as posterior cortical atrophy, logopenic/primary progressive aphasia and a ‘frontal’/AD subtype with alterations in personality and comportment. These clinical syndromes, however, account for only a very small portion of patients with dementia. In addition, recent research suggests that there can be substantial variability regarding the biological substrates associated with some of these syndromes47, 48. By contrast, at the current time well-tested diagnostic criteria for mixed AD/VaD dementia are lacking49. Nonetheless, proper characterization of mixed AD/VaD spectrum dementia patients could have significant clinical implication. For example, a recent review of the literature suggests some benefit in mixed AD/VaD dementia using cholinesterase inhibitor therapy50. Statistical modeling analyses of neuropsychological and neuroradiological data obtained from patients diagnosed clinically with AD/VaD spectrum dementia may eventually be used to propose operational diagnostic criteria for ‘mixed dementia syndromes’.
Consensus AD/VaD Diagnostic Criteria and Statistically-Determined Phenotypes Subtypes
The current research found evidence for a single-domain amnestic subtype where anterograde amnesia was the most striking neuropsychological feature. These patients also presented with reduced hippocampal volume. The combination of a circumscribed amnesia coupled with reduced hippocampal volume is consistent with prior research demonstrating existence of specific, circumscribed regional atrophy measured with MRI coupled with specific neuropsychological syndromes51, 52. Using AD diagnostic criteria proposed by McKhann et al.53 and Dubois et al1, 54 our statistically-determined amnestic group certainly meet the core clinical criteria for probable/typical AD. The differential atrophy involving hippocampus volume with a paucity of vascular lesions seen on MRI scans in this group may be consistent with added diagnostic criteria suggested by both McKhann et al.53 and Dubois et al.1, 54.
The current research also identified a single-domain, cluster-determined dysexecutive group. These patients presented with greater deep, periventricular, as well as whole brain LA compared to the amnestic group. Additionally, the current research found that increasing LA load among dysexecutive (and multi-domain) patients is correlated with reduced caudate nuclei volume. Although there were no frank between-group differences in caudate nuclei volume, this correlation suggests compromised frontal-subcortical networks. Fibers traveling to the striatum from the frontal lobes have least two major components26, 55. Initially, the fibers course along with the long association fibers traveling within the frontal-occipital fasciculus lying just rostral to the lateral ventricle. These tracts separate with some fibers traveling to the subcallosal fasciculus of Muratoff eventually ending within the caudate nucleus and putamen. Another group of striatal fibers enters the external capsule thereby targeting the ventral part of the caudate nucleus, the putamen, and claustrum. Increasing LA within the deep and periventricular region, as seen in the dysexecutive group (and multi-domain group) would theoretically result in disruption to caudate nuclei input and output systems. Additional research examining the relationship between LA burden, caudate nucleus volume, as well as cortical atrophy56, and patterns of performance on neuropsychological tests is warranted and may provide additional insight regarding the antemortem characterization of AD/VaD spectrum patients both cognitively and affectively.
A superficial analysis of this statistically-determined group might suggest that these dysexecutive patients are best described as VaD rather than AD. However, despite the high volume of LA, the association between LA and caudate volume, and concomitant executive impairment in this group, there is no reason why these patients could not also present with sufficient gray matter pathology to qualify for a postmortem confirmed diagnosis of AD. Recent research has shown that among some insidious onset dementia patients there appears to be a synergistic effect suggesting that the presence of significant vascular pathology can lower the threshold for the emergence of dementia such as AD57, 58. An area for further inquiry is to develop quantitative algorithms that might assess these putative synergistic relationships.
Recent research also suggests potential biological differences regarding dementia patients with greater executive relative to memory impairment. For example, Thomas et al.59 found that dementia patients with greater executive impairment responded better to donepezil than dementia patients with primary amnesia. Dhanjal and Wise60 used MRI to monitor activity in frontal-parietal regions of the brain. After treatment with donepezil, there was increased activity in frontal-parietal regions and better performance on memory tests. One of the first areas to reveal degeneration in patients with AD is the entorhinal cortex and the hippocampus61. These areas are critical for the formation of episodic memories. Medications that increase the levels of acetylcholine may not be able to dramatically alter these areas’ functions. In contrast, if executive dysfunction is related to disconnection caused by leukoaraiosis, then an increase in acetylcholine may be able to improve function in the frontal networks important in executive functions. Considering the proportion of hippocampal to LA volume may assist prediction of medication response. We also recognize that lacunae volume needs more consideration. Prior research has found that a combination of AD/VaD pathology is often present in approximately 50 percent of dementia patients who come to autopsy3, 4. Although our groups did not differ regarding the volume of subcortical infarction, this non-significant finding does not rule out that subcortical infarction may have contributed to the phenotypic expression in our statistically-determined dementia groups.
What, then, is the best diagnosis for the statistically-determined dysexecutive group? McKhann et al.53 cautions against using the diagnosis of probable AD when there is evidence of significant white matter disease. Based on the criteria put forth by McKhann et al.53 and Dubois et al54, 62, the severity of dysexecutive impairment with relatively less impairment on memory tests along with MRI evidence of significant LA suggests that these patients might qualify for a diagnosis of aetiologically multi-domain or mixed (AD/VaD) dementia. Other diagnostic criteria might apply including research criteria for subcortical vascular dementia63 as well as possible VaD/VCI as suggested by Gorelick et al64.
Equally important as diagnosis is how insidious onset dementia patients with disproportionate LA and dysexecutive impairment provide a model to investigate the intersection of white and gray matter pathology as related to dementia. Kim et al.65 have suggested that ischemia could as responsible for hippocampal atrophy. In a review article, Villeneuve and Jagust66 concluded that vascular disease factors may potentiate the impact of amyloid on gray matter such as cortical thickness. Zlokovic67 has looked at the interaction between alterations in the blood-brain barrier (BBB) and its putative role in amyloid accumulation. A ‘2-hit’ or dual action model has been proposed. In this model damage to brain microcirculation (‘hit-one’) results in BBB vascular-related injury associated with leakage of neurotoxic substrate and neuroinflammation. This injury disrupts amyloid clearance (‘hit-two’) leading to amyloid accumulation. According to this ‘two-hit’ model an underlying vascularopathy is responsible for the derailed amyloid clearance and subsequence appearance of tau-related pathology.
Recently, evidence has accumulated suggesting that vascular disease may precede both the emergence of neuropsychological impairment as well as neuropathology, such as amyloid, known to be related to Alzheimer’s disease68, 69. Other researchers have suggested that alterations in vascular functioning may potentiate Abeta_42 production within the cerebral vasculature70. As suggested by the 2-hit model one consequence of BBB damage may be to increase the exchange of amyloid peptides between peripheral blood flow and the brain. Research has demonstrated that peripheral reduction of amyloid peptides may also reduce amyloid levels in the brain71.
Finally, a cluster-determined multi-domain group was identified in the current research. Memory problems with concomitant reduced hippocampal volume were clearly present in this group. Although poor memory test performance was present, this group actually presented with greater impairment on language tests that assess naming/lexical access. The combination of language, as well as memory impairment, suggests that the underlying neuropathology could be widespread and possibly more severe relative to the two single-domain groups. Poor memory test performance along with reduced hippocampal volume in these patients suggests an impairment of the Papez circuit critical for encoding episodic memories. The addition presence of a language impairment might suggests cortical pathology the superior temporal lobe and/or a combination of temporal lobe plus the involvement of other cortical association areas as demonstrated by Murray et al.5 and Noh et al.6. Similar to the single-domain executive group, increased LA volume in this multi-domain group was associated with decreased caudate volume, suggesting that widespread neuropathology and/or atrophy play a role in the neurocognitive profile of this multi-domain group. Under the current criteria the patients in our multi-domain group likely qualify for a diagnosis of either probable AD53 or typical AD1, 54. To further determine how and/if our multi-domain group is meaningfully different from our amnestic group will even require more research.
Implications for Clinical Trials to Treat Dementia
An important question to be addressed in future research is whether statistically-determined multi-domain versus single domain groups might differ regarding outcome in clinical trials designed to treat dementia. The advantage of applying statistical modeling techniques to generic patients falling on an AD/VaD spectrum is that more nuanced clinical presentations are revealed that may suggest further hypotheses regarding location and severity of underlying neuropathology. Currently, patients with suspected AD are recruited for participation for clinical trials based primarily on the basis of consensus panel criteria for AD. We do not criticize this procedure. However, on the basis of our prior research7, the results of the current study, and other research cited above, current umbrella diagnostic criteria for AD/VaD spectrum patients are not able to provide operational definitions of important phenotypic and neuroradiological characteristics. Statistical modeling procedures effectively deal with the problem of clinically ‘mixed’, heterogeneous presentations such that single-domain and multi-domain groups can be defined. Moreover, as discussed above statistical modeling research, does appear to suggest hypotheses regarding the location and severity of neuropathology that may typify each group.
The current algorithm for clinical trials for dementia tends to treat the patients as a single, uniform entity. However, it is possible that a minority of single or multi-domain patients could benefit from a specific treatment. Such potential benefit could be missed without an appreciation of clinical heterogeneity apparently present in AD/VaD spectrum patients. Recruiting dementia patients for clinical trials first using consensus panel criteria and then further subtyping patients using statistical model techniques as used in our prior research3 and as described in the current research could identify a minority, but nonetheless, meaningful group of dementia patients that might benefit from a specific treatment.
Limitations and Strengths
The current research is not without limitations. The number patients with useable MRI protocols were modest and only a limited array of gray and white matter measures were available for study. Another limitation in the current research was the demographics of our sample. Different neuropsychological/neuroradiological relationships may have emerged if a broader demographic group has been studied. Also, modest sample size did not permit analysis for gender. Strengths of the current research revolve around how antemortem characteristics of AD/VaD spectrum patients were characterized. For example, the current findings, in conjunction with other studies5, 6, 72, suggest that nuanced phenotypic subtypes are rather common in AD/VaD spectrum dementia. An additional strength of the current research is the capacity of statistical algorithms to operationally-define threshold effects23, 73 regarding when MRI evidence of LA is clinically meaningful. All of these factors have implications for clinical trials designed to treat AD as well as understanding when various medical interventions (e.g., elective surgery) may be useful versus detrimental74. With these limitations and strengths in mind, the current research supports the efficiency of future research designed to combine statistically-derived and consensus panel diagnostic paradigms for the diagnosis of insidious onset AD/VaD spectrum dementia patients.
Supplementary Material
Figure 2.
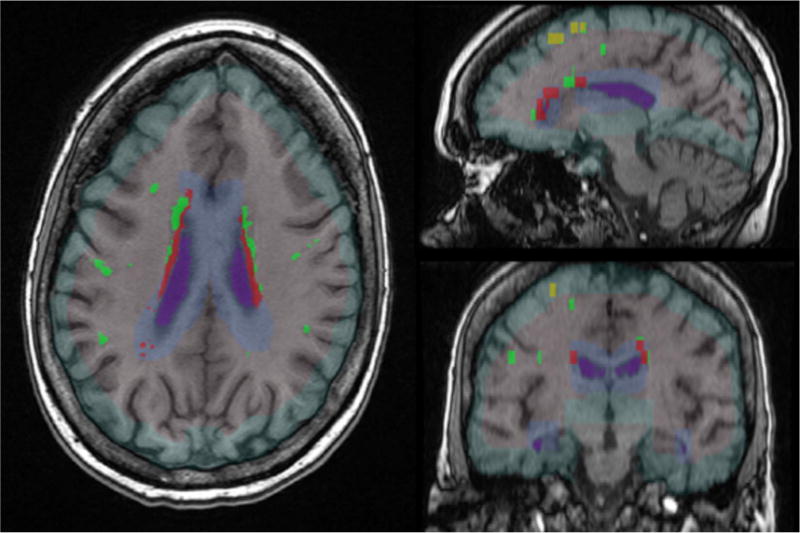
The axial (left), sagittal (upper right), and coronal (lower right) images show the a) white matter boundaries for infracortical (light green), periventricular (light blue), and deep regions of interest, and b) leukoaraiosis that falls within those boundaries (infracortical LA = yellow; periventricular LA = red; deep LA = bright green).
Acknowledgments
Sources of support: We thank the participants involved in this research investigation and the following individuals for their expert brain region of interest segmentation: Sandra Mitchell, Ph.D., Peter Nguyen, M.S., Daniel Manfood, Sylvia Orosco, John Collazo, Sena Moran, Jade Ward, and Lauren Kelley. Funding was partially supported by NINDS (K23NS60660, RO1NS082386; to CP), and Alzheimer’s Association IIRG0627542 (to DJL).
Study Funding/Disclosures: This study was partially supported by NIH (NINDS K23NS60660 and ROI NS082386; NINR ROI NR014181; CP) and Alzheimer’s Association IIRG0627542 (DJL). All authors report no disclosures.
Footnotes
Author Contributions: Price, C. C. – study concept, study supervision/coordination, data acquisition, analysis and interpretation, writing manuscript drafts, securing funding; Tanner, J.J. – acquisition of data and revision of drafts; Schmalfuss, I. – study design, revision of drafts; Heilman, K.M. – study concept, revision of draft; Libon, D.J. – study concept, analysis and interpretation, writing manuscript drafts, securing funding.
References
- 1.Dubois B, Feldman HH, Jacova C, et al. Advancing research diagnostic criteria for Alzheimer’s disease: the IWG-2 criteria. Lancet neurology. 2014;13:614–629. doi: 10.1016/S1474-4422(14)70090-0. [DOI] [PubMed] [Google Scholar]
- 2.Schneider JA, Aggarwal NT, Barnes L, Boyle P, Bennett DA. The neuropathology of older persons with and without dementia from community versus clinic cohorts. J Alzheimers Dis. 2009;18:691–701. doi: 10.3233/JAD-2009-1227. [DOI] [PMC free article] [PubMed] [Google Scholar]
- 3.Schneider JA, Arvanitakis Z, Leurgans SE, Bennett DA. The neuropathology of probable Alzheimer disease and mild cognitive impairment. Annals of neurology. 2009;66:200–208. doi: 10.1002/ana.21706. [DOI] [PMC free article] [PubMed] [Google Scholar]
- 4.Wharton SB, Brayne C, Savva GM, et al. Epidemiological neuropathology: the MRC Cognitive Function and Aging Study experience. J Alzheimers Dis. 2011;25:359–372. doi: 10.3233/JAD-2011-091402. [DOI] [PubMed] [Google Scholar]
- 5.Murray ME, Graff-Radford NR, Ross OA, Petersen RC, Duara R, Dickson DW. Neuropathologically defined subtypes of Alzheimer’s disease with distinct clinical characteristics: a retrospective study. Lancet neurology. 2011;10:785–796. doi: 10.1016/S1474-4422(11)70156-9. [DOI] [PMC free article] [PubMed] [Google Scholar]
- 6.Noh Y, Jeon S, Lee JM, et al. Anatomical heterogeneity of Alzheimer disease: based on cortical thickness on MRIs. Neurology. 2014;83:1936–1944. doi: 10.1212/WNL.0000000000001003. [DOI] [PMC free article] [PubMed] [Google Scholar]
- 7.Libon DJ, Drabick DA, Giovannetti T, et al. Neuropsychological syndromes associated with Alzheimer’s/vascular dementia: a latent class analysis. J Alzheimers Dis. 2014;42:999–1014. doi: 10.3233/JAD-132147. [DOI] [PubMed] [Google Scholar]
- 8.McKhann G, Drachman D, Folstein M, Katzman R, Price D, Stadlan EM. Clinical diagnosis of Alzheimer’s disease: report of the NINCDS-ADRDA Work Group under the auspices of Department of Health and Human Services Task Force on Alzheimer’s Disease. Neurology. 1984;34:939–944. doi: 10.1212/wnl.34.7.939. [DOI] [PubMed] [Google Scholar]
- 9.Chui HC, Victoroff JI, Margolin D, Jagust W, Shankle R, Katzman R. Criteria for the diagnosis of ischemic vascular dementia proposed by the State of California Alzheimer’s Disease Diagnostic and Treatment Centers. Neurology. 1992;42:473–480. doi: 10.1212/wnl.42.3.473. [DOI] [PubMed] [Google Scholar]
- 10.Hachinski VC, Potter P, Merskey H. Leuko-araiosis: an ancient term for a new problem. Can J Neurol Sci. 1986;13:533–534. doi: 10.1017/s0317167100037264. [DOI] [PubMed] [Google Scholar]
- 11.Hachinski VC, Potter P, Merskey H. Leukoaraiosis. Archives of neurology. 1987;44:21–23. doi: 10.1001/archneur.1987.00520130013009. [DOI] [PubMed] [Google Scholar]
- 12.Victoroff J, Mack WJ, Lyness SA, Chui HC. Multicenter clinicopathological correlation in dementia. The American journal of psychiatry. 1995;152:1476–1484. doi: 10.1176/ajp.152.10.1476. [DOI] [PubMed] [Google Scholar]
- 13.Gurol ME, Viswanathan A, Gidicsin C, et al. Cerebral amyloid angiopathy burden associated with leukoaraiosis: a positron emission tomography/magnetic resonance imaging study. Annals of neurology. 2013;73:529–536. doi: 10.1002/ana.23830. [DOI] [PMC free article] [PubMed] [Google Scholar]
- 14.Posluszny DM, Edwards RP, Dew MA, Baum A. Perceived threat and PTSD symptoms in women undergoing surgery for gynecologic cancer or benign conditions. Psycho-oncology. 2011;20:783–787. doi: 10.1002/pon.1771. [DOI] [PubMed] [Google Scholar]
- 15.Hachinski VC, Iliff LD, Zilhka E, et al. Cerebral blood flow in dementia. Archives of neurology. 1975;32:632–637. doi: 10.1001/archneur.1975.00490510088009. [DOI] [PubMed] [Google Scholar]
- 16.Smith SM, Jenkinson M, Woolrich MW, et al. Advances in functional and structural MR image analysis and implementation as FSL. Neuroimage. 2004;23(Suppl 1):S208–219. doi: 10.1016/j.neuroimage.2004.07.051. [DOI] [PubMed] [Google Scholar]
- 17.Shattuck DW, Leahy RM. Brainsuite: An automated cortical surface identification tool. In: Delp SL, DiGioia AM, Jaramaz B, editors. MICCAI 2000, LNCS 1935. Springer-Verlab Berlin Heidelberg; 2000. pp. 50–61. [Google Scholar]
- 18.Bigler ED, Tate DF. Brain volume, intracranial volume, and dementia. Invest Radiol. 2001;36:539–546. doi: 10.1097/00004424-200109000-00006. [DOI] [PubMed] [Google Scholar]
- 19.Bigler ED, Neeley ES, Miller MJ, et al. Cerebral volume loss, cognitive deficit and neuropsychological performance: comparative measures of brain atrophy: I. Dementia Journal of the International Neuropsychological Society: JINS. 2004;10:442–452. doi: 10.1017/S1355617704103111. [DOI] [PubMed] [Google Scholar]
- 20.Yushkevich PA, Piven J, Hazlett HC, et al. User-guided 3D active contour segmentation of anatomical structures: significantly improved efficiency and reliability. NeuroImage. 2006;31:1116–1128. doi: 10.1016/j.neuroimage.2006.01.015. [DOI] [PubMed] [Google Scholar]
- 21.Duvernoy HM. The human hippocampus : functional anatomy, vascularization, and serial sections with MRI. 3rd. Berlin; New York: Springer; 2005. [Google Scholar]
- 22.Schwab NA, Tanner JJ, Nguyen PT, et al. Proof of principle: Transformation approach alters caudate nucleus volume and structure-function associations. Brain Imaging Behav. 2014 doi: 10.1007/s11682-014-9332-x. [DOI] [PMC free article] [PubMed] [Google Scholar]
- 23.Price CC, Mitchell SM, Brumback B, et al. MRI-Leukoaraiosis Thresholds and the Phenotypic Expression of Dementia. Neurology. 2012;79:734–740. doi: 10.1212/WNL.0b013e3182661ef6. [DOI] [PMC free article] [PubMed] [Google Scholar]
- 24.Abramaoff M, Magelhaes P, Ram S. Image processing with ImageJ. Biophotonics International. 2004;11:36–42. [Google Scholar]
- 25.Zijdenbos AP, Dawant BM. Brain segmentation and white matter lesion detection in MR images. Crit Rev Biomed Eng. 1994;22:401–465. [PubMed] [Google Scholar]
- 26.Schmahmann JD, Pandya DN. Fiber pathways of the brain. Oxford; New York: Oxford University Press; 2006. [Google Scholar]
- 27.Schmahmann JD, Pandya DN. Disconnection syndromes of basal ganglia, thalamus, and cerebrocerebellar systems. Cortex. 2008;44:1037–1066. doi: 10.1016/j.cortex.2008.04.004. [DOI] [PMC free article] [PubMed] [Google Scholar]
- 28.Smith SM, Zhang Y, Jenkinson M, et al. Accurate, robust, and automated longitudinal and cross-sectional brain change analysis. NeuroImage. 2002;17:479–489. doi: 10.1006/nimg.2002.1040. [DOI] [PubMed] [Google Scholar]
- 29.Jenkinson M, Smith S. A global optimisation method for robust affine registration of brain images. Med Image Anal. 2001;5:143–156. doi: 10.1016/s1361-8415(01)00036-6. [DOI] [PubMed] [Google Scholar]
- 30.Jenkinson M, Bannister P, Brady M, Smith S. Improved optimization for the robust and accurate linear registration and motion correction of brain images. Neuroimage. 2002;17:825–841. doi: 10.1016/s1053-8119(02)91132-8. [DOI] [PubMed] [Google Scholar]
- 31.Liem MK, van der Grond J, Haan J, et al. Lacunar infarcts are the main correlate with cognitive dysfunction in CADASIL. Stroke; a journal of cerebral circulation. 2007;38:923–928. doi: 10.1161/01.STR.0000257968.24015.bf. [DOI] [PubMed] [Google Scholar]
- 32.Eppig J, Wambach D, Nieves C, et al. Dysexecutive functioning in mild cognitive impairment: derailment in temporal gradients. Journal of the International Neuropsychological Society: JINS. 2012;18:20–28. doi: 10.1017/S1355617711001238. [DOI] [PMC free article] [PubMed] [Google Scholar]
- 33.Lamar M, Price CC, Davis KL, Kaplan E, Libon DJ. Capacity to maintain mental set in dementia. Neuropsychologia. 2002;40:435–445. doi: 10.1016/s0028-3932(01)00125-7. [DOI] [PubMed] [Google Scholar]
- 34.Tombaugh TN, Kozak J, Rees L. Normative data stratified by age and education for two measures of verbal fluency: FAS and animal naming. Archives of clinical neuropsychology: the official journal of the National Academy of Neuropsychologists. 1999;14:167–177. [PubMed] [Google Scholar]
- 35.Kaplan E, Goodglass H, Weintrab S. The Boston Naming Test. Philadelphia: Lea & Febiger; 1983. [Google Scholar]
- 36.Carew TG, Lamar M, Cloud BS, Grossman M, Libon DJ. Impairment in category fluency in ischemic vascular dementia. Neuropsychology. 1997;11:400–412. doi: 10.1037//0894-4105.11.3.400. [DOI] [PubMed] [Google Scholar]
- 37.Price CC, Garrett KD, Jefferson AL, et al. Leukoaraiosis severity and list-learning in dementia. The Clinical neuropsychologist. 2009;23:944–961. doi: 10.1080/13854040802681664. [DOI] [PMC free article] [PubMed] [Google Scholar]
- 38.Libon DJ, Bondi MW, Price CC, et al. Verbal serial list learning in mild cognitive impairment: a profile analysis of interference, forgetting, and errors. Journal of the International Neuropsychological Society: JINS. 2011;17:905–914. doi: 10.1017/S1355617711000944. [DOI] [PMC free article] [PubMed] [Google Scholar]
- 39.Delis DC, Kramer JH, Kaplan E, Ober BA. The California Verbal Learning Test. New York: Psychology Corporation; 1987. [Google Scholar]
- 40.Cohen J. Statistical power analyses for the behavioral sciences. New York: Academic press; 1969. [Google Scholar]
- 41.Davidson JE, Irizarry MC, Bray BC, et al. An exploration of cognitive subgroups in Alzheimer’s disease. Journal of the International Neuropsychological Society: JINS. 2010;16:233–243. doi: 10.1017/S1355617709991160. [DOI] [PMC free article] [PubMed] [Google Scholar]
- 42.Fisher NJ, Rourke BP, Bieliauskas L, Giordani B, Berent S, Foster NL. Neuropsychological subgroups of patients with Alzheimer’s disease. Journal of clinical and experimental neuropsychology. 1996;18:349–370. doi: 10.1080/01688639608408993. [DOI] [PubMed] [Google Scholar]
- 43.Fisher NJ, Rourke BP, Bieliauskas LA. Neuropsychological subgroups of patients with Alzheimer’s disease: an examination of the first 10 years of CERAD data. Journal of clinical and experimental neuropsychology. 1999;21:488–518. doi: 10.1076/jcen.21.4.488.887. [DOI] [PubMed] [Google Scholar]
- 44.Kohler S, Hamel R, Sistermans N, et al. Progression to dementia in memory clinic patients without dementia: a latent profile analysis. Neurology. 2013;81:1342–1349. doi: 10.1212/WNL.0b013e3182a82536. [DOI] [PubMed] [Google Scholar]
- 45.Stopford CL, Snowden JS, Thompson JC, Neary D. Distinct memory profiles in Alzheimer’s disease. Cortex. 2007;43:846–857. doi: 10.1016/s0010-9452(08)70684-1. [DOI] [PubMed] [Google Scholar]
- 46.Stopford CL, Snowden JS, Thompson JC, Neary D. Variability in cognitive presentation of Alzheimer’s disease. Cortex. 2008;44:185–195. doi: 10.1016/j.cortex.2005.11.002. [DOI] [PubMed] [Google Scholar]
- 47.Beh SC, Muthusamy B, Calabresi P, et al. Hiding in plain sight: a closer look at posterior cortical atrophy. Pract Neurol. 2015;15:5–13. doi: 10.1136/practneurol-2014-000883. [DOI] [PubMed] [Google Scholar]
- 48.Crutch SJ, Schott JM, Rabinovici GD, et al. Shining a light on posterior cortical atrophy. Alzheimers Dement. 2013;9:463–465. doi: 10.1016/j.jalz.2012.11.004. [DOI] [PubMed] [Google Scholar]
- 49.Meguro K, Tanaka N, Nakatsuka M, Nakamura K, Satoh M. Vascular lesions in mixed dementia, vascular dementia, and Alzheimer disease with cerebrovascular disease: the Kurihara Project. Journal of the neurological sciences. 2012;322:157–160. doi: 10.1016/j.jns.2012.07.048. [DOI] [PubMed] [Google Scholar]
- 50.Langa KM, Levine DA. The diagnosis and management of mild cognitive impairment: a clinical review. JAMA: the journal of the American Medical Association. 2014;312:2551–2561. doi: 10.1001/jama.2014.13806. [DOI] [PMC free article] [PubMed] [Google Scholar]
- 51.Moller C, Vrenken H, Jiskoot L, Versteeg A, Barkhof F, Scheltens P, van der Flier W. Different patterns of gray matter atrophy in early- and late- onset Alzheimer’s disease. Neurobiology of aging. 2013;34:2014–2022. doi: 10.1016/j.neurobiolaging.2013.02.013. [DOI] [PubMed] [Google Scholar]
- 52.Smits LL, Tijms BM, Benedictus MR, et al. Regional atrophy is associated with impairment in distinct cognitive domains in Alzheimer’s disease. Alzheimers Dement. 2014;10:S299–305. doi: 10.1016/j.jalz.2013.06.007. [DOI] [PubMed] [Google Scholar]
- 53.McKhann GM, Knopman DS, Chertkow H, et al. The diagnosis of dementia due to Alzheimer’s disease: recommendations from the National Institute on Aging-Alzheimer’s Association workgroups on diagnostic guidelines for Alzheimer’s disease. Alzheimers Dement. 2011;7:263–269. doi: 10.1016/j.jalz.2011.03.005. [DOI] [PMC free article] [PubMed] [Google Scholar]
- 54.Halliday G, Lees A, Stern M. Milestones in Parkinson’s disease–clinical and pathologic features. Movement disorders: official journal of the Movement Disorder Society. 2011;26:1015–1021. doi: 10.1002/mds.23669. [DOI] [PubMed] [Google Scholar]
- 55.Schmahmann JD, Smith EE, Eichler FS, Filley CM. Cerebral white matter: neuroanatomy, clinical neurology, and neurobehavioral correlates. Annals of the New York Academy of Sciences. 2008;1142:266–309. doi: 10.1196/annals.1444.017. [DOI] [PMC free article] [PubMed] [Google Scholar]
- 56.Seo SW, Lee JM, Im K, et al. Cortical thinning related to periventricular and deep white matter hyperintensities. Neurobiology of aging. 2011 doi: 10.1016/j.neurobiolaging.2010.12.003. [DOI] [PubMed] [Google Scholar]
- 57.Petrovitch H, Ross GW, Steinhorn SC, et al. AD lesions and infarcts in demented and non-demented Japanese-American men. Annals of neurology. 2005;57:98–103. doi: 10.1002/ana.20318. [DOI] [PubMed] [Google Scholar]
- 58.Snowdon DA, Greiner LH, Mortimer JA, Riley KP, Greiner PA, Markesbery WR. Brain infarction and the clinical expression of Alzheimer disease. The Nun Study JAMA: the journal of the American Medical Association. 1997;277:813–817. [PubMed] [Google Scholar]
- 59.Thomas DA, Libon DJ, Ledakis GE. Treating dementia patients with vascular lesions with donepezil: a preliminary analysis. Applied neuropsychology. 2005;12:12–18. doi: 10.1207/s15324826an1201_3. [DOI] [PubMed] [Google Scholar]
- 60.Dhanjal NS, Wise RJS. Fronto-parietal cognitive control of verbal memory recall in Alzheimer’s Disease. Annals of neurology. doi: 10.1002/ana.24199. in press. [DOI] [PubMed] [Google Scholar]
- 61.Arnold SE, Hyman BT, Flory J, Damasio AR, Van Hoesen GW. The topographical and neuroanatomical distribution of neurofibrillary tangles and neuritic plaques in the cerebral cortex of patients with Alzheimer’s disease. Cereb Cortex. 1991;1:103–116. doi: 10.1093/cercor/1.1.103. [DOI] [PubMed] [Google Scholar]
- 62.Dubois B, Feldman HH, Jacova C, et al. Revising the definition of Alzheimer’s disease: a new lexicon. Lancet neurology. 2010;9:1118–1127. doi: 10.1016/S1474-4422(10)70223-4. [DOI] [PubMed] [Google Scholar]
- 63.Erkinjuntti T, Inzitari D, Pantoni L, et al. Research criteria for subcortical vascular dementia in clinical trials. J Neural Transm Suppl. 2000;59:23–30. doi: 10.1007/978-3-7091-6781-6_4. [DOI] [PubMed] [Google Scholar]
- 64.Gorelick PB, Scuteri A, Black SE, et al. Vascular contributions to cognitive impairment and dementia: a statement for healthcare professionals from the american heart association/american stroke association. Stroke; a journal of cerebral circulation. 2011;42:2672–2713. doi: 10.1161/STR.0b013e3182299496. [DOI] [PMC free article] [PubMed] [Google Scholar]
- 65.Kim GH, Lee JH, Seo SW, et al. Hippocampal volume and shape in pure subcortical vascular dementia. Neurobiology of aging. 2015;36:485–491. doi: 10.1016/j.neurobiolaging.2014.08.009. [DOI] [PubMed] [Google Scholar]
- 66.Villeneuve S, Jagust WJ. Imaging vascular disease and amyloid in the aging brain: Implications for treatment. The Journal of Prevention of Alzheimer’s Disease. 2015;2:64–70. doi: 10.14283/jpad.2015.47. [DOI] [PMC free article] [PubMed] [Google Scholar]
- 67.Zlokovic BV. Neurovascular pathways to neurodegeneration in Alzheimer’s disease and other disorders. Nature reviews Neuroscience. 2011;12:723–738. doi: 10.1038/nrn3114. [DOI] [PMC free article] [PubMed] [Google Scholar]
- 68.Canobbio I, Abubaker AA, Visconte C, Torti M, Pula G. Role of amyloid peptides in vascular dysfunction and platelet dysregulation in Alzheimer’s disease. Frontiers in cellular neuroscience. 2015;9:65. doi: 10.3389/fncel.2015.00065. [DOI] [PMC free article] [PubMed] [Google Scholar]
- 69.Kalaria RN. Risk factors and neurodegenerative mechanisms in stroke related dementia. Panminerva medica. 2012;54:139–148. [PubMed] [Google Scholar]
- 70.Honjo K, Black SE, Verhoeff NP. Alzheimer’s disease, cerebrovascular disease, and the beta-amyloid cascade. Can J Neurol Sci. 2012;39:712–728. doi: 10.1017/s0317167100015547. [DOI] [PubMed] [Google Scholar]
- 71.Sutcliffe JG, Hedlund PB, Thomas EA, Bloom FE, Hilbush BS. Peripheral reduction of beta-amyloid is sufficient to reduce brain beta-amyloid: implications for Alzheimer’s disease. Journal of neuroscience research. 2011;89:808–814. doi: 10.1002/jnr.22603. [DOI] [PubMed] [Google Scholar]
- 72.Duara R, Loewenstein DA, Greig MT, et al. Pre-MCI and MCI: neuropsychological, clinical, and imaging features and progression rates. The American journal of geriatric psychiatry: official journal of the American Association for Geriatric Psychiatry. 2011;19:951–960. doi: 10.1097/JGP.0b013e3182107c69. [DOI] [PMC free article] [PubMed] [Google Scholar]
- 73.Sperling RA, Aisen PS, Beckett LA, et al. Toward defining the preclinical stages of Alzheimer’s disease: recommendations from the National Institute on Aging-Alzheimer’s Association workgroups on diagnostic guidelines for Alzheimer’s disease. Alzheimers Dement. 2011;7:280–292. doi: 10.1016/j.jalz.2011.03.003. [DOI] [PMC free article] [PubMed] [Google Scholar]
- 74.Price CC, Tanner JJ, Schmalfuss I, et al. A pilot study evaluating presurgery neuroanatomical biomarkers for postoperative cognitive decline after total knee arthroplasty in older adults. Anesthesiology. 2014;120:601–613. doi: 10.1097/ALN.0000000000000080. [DOI] [PMC free article] [PubMed] [Google Scholar]
Associated Data
This section collects any data citations, data availability statements, or supplementary materials included in this article.