

Abstract
Ubiquitination is essential for the regulation of cellular protein homeostasis. It also plays a central role in numerous signaling events. Recent advances in the production and availability of antibodies that recognize the Lys-ε-Gly-Gly (K-ε-GG) remnant produced by trypsin digestion of proteins having ubiquitinated lysine side-chains has drastically improved the ability to enrich and detect endogenous ubiquitination sites using mass spectrometry. The following protocol describes the steps required to complete a large-scale ubiquitin experiment for detection of 10,000s of distinct ubiquitination sites from cell lines or tissue samples. Specifically, we present detailed, step-by-step instructions for sample preparation, off-line fractionation by basic pH reversed-phase chromatography, immobilization of the anti-K-ε-GG antibody to beads by chemical cross-linking, antibody enrichment of ubiquitinated peptides and proteomic analysis of enriched samples by LC-MS/MS. Relative quantification can be achieved by performing SILAC labeling of cells. After cell or tissue samples have been prepared for lysis, the described protocol can be completed in approximately 5 d.
Keywords: ubiquitination, proteasome, proteomics, peptide enrichment, Lys-ε-Gly-Gly, K-ε-GG fragment, mass spectrometry, SILAC, anti-K-ε-GG antibody, StageTips
INTRODUCTION
Protein ubiquitination is an important post-translational modification (PTM) essential for regulating protein-turnover through the ubiquitin-proteasome system. Ubiquitination occurs most commonly on the ε-amino group of protein lysine residues through the concerted action of activating (E1), conjugating (E2), and ligating (E3) enzymes1. As ubiquitin itself has 7 lysine residues, substrates can be mono- or poly-ubiquitinated resulting in various ubiquitin chain lengths and topologies that may serve to specifically bind cellular proteins with distinct ubiquitin binding domains1,2.
Historically, identification of protein ubiquitination sites by mass spectrometry has proven to be challenging because of the low stoichiometry of ubiquitinated proteins, the size of the modification itself, and the diversity in resulting ubiquitin chain types. To enhance the identification of low abundance ubiquitinated proteins in complex samples, earlier studies have used over-expressed, affinity tagged ubiquitin systems to aid in the enrichment and identification of ubiquitinated proteins3,4. These methods rely on enrichment of ubiquitinated proteins when ubiquitin is intact and bound to its substrate. After protein digestion, both formerly-ubiquitinated peptides as well as non-ubiquitinated peptides from the enriched substrate proteins and the attached ubiquitin molecules are present in the sample. The increased sample complexity resulting from the presence of non-ubiquitinated peptides makes detection of specific sites of ubiquitination challenging. Protein-level enrichment methods have enabled detection of several thousand putative, ubiquitinated substrate proteins but lack in the necessary enrichment specificity to enable identification of large numbers of ubiquitination sites.
Robust, large-scale detection of endogenous ubiquitination sites by mass spectrometry requires a technique that facilitates specific enrichment of only the modified lysine containing peptides of ubiquitinated substrate proteins. To this end, global analysis of protein ubiquitination has markedly improved with the commercialization of antibodies specific for the di-glycyl remnant produced on ubiquitinated lysine residues (K-ε-GG) following trypsin digestion5-7. Specifically, trypsin digestion of ubiquitinated proteins cleaves off all but the two C-terminal glycine residues of ubiquitin from the modified protein. These two C-terminal glycine (GG) residues remain linked to the epsilon amino group of the modified lysine residue in the tryptic peptide derived from digestion of the substrate protein. The presence of the GG on the sidechain of that Lys prevents cleavage by trypsin at that site, resulting in an internal modified Lys residue in a formerly ubiquitinated peptide. The K-ε-GG group is recognized and enriched using an anti-K-ε-GG antibody (Figure 1). It should be noted that modification by ubiquitin-like proteins Nedd8 and ISG15 also result in a GG remnant being retained on modified lysine residues which makes ubiquitination, Nedd8ylation, and ISG15ylation indistinguishable based on the tryptic remnant. However, Kim et al. have completed experiments in HCT116 cells showing that >94% of K-ε-GG sites are a result of ubiquitination as opposed to NEDD8ylation or ISG15ylation8. The K-ε-GG enrichment method can be performed with Stable Isotope Labeling by Amino Acids in Cell Culture (SILAC) labeled samples to enable relative quantification of protein ubiquitination across differentially perturbed states6,9
Figure 1.

Enrichment of K-ε-GG peptides using anti-K-ε-GG antibody. After the anti-K-ε-GG antibody has been chemically cross-linked to a Protein A beads using DMP, each of the eight bRP fractions are individually enriched for K-ε-GG peptides using the anti-K-ε-GG antibody which recognizes the di-glycyl remnant remaining on modified lysine residues following trypsin digestion.
The anti-K-ε-GG antibody has been utilized in a growing number of large-scale experiments including those that studied the effects of proteasome or deubiquitinase (DUB) inhibition on the ubiquitin landscape5-7,10, globally identified putative Cullin-RING ligase substrates11, and specifically identified ubiquitinome alterations dependent on the ubiquitin ligase PARKIN12. Additionally, a recent tissue specific analysis of ubiquitination sites in murine tissues revealed both regulation of core signaling pathways and tissue specific networks by ubiquitination13. The anti-K-ε-GG antibody enables the analysis of protein ubiquitination in a site-specific manner which has the potential to reveal the degree of site-specificity or site-promiscuity of E3 ligases for substrate lysine residues4,12.
Our previous work presented a refined workflow for routine detection of 10,000s of distinct ubiquitination sites from single samples through methodological improvements made to both the off-line sample fractionation step as well as the K-ε-GG enrichment step6,14 (Figures 1 and 2). Specifically, we showed that fractionation of samples by basic pH reversed-phase (bRP) chromatography prior to the enrichment of K-ε-GG peptides significantly increases the number of identified and quantified K-ε-GG sites in SILAC labeled samples6,9,14 (Figure 2). Our previous work also demonstrated that chemical cross-linking of the anti-K-ε-GG antibody to a solid support considerably reduces the contamination of antibody fragments and non-K-ε-GG peptides present in the final enriched samples (Figures 1 and 3)6. The following protocol provides complete step-by-step instructions for implementing the procedural workflow for large-scale enrichment and identification of ubiquitinated peptides using mass spectrometry.
Figure 2.

Workflow for preparing samples for K-ε-GG enrichment. Samples are lysed in urea buffer, digested with LysC and Trypsin, and fractionated off-line using bRP chromatography. Fractions are pooled to 8 final fractions (see text for details) for enrichment of K-ε-GG peptides using anti-K-ε-GG antibody.
Figure 3.
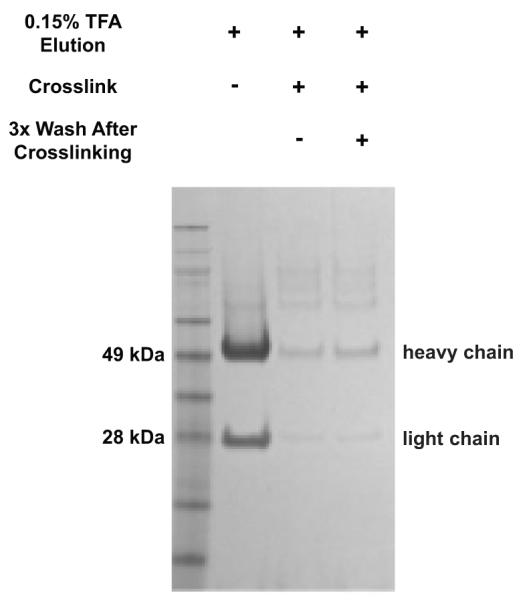
Example of an SDS-PAGE gel used to evaluate the efficiency of antibody cross-linking to Protein A beads. Note this figure has been previously published by Udeshi et al. in ref. 6. TFA eluates from ~30 ug of pre- and post-cross-linked anti-K-ε-GG antibody were analyzed by SDS-PAGE. More than a 10-fold decrease in staining density for heavy and light chains of the antibody is required.
MATERIALS
REAGENTS
Cells or tissue samples
SILAC amino acids
Urea
Tris(hydroxymethyl)aminomethane hydrochloride (Tris HCl)
Sodium chloride (NaCl)
Ethylenediaminetetraacetic acid (ETDA) (Sigma-Aldrich E7889)
Aprotinin (Sigma-Aldrich A610)
Leupeptin (Roche 11017101001)
Phenylmethanesulfonyl fluoride (PMSF) (Sigma-Aldrich 93482)
2,6 diaminopyradine-3,5-bis(thiocynate) (PR-619) (Sigma-Aldrich SML0430)
Chloroacetamide (CAM) (Sigma-Aldrich C0267)
Bicinchoninic acid (BCA) Protein Assay Kit (Pierce 23225)
Dithiothreitol (DTT) (Pierce 20291)
Iodoacetamide (IAM) (Sigma-Aldrich A3221)
LysC (Wako 129-02541)
Sequencing grade modified trypsin (Promega V511X; 1 mg per vial)
Formic acid (FA) (Sigma-Aldrich 56302)
Trifluoroacetic acid (TFA) (Sigma-Aldrich 91707)
Acetonitrile (MeCN) (J.T. Baker 9829-03)
PTMScan® Ubiquitin Remnant Motif (K-ε-GG) Kit (Cell Signaling Technology 5562)
28% Ammonium hydroxide solution (NH4OH) (Sigma-Aldrich 338818)
4-Morpholinepropanesulfonic acid (MOPS) (Sigma-Aldrich M5162)
Sodium phosphate dibasic (Sigma-Aldrich S9763)
Sodium tetraborate decahydrate (Sigma-Aldrich S9640)
Ethanolamine (Sigma-Aldrich 398136)
Dimethyl pimelimidate dihydrochloride (DMP) (Sigma-Aldrich D8388)
Phosphate buffered saline (PBS) (Invitrogen 10010-023)
• Lysis Buffer (Step 1)
Stock Solutions: 1 M Tris HCl pH 8.0, 1 M NaCl, 500 mM EDTA, 1 mg/ml Aprotinin, 2 mg/ml Leupeptin, 100 mM PMSF in ethanol, 500 mM chloroacetamide or iodoacetamide, 40 mM PR-619 in DMSO
Urea lysis buffer: 8 M urea, 50 mM Tris HCl pH 8.0, 150 mM NaCl, 1 mM EDTA, 2 ug/ml Aprotinin, 10 ug/ml Leupeptin, 50 uM PR-619, 1 mM chloroacetamide or iodoacetamide, 1 mM PMSF CRITICAL The urea lysis buffer should always be prepared fresh to prevent carbamylation of proteins. PMSF should be added to the lysis buffer immediately before use because the half-life of this inhibitor has been shown to be <35 min in aqueous buffers at pH 8 15.
• Solid Phase Extraction (SPE) Desalting Solvents (Step 12)
Wash Solvent 1: 100% MeCN
Wash Solvent 2: 0.1% TFA
Wash Solvent 3: 0.1% FA
Elution Solvent: 50% MeCN/0.1% FA
<CRITCAL> SPE desalting solvents can be made in advance, stored at room temperature (RT, 20-25 C ), and are stable for up to several weeks.
• Basic pH Reversed (basic RP) Phase Solvents (Step 20)
Stock Solutions: 200 mM ammonium formate (NH4HCO2); to make 1 L of NH4HCO2 combine 25 ml of 28% NH4OH solution, 45 ml of 10 % FA, and 930 ml H20.
Basic pH reversed phase solvent A: 5 mM ammonium formate pH 10/2 % MeCN
Basic pH reversed phase solvent B: 5 mM ammonium formate pH 10/90 % MeCN
<CRITCAL> Basic RP desalting solvents are stable at RT for up to several days.
• Antibody Cross-linking Buffers (Step 24)
Wash buffer: 100 mM sodium borate pH 9.0
Crosslinking buffer: 20 mM DMP in 100 mM sodium borate pH 9.0 CRITICAL DMP solution should be made fresh immediately before each use.
Blocking buffer: 200 mM ethanolamine pH 8.0 (HCl or FA can be used to adjust the pH to 8)
• Immunoaffinity Purification (IAP) Solutions (Step 29)
Stock Solutions: 500 mM MOPS that is brought to pH 7.2 with NaOH, 500 mM sodium phosphate dibasic, 1 M NaCl
IAP Buffer: 50 mM MOPS, pH 7.2, 10 mM sodium phosphate, 50 mM NaCl
<CRITICAL> IAP solutions can be made in advance, stored at RT, and are stable for up to several weeks.
Elution Solution: 0.15 % TFA
• StageTip Solvents (Step 40)
Wash Solvent 1: 100% MeOH
Wash Solvent 2: 0.1% FA
Elution Solvent: 50% MeCN/0.1% FA
<CRITICAL> StageTip solvents can be made in advance, stored at RT, and are stable for up to several weeks.
• UPLC-MS/MS Solvents (Step 9)
Solvent A: 0.1% FA/3% MeCN
Solvent B: 0.1% FA/90% MeCN
EQUIPMENT
Solid-phase extraction cartridge for sample desalting: Sep-Pak tC18 6 cc Vac Cartridge, 500 mg sorbent per Cartridge, 37-55 μm Particle Size (Waters WAT036790)
StageTip adapters for microfuge tubes (Glygen ADP000.24)
Offline HPLC system for basic pH reversed-phase separation: Agilent 1100 series pump equipped with a degasser, autosampler and fraction collector
Column for basic pH reversed phase separation. We use a Zorbax 300 Extend-C18 column 9.4 × 250 mm, 300 Å, 5 um (Agilent) because the silica-based packing material is stable up to pH 11.5. If an alternative reversed-phase column is used for the basic pH reversed-phase separation, insure that the silica-based packing material is stable at high pH. Column should be periodically tested using a simple peptide mixture of the user’s choice to monitor for unwanted peak broadening or shifts in retention time caused by column deterioration over time.
96 deep-well plate: 2 ml round well bottom (Whatman/GE Healthcare 7701-5200)
Solid-phase extraction disk for StageTips: Empore™ C18 Extraction Disk (3M 98060402181 or 98060402173)
Nanospray column for online UPLC-MS/MS analysis: Self-Pack PicoFrit Column 360 um o.d. × 75 um i.d., 10 um i.d. tip, 50 cm length (New Objective PF360-75-10-N-5); ReproSil-Pur 120 Å, C18-AQ, 1.9 um (Dr Maisch, GmbH)
LC system for online LC-MS analysis: Proxeon Easy-nLC 1000 (Thermo Fisher Scientific). We use a Proxeon Easy-nLC 1000 and operate under UPLC conditions however any LC that can deliver nanoflow rates and can operate up to a pressure of 1000 bar can be used for peptide separation. Lower pressure, non-UPLC conditions can also be used for separations, but we have observed that the number of peptides identified in a given experiment will decrease by at least 1.5-fold.
20 cm nanospray column heater (Phoenix S&T PST-CH-20U)
Column heater controller (Phoenix S&T PST-CHC)
Mass spectrometer: Q Exactive or Orbitrap Velos system (Thermo Fisher Scientific) <CRITICAL> We use a Q Exactive mass spectrometer because we find it yields higher numbers of identified K-ε-GG peptides relative to the Orbitrap Velos or Orbitrap Elite systems
REAGENT SETUP
Cell or Tissue preparation
Proteins derived from either cells or tissue samples can be utilized in the protocol. For cell culture systems, cells should be cultured in media and growth conditions appropriate for the given cell type. Typical protein starting amounts used in this workflow are ≥ 5 mg. Cells should be expanded to an appropriate cell number (typically 50-100 × 106 cells) to achieve a suitable protein yield. Cells should be washed 1-2x with PBS to remove residual cell culture media. Proteins are extracted from the resulting cell pellet.
To increase the stoichiometry of ubiquitinated proteins, cells can be treated prior to lysis with a proteasome inhibitor such as MG-132, bortezomib, or epoxomicin5,8,16. The type of proteasome inhibitor used as well as the treatment time and concentration will need to be individually optimized by the user for each experiment. It should be noted that prolonged treatment (>1 hr) with proteasome inhibitors can make it difficult to differentiate ubiquitination sites occurring due to stress induced by inhibiting the proteasome from those sites involved in physiological cellular functions17.
For quantitative analyses, SILAC can be used to differentially label up to 3 cellular states in a single experiment following previously described protocols5,9,18. Note that the use of amine reactive isobaric tags such as iTRAQ or TMT reagents for quantification is not compatible with this protocol if peptides are labeled prior to K-ε-GG enrichment. iTRAQ or TMT reagents will label K-ε-GG sites and we have found that the anti-K-ε-GG antibody will not recognize these labeled species. For tissue samples, we suggest starting with enough tissue to yield at least 5-10 mg of protein.
EQUIPMENT SETUP
StageTip Setup
C18 StageTips are prepared in-house essentially as described by Rappsilber et al.19 using Empore™ C18 Extraction Disks. We pack two plugs of C18 material into each StageTip.
Nanoflow C18 Column
360 um o.d. × 75 um i.d., 10 μm i.d. tip and contains 24 cm of ReproSil-Pur 120 Å, C18-AQ, 1.9 μm resin (we self-pack our nanoflow columns in-house using a pressure bomb at 1,000 PSI).
PROCEDURE
Prepare lysates TIMING 60 min
-
1
Chill urea lysis buffer to 4 C and add lysis buffer to cell pellet to achieve a protein concentration of ≥ 5 mg/ml.
-
2
Clear the lysate by centrifugation at 20,000 × g for 10 min at 4 C. Remove the supernatant resulting after centrifugation and transfer it to a fresh tube.
-
3
Use a BCA assay to estimate the protein concentration.
If you are not working with SILAC labeled samples continue to STEP 5.
-
4
Optional: In the case of SILAC labeled samples, mix an equal amount of proteins (by weight) from each SILAC encoded state to make a single protein solution.
Reduction and alkylation TIMING 2 hrs
-
5
Reduce disulfide bonds by adding DTT to the sample at a final concentration of 5 mM. Incubate at RT for 45 min.
-
6
Carbamidomethylate cysteine residues by adding IAM at a final concentration of 10 mM Incubate for 30 min at RT in the dark.
Enzymatic digestion TIMING 15-18 hrs
-
7
Prior to digestion, dilute the sample 1:4 with 50 mM Tris HCl pH 8.0 to reduce the urea concentration to 2 M.
-
8
To increase the number of fully-cleaved peptides generated following enzymatic digestion, treat samples with endoproteinase LysC prior to trypsin digestion20. If a more rapid digestion procedure is desired, move to STEP 9 and complete only trypsin digestion. For LysC digestion, use an enzyme-to-substrate ratio of 1:50 (w/w) and digest for 2 hrs at RT while shaking. CRITICAL STEP: Check the pH of the reaction using a pH indicator strip at start and end of digestion to insure the pH is in the optimal range for both LysC and trypsin (pH 8 – 8.5).
-
9
For trypsin digestion, use an enzyme-to-substrate ratio of 1:50 (w/w). Complete the trypsin digestion overnight at RT while shaking.
-
10
Quench the digestion reaction by adding TFA to the sample to a final amount of 0.1% and vortex. Insure that the pH of the solution is ≥ 3 using a pH indicator strip prior to desalting.
-
11
Centrifuge peptide solution for 5-10 min at 3,000 × g to remove precipitate (contains mainly urea). Transfer the supernatant into new tube.
Peptide Desalting by Solid phase extraction (SPE). TIMING ≥5 hrs
-
12
Use a 500 mg tC18 SepPak cartridge with a vacuum manifold to desalt peptide samples. CRITICAL STEP As has been previously described in the protocol by Villén and Gygi21, the choice of cartridge size should be based on sample input amount. Capacities for SepPak cartridges are 3-5 % (w/w) of the sorbent weight21. We observed that letting the cartridges run dry during washing or loading can increase sample losses during desalting from 5 % to >20 %.
-
13
Condition cartridge with 5 mL of wash solvent 1 (see REAGENTS)
-
14
Condition cartridge with 5 mL of elution solvent
-
15
Equilibrate cartridge with 4 × 5 mL of wash solvent 2
-
16
Load the sample onto the cartridge in 5 mL aliquots until loading is completed.
-
17
Wash cartridge with 4 × 5 mL with wash solvent 2
-
18
Elute peptides into 15 mL conical tubes with 2 × 3 mL of elution solvent
-
19
Completely dry the eluted peptides by lyophilization (preferred) or by vacuum centrifugation. We find that lyophilization tends to be more consistent at generating a dry, fluffy peptide sample that is easily reconstituted. However, we find that lyophilizing peptide samples can be 2-3x slower relative to vacuum centrifugation.
PAUSE POINT Dried samples are stable and can be stored at −20 C or −80 C for several weeks.
Basic pH Reversed-Phase Fractionation (Figure 2) TIMING 60 min per separation
-
20
Reconstituted peptide samples in basic pH RP solvent A (see REAGENTS) to achieve a concentration <10 mg/ml and centrifuge at 20,000 × g to remove any material that did not go into solution.
-
21
For separation of peptides, utilize the gradient and flow rate settings outlined in the in-text table below. Across the entirety of the bRP separation, a total of 96 2 ml fractions are collected at a flow rate of 3 ml/min. Prior to separation of the peptide sample, a blank gradient should be run to wash and equilibrate the RP column. During the blank gradient, fractions do not need to be collected. CRITICAL STEP We utilize a Zorbax 300 Extend-C18 column 9.4 × 250 mm, 300 Å, 5 μm (Agilent) for separating 6-15 mg of total peptide. However, the scale of the RP C18 column will need to be adjusted if using peptide amounts outside of this range. Do not store Zorbax 300 Extend columns at high pH for extended periods of time (multiple days) when column is not in use as this can permanently decrease column performance.
| Time interval (min) | LC Gradient (%B) |
LC Flow Rate (ml/min) |
|---|---|---|
| 0 | 0 | 3 |
| 5 | 6 | 3 |
| 7 | 8 | 3 |
| 45 | 27 | 3 |
| 49 | 31 | 3 |
| 53 | 39 | 3 |
| 60 | 60 | 3 |
| 64 | 60 | 3 |
-
22
Inject samples onto the bRP column at a flow rate of 3 ml/min and separate as described above. Collect fractions every 0.66 min in a 2 ml 96-well plate (Figure 2). The UV absorbance measurement can be monitored at 214 nm.
-
23
Following separation, pool the bRP fractions in a serpentine, non-contiguous manner (as described below and shown pictorially in Figure 2) to generate 8 final fractions6,14,22,23. Specifically, to generate 8 total fractions, every 8th fraction was combined (Final Fraction 1=1,9,17,25,33,41,49,57,65; Final Fraction 2=2,10,18,26,34,42,50,58,66; …). We find that extremely early and late eluting fractions contain few K-ε-GG peptides and, therefore, we do not utilize these regions for generating the final pooled fractions. CRITICAL STEP The fractions utilized for pooling are specific to our HPLC configuration. Depending on your LC configuration, the specific fractions used for pooling from the 96 well plate may shift relative to what is described above and shown in Figure 2. At this step, a small amount (~5%) of each bRP fraction can be saved prior to pooling to 8 fractions for K-ε-GG enrichment if analysis of the proteome is desired.
-
24
Lyophilize or vacuum centrifuge pooled fractions to dryness.
PAUSE POINT Dried samples are stable and can be stored at −20 C or −80 C for several weeks.
Chemical Cross-Linking of anti-K-ε-GG Antibody to Bead (Figure 1) TIMING 2 hrs
-
25
Wash the antibody-bound beads 3x with 1 ml of antibody cross-linking wash buffer (see REAGENTS). Note that the antibody, as provided, is non-covalently bound to agarose beads. At this step, a small amount of antibody (1-5 ug) can be taken aside to serve as a comparator if a quality control gel is run after cross-linking is completed. We suggest completing this quality control step when cross-linking of the antibody to beads is completed for the first time or a new batch or antibody is utilized.
-
26
Resuspend beads in 1 ml of antibody cross-linking buffer. CRITICAL STEP The antibody cross-linking buffer needs to be made fresh for each use.
-
27
Incubate antibody beads in antibody cross-linking buffer for 30 min at RT with gentle rotation. After cross-linking, if you plan to run a QC gel to test for efficiency of cross-linking, remove the same amount of antibody set aside for the gel in STEP 24. Elute pre- and post-cross-linked antibody from the beads using 0.15% TFA and completely dry eluates. Reconstitute the dried eluate in 1-2x SDS-PAGE sample buffer and 20 mM DTT and incubate at 96 C for 5 min. Separate each eluted antibody sample by SDS-PAGE (see Figure 3).
-
28
Stop the cross-linking reaction by washing beads twice with 1 ml of antibody blocking buffer. Resuspend antibody in 1 ml antibody blocking buffer and incubate for 2 hours at 4 C with gentle rotation.
-
29
Wash cross-linked antibody 3x with 1.5 ml of IAP buffer (see REAGENTS).
PAUSE POINT Cross-linked antibody can be stored in 1x PBS/0.02 % sodium azide for several weeks at 4 C.
Immunoaffinity purification of K-ε-GG peptides (Figure 1) TIMING 2 hrs
CRITICAL For all steps in the enrichment of K-ε-GG peptides except peptide elution, microfuge tubes containing the sample and the antibody beads are kept on ice when not spinning.
-
30
Resuspend 250 ug (40 ul beads) of washed antibody beads in 1 ml of ice cold IAP buffer. Create a homogenous solution of antibody bound beads by pipetting the mixture up and down several times. Aliquot 125 ul of this solution into 8 individual microfuge tubes labeled with the bRP fraction number. Each tube will contain approximately 31 ug of antibody.
-
31
Resuspend each dried peptide sample in 1.5 ml of ice cold IAP buffer.
-
32
After dissolving peptides, check to insure the pH of the solution is ~7 by applying ca. 1 uL of the solution to a paper pH indicator strip. CRITICAL STEP If the pH of the peptide solution is lower than ca. 7, a 1 M Tris solution can be used to increase the pH.
-
33
Centrifuge peptide samples at 20,000 × g for 5 min at 4 C to remove any insoluble material.
-
34
Transfer each bRP pooled peptide sample into the corresponding microfuge tube containing the antibody beads.
-
35
Seal each microfuge tube with parafilm to avoid leakage. Incubate the IPs for 1 hr at 4 C with gentle rotation.
-
36
Centrifuge each IP at 2,000 × g for 1 min, wait for the beads to completely settle to the bottom of the tube, and remove the supernatant. CRITICAL STEP The supernatant contains all unbound, non K-ε-GG peptides and can be saved for additional experiments such as enrichment of other post-translational modifications or proteins.
-
37
Wash beads 2x with 1.5 mL of ice cold IAP buffer followed by 3 washes with ice cold PBS. After adding each wash reagent to the IPs, invert each microfuge tube 5 times, centrifuge at 2,000 × g for 1 minute, wait for beads to completely settle to the bottom of the tube, and remove supernatant. CRITICAL STEP Washes should be completed as quickly as possible to avoid loss of K-ε-GG peptides.
-
38
For elution of K-ε-GG peptides, remove the final wash buffer, pipette 50 ul of IAP elution solution (see REAGENTS) to the antibody beads, gently tap the bottom of the tube several times and let stand at RT for 5 min. CRITICAL STEP We do not vortex samples during this step as beads will stick to the side walls of the microfuge tube and are difficult to recollect at the bottom of the tube after centrifugation.
-
39
Centrifuge the samples at 2,000 × g for 1 min, wait for beads to completely settle to the bottom of the tube, and remove the supernatants containing the eluted peptides and transfer to clean microfuge tubes. Take care to avoid pipetting antibody beads during this step.
-
40
Repeat STEPS 37 and 38 one additional time.
StageTip Desalting TIMING 1 hr
-
41
Prepare 8 StageTips for desalting the enriched K-ε-GG samples as described in EQUIPMENT SETUP and in the protocol by Rappsilber et al.19
PAUSE POINT StageTips can be prepared in advance and stored in a covered pipette tip box for several months.
-
42
Place StageTips on top of microfuge tubes able to hold up to 2 mls using StageTip adapters. CRITICAL STEP All centrifugation steps for StageTip desalting are completed at 3,000-4,000 × g for 3-5 min at RT or until all of the top-loaded solution has traversed the StageTip. Ensure that flow-through does not touch StageTip in 2 ml microfuge tubes.
-
43
Wash the StageTip 1x with 50 ul StageTip wash solvent 1.
-
44
Equilibrate the StageTip 2x with 50 ul StageTip wash solvent 2.
-
45
Load the sample onto the equilibrated StageTip.
-
46
Wash/desalt the sample 2x with 50 ul of StageTip wash solvent 2.
-
47
Elute peptides into clean microfuge tube with 50 ul of StageTip elution solvent.
-
48
Vacuum centrifuge StageTip eluates to dryness. We typically transfer StageTip eluates to HPLC autosampler vials prior to dry down.
LC-MS/MS TIMING 1 day
-
49
Reconstitute each K-ε-GG sample in 8 ul of 0.1 % FA/3 % MeCN and place in LC autosampler that is cooled to 4 C.
-
50
Setup the nanospray column with a column heater that is set to 50 C.
-
51
Analyze each K-ε-GG sample using the UPLC and MS method parameters outlined in the following two tables. For each analysis, we typically inject 4/8 ul of each sample at a flow rate of 500 nl/min. CRITICAL STEP The LC parameters described are specific for high pressure peptide separations using a nanospray column packed with 24 cm of ReproSil-Pur 1.9 μm, C18 resin. The MS parameters are specific for analysis of samples using a Q Exactive mass spectrometer. If non-UPLC conditions are utilized and/or another MS system is used for analysis, the LC and MS parameters described will need to be adjusted.
| Time interval (min) | LC Gradient (%B) |
LC Flow Rate (nl/min) |
|---|---|---|
| 0 | 0 | 200 |
| 2 | 6 | 200 |
| 84 | 30 | 200 |
| 87 | 60 | 200 |
| 90 | 90 | 200 |
| 110 | 90 | 200 |
| 111 | 50 | 200 |
| 120 | 50 | 200 |
| MS Method Parameter | Value |
|---|---|
| Polarity | positive |
| Full MS | |
| Microscans | 1 |
| Resolution | 70,000 |
| AGC Target | 3 × 10⁶ ion counts |
| Maximum Ion Time | 10 ms |
| Scan Range | 300-1800 m/z |
| dd-MS2 | |
| Microscans | 1 |
| AGC Target | 5 × 10⁴ ion counts |
| Maximum Ion Time | 120 ms |
| Loop Count | 12 |
| Isolation Window | 2.5 m/z |
| Fixed First Mass | 100 m/z |
| Normalized Collision Energy | 25 |
| dd Settings | |
| Underfill Ratio | 5% |
| Charge Exclusion | unassigned, 1, ≥7 |
| Peptide Match | on |
| Exclude Isotopes | on |
| Dynamic Exclusion | 20 s |
Data analysis TIMING >1 day
-
51
We typically analyze K-ε-GG MS data from SILAC experiments using MaxQuant24,25. However, there are a number of other suitable programs freely- or commercially-available that can process K-ε-GG data.
-
52
Typical parameters utilized for searching K-ε-GG data with MaxQuant are listed in the table below.
| Parameter | Value |
|---|---|
| Variable modification | Oxidation (M) Acetyl (Protein N-term) GlyGly (K) |
| Fixed modification | Carbamidomethyl (C) |
| Maximum missed cleavages | 2 |
| Maximum charge | 6 |
| First search ppm | 20 |
| Main search ppm | 6 |
| MS/MS tolerance (ppm) | 20 |
| Peptide FDR | 0.01 |
| Site FDR | 0.01 |
| Protein FDR | 0.01 |
| Minimum peptide length | 6 |
? TROUBLESHOOTING
Protein digestion yields peptides with high numbers of missed cleavages
Peptides containing many missed cleavages are difficult to identify using automated search algorithms. If high numbers of missed cleavages are observed, the pH of the digestion buffer used in STEP 7 should be checked as it may be higher or lower than the optimal range of pH 8 to 8.5 which will reduce the activity of LysC or Trypsin. If >2 M urea was present in the sample prior to addition of enzymes or significantly aged enzymes were utilized in the protocol, poor digestion efficiency may also be observed.
SPE cartridge clogs during sample desalting
During STEP 16, if the SPE cartridge flows slowly or stops flowing entirely during sample desalting, digested samples were not sufficiently cleared of insoluble material by centrifugation. Re-centrifuge the remaining sample to remove insoluble material (such as precipitated urea) and load onto a fresh SPE cartridge if the original cartridge is completely clogged. Slow flowing cartridges can still be used but will take significantly longer for the solvents to transit.
QC cross-linking gel indicates a similar amount of antibody is eluted pre- and post-cross-linking
If a QC cross-linking gel was run as described in STEP 26 to assess the efficiency of chemical cross-linking to the beads, the post-cross-linked antibody lane should contain at least 10x less light and heavy chain fragments relative to the pre-cross-linked antibody (Figure 3). If the two samples show similar amounts of antibody eluting from the beads, cross-linking failed. Failure in the cross-linking step may occur if the DMP solution was not made fresh or the stock of DMP had taken on too much moisture (DMP stock is moisture sensitive and should be stored appropriately). Additionally, the efficiency of the cross-linking reaction can be greatly reduced if the pH of the sodium borate/DMP solution is not between 8 and 9. Cross-linking may be completed again on the same aliquot of antibody, but to insure best results, repeat the cross-linking step with fresh antibody.
Abundant early eluting peptides during bRP chromatography
If abundant peptide signals are eluting in the first several minutes of the bRP gradient, the bRP column used in STEPS 21-22 may have been overloaded and the separation should be repeated using less peptide input. If early eluting signals are non-peptidic, insufficient desalting prior to bRP separation may have occurred.
Low yield of K-ε-GG peptides
After completing data analysis, if the yield of K-ε-GG sites is lower than expected, a number of parameters in the workflow should be checked including digestion and cross-linking efficiencies. Issues with the K-ε-GG IP that can lead to poor recovery of K-ε-GG peptides include loss of antibody beads during wash steps (STEP 28), insufficient removal of MOPS buffer during PBS washes (STEP 36), or age of the anti-K-ε-GG antibody. If large numbers of non-K-ε-GG peptides are identified after enrichment, insufficient washing of beads may have occurred. Poorly operating LC-MS systems can also lead to low numbers of identified K-ε-GG peptides.
ANTICIPATED RESULTS
Using the protocol described above, we have previously shown that >10,000 K-ε-GG sites can be identified and quantified in SILAC experiments using ≥5 mg of starting protein sample per SILAC state6. Our previous work has also indicated that chemical cross-linking of the anti-K-ε-GG antibody to solid support significantly reduces the deleterious effects incurred from the presence of antibody fragments and non-K-ε-GG peptides in enriched samples. A representative SDS-PAGE gel used to QC the cross-linking reaction is shown in Figure 36. After cross-linking, the amount of antibody eluted from Protein A beads is reduced by >10x.
We have also found that reduction in sample complexity by off-line bRP fractionation prior to K-ε-GG enrichment (Figure 2) is critical for increasing the yield of K-ε-GG peptides6. A benefit of using the non-contiguous pooling scheme shown in Figure 2 is that each pooled bRP fraction has a uniform distribution of hydrophilic and hydrophobic peptides and therefore will contain similar numbers of K-ε-GG peptides, thereby taking maximum advantage of the available instrument duty-cycle for sequencing ubiquitinated peptides (Figure 4A)6,14,22,23. A previous analysis of ubiquitination sites, completed in full biological triplicate, from SILAC labeled Jurkat cells treated with either MG-132, PR-619, or left untreated shows that approximately 3,100 distinct K-ε-GG peptides are quantified in each bRP fraction and that non-K-ε-GG peptides make up <50% of the total number of quantified peptides in each fraction (Figure 4A)6. We also observed that >75% of peptides typically separate into only one of the 8 basic RP fractions and therefore peptide co-elution interference is significantly reduced in the fractionated samples compared to an unfractionated sample (Figure 4B). Taken together, the ubiquitin workflow enabled quantification and identification of approximately 20,000 distinct K-ε-GG sites from a single triple-encoded SILAC-labeled sample (Figure 4C)6. Figure 5 shows an example annotated MS/MS spectrum of a K-ε-GG-modified peptide6.
Figure 4.

Analysis of K-ε-GG peptide data. A) Bar plot showing the average number of distinct K-ε-GG and non-K-ε-GG peptides identified across 8 bRP fractions for three biological replicates. For this plot, proteins were derived from SILAC-labeled Jurkat cells that were treated with proteasome inhibitor MG-132 or deubiquitinase inhibitor PR-619, or were left untreated6. Approximately 5 mg of protein was input into the K-ε-GG workflow per SILAC state6. B) Pie chart showing the average percentage of K-ε-GG peptides identified in 1, 2, or >2 bRP fractions6. Note that approximately 79% of K-ε-GG peptides are found in only 1 bRP fraction. C) Bar plot showing the average number of distinct K-ε-GG and non-K-ε-GG peptides found in total for the SILAC-based study6.
Figure 5.

MS/MS spectrum of a K-ε-GG peptide. An HCD MS/MS spectrum recorded on the [M+2H]+2 ion at m/z 586.81 of the modified Eukaryotic translation initiation factor 3 subunit C peptide LCKYIYAK harboring one K-ε-GG site (denoted by lower case k) and one carbamidomethylated cysteine residue (denoted by upper case C). Predicted b- and y-type ions are listed above and below the peptide sequence, respectively. Ions observed are labeled in the spectrum and indicate that K554 of the protein is modified with the di-glycine remnant.
ACKNOWLEDGEMENTS
The authors would like to thank Leslie Gaffney for help with illustrations. This work was supported in part by the Broad Institute of MIT and Harvard, and by grants from the US National Cancer Institute (U24CA160034, part of the Clinical Proteomics Tumor Analysis Consortium initiative, to S.A.C.) and National Heart, Lung, and Blood Institute (HHSN268201000033C and R01HL096738 to S.A.C.).
Footnotes
CONTRIBUTIONS
N.D.U., P.M., T.S. and S.A.C. developed the protocol. N.D.U. and S.A.C. wrote the manuscript with input from all authors.
COMPETING FINANCIAL INTERESTS
The authors declare no competing financial interests.
REFERENCES
- 1.Ye Y, Rape M. Building ubiquitin chains: E2 enzymes at work. Nature reviews Molecular cell biology. 2009;10:755–764. doi: 10.1038/nrm2780. [DOI] [PMC free article] [PubMed] [Google Scholar]
- 2.Dikic I, Wakatsuki S, Walters KJ. Ubiquitin-binding domains [mdash] from structures to functions. Nat Rev Mol Cell Biol. 2009;10:659–671. doi: 10.1038/nrm2767. [DOI] [PMC free article] [PubMed] [Google Scholar]
- 3.Peng J, et al. A proteomics approach to understanding protein ubiquitination. Nat Biotechnol. 2003;21:921–926. doi: 10.1038/nbt849. [DOI] [PubMed] [Google Scholar]
- 4.Danielsen JMR, et al. Mass Spectrometric Analysis of Lysine Ubiquitylation Reveals Promiscuity at Site Level. Mol. Cell. Proteomics. 2010;10 doi: 10.1074/mcp.M110.003590. M110.003590. [DOI] [PMC free article] [PubMed] [Google Scholar]
- 5.Udeshi ND, et al. Methods for quantification of in vivo changes in protein ubiquitination following proteasome and deubiquitinase inhibition. Mol. Cell. Proteomics. 2012;11:148–159. doi: 10.1074/mcp.M111.016857. [DOI] [PMC free article] [PubMed] [Google Scholar]
- 6.Udeshi ND, et al. Refined Preparation and Use of Anti-diglycine Remnant (K-ε-GG) Antibody Enables Routine Quantification of 10,000s of Ubiquitination Sites in Single Proteomics Experiments. Molecular & Cellular Proteomics. 2013;12:825–831. doi: 10.1074/mcp.O112.027094. [DOI] [PMC free article] [PubMed] [Google Scholar]
- 7.Kim W, et al. Systematic and Quantitative Assessment of the Ubiquitin-Modified Proteome. Molecular cell. 44:325–340. doi: 10.1016/j.molcel.2011.08.025. [DOI] [PMC free article] [PubMed] [Google Scholar]
- 8.Kim W, et al. Systematic and quantitative assessment of the ubiquitin-modified proteome. Molecular cell. 2011;44:325–340. doi: 10.1016/j.molcel.2011.08.025. [DOI] [PMC free article] [PubMed] [Google Scholar]
- 9.Ong S-E, et al. Stable Isotope Labeling by Amino Acids in Cell Culture, SILAC, as a Simple and Accurate Approach to Expression Proteomics. Mol. Cell. Proteomics. 2002;1:376–386. doi: 10.1074/mcp.m200025-mcp200. [DOI] [PubMed] [Google Scholar]
- 10.Wagner SA, et al. A Proteome-wide, Quantitative Survey of In Vivo Ubiquitylation Sites Reveals Widespread Regulatory Roles. Mol. Cell. Proteomics. 2011;10 doi: 10.1074/mcp.M111.013284. M111.013284. [DOI] [PMC free article] [PubMed] [Google Scholar]
- 11.Emanuele MJ, et al. Global Identification of Modular Cullin-RING Ligase Substrates. Cell. 2011;147:459–474. doi: 10.1016/j.cell.2011.09.019. [DOI] [PMC free article] [PubMed] [Google Scholar]
- 12.Sarraf SA, et al. Landscape of the PARKIN-dependent ubiquitylome in response to mitochondrial depolarization. Nature. 2013 doi: 10.1038/nature12043. [DOI] [PMC free article] [PubMed] [Google Scholar]
- 13.Wagner SA, et al. Proteomic Analyses Reveal Divergent Ubiquitylation Site Patterns in Murine Tissues. Mol. Cell. Proteomics. 2012;11:1578–1585. doi: 10.1074/mcp.M112.017905. [DOI] [PMC free article] [PubMed] [Google Scholar]
- 14.Mertins P, et al. Integrated proteomic analysis of post-translational modifications by serial enrichment. Nat Methods. 2013;10:634–637. doi: 10.1038/nmeth.2518. [DOI] [PMC free article] [PubMed] [Google Scholar]
- 15.James GT. Inactivation of the protease inhibitor phenylmethylsulfonyl fluoride in buffers. Anal Biochem. 1978;86:574–579. doi: 10.1016/0003-2697(78)90784-4. [DOI] [PubMed] [Google Scholar]
- 16.Meng L, et al. Epoxomicin, a potent and selective proteasome inhibitor, exhibits in vivo antiinflammatory activity. Proc Natl Acad Sci U S A. 1999;96:10403–10408. doi: 10.1073/pnas.96.18.10403. [DOI] [PMC free article] [PubMed] [Google Scholar]
- 17.Harper JW, Tan M-KM. Understanding Cullin-RING E3 Biology through Proteomics-based Substrate Identification. Molecular & Cellular Proteomics. 2012;11:1541–1550. doi: 10.1074/mcp.R112.021154. [DOI] [PMC free article] [PubMed] [Google Scholar]
- 18.Ong SE, Mann M. Stable isotope labeling by amino acids in cell culture for quantitative proteomics. Methods Mol Biol. 2007;359:37–52. doi: 10.1007/978-1-59745-255-7_3. [DOI] [PubMed] [Google Scholar]
- 19.Rappsilber J, Mann M, Ishihama Y. Protocol for micro-purification, enrichment, prefractionation and storage of peptides for proteomics using StageTips. Nat. Protocols. 2007;2:1896–1906. doi: 10.1038/nprot.2007.261. [DOI] [PubMed] [Google Scholar]
- 20.Glatter T, et al. Large-Scale Quantitative Assessment of Different In-Solution Protein Digestion Protocols Reveals Superior Cleavage Efficiency of Tandem Lys-C/Trypsin Proteolysis over Trypsin Digestion. Journal of Proteome Research. 2012;11:5145–5156. doi: 10.1021/pr300273g. [DOI] [PubMed] [Google Scholar]
- 21.Villen J, Gygi SP. The SCX/IMAC enrichment approach for global phosphorylation analysis by mass spectrometry. Nat Protoc. 2008;3:1630–1638. doi: 10.1038/nprot.2008.150. [DOI] [PMC free article] [PubMed] [Google Scholar]
- 22.Wang Y, et al. Reversed-phase chromatography with multiple fraction concatenation strategy for proteome profiling of human MCF10A cells. Proteomics. 2011;11:2019–2026. doi: 10.1002/pmic.201000722. [DOI] [PMC free article] [PubMed] [Google Scholar]
- 23.Yang F, Shen Y, Camp DG, 2nd, Smith RD. High-pH reversed-phase chromatography with fraction concatenation for 2D proteomic analysis. Expert Rev Proteomics. 2012;9:129–134. doi: 10.1586/epr.12.15. [DOI] [PMC free article] [PubMed] [Google Scholar]
- 24.Cox J, Mann M. MaxQuant enables high peptide identification rates, individualized p.p.b.-range mass accuracies and proteome-wide protein quantification. Nat Biotech. 2008;26:1367–1372. doi: 10.1038/nbt.1511. [DOI] [PubMed] [Google Scholar]
- 25.Cox J, et al. Andromeda: A Peptide Search Engine Integrated into the MaxQuant Environment. Journal of Proteome Research. 2011;10:1794–1805. doi: 10.1021/pr101065j. [DOI] [PubMed] [Google Scholar]