Abstract
We recorded from lobster and leech neurons with two sharp electrodes filled with solutions often used with these preparations (lobster: 0.6 M K2SO4 or 2.5 M KAc; leech: 4 M KAc), with solutions approximately matching neuron cytoplasm ion concentrations, and with 6.5 M KAc (lobster, leech) and 0.6 M KAc (lobster). We measured membrane potential, input resistance, and transient and sustained depolarization-activated outward current amplitudes in leech and these neuron properties and hyperpolarization-activated current time constant in lobster, every 10 min for 60 min after electrode penetration. Neuron properties varied with electrode fill. For fills with molarities ≥2.5 M, neuron properties also varied strongly with time after electrode penetration. Depending on the property being examined, these variations could be large. In leech, cell size also increased with noncytoplasmic fills. The changes in neuron properties could be due to the ions being injected from the electrodes during current injection. We tested this possibility in lobster with the 2.5 M KAc electrode fill by making measurements only 10 and 60 min after penetration. Neuron properties still changed, although the changes were less extreme. Making measurements every 2 min showed that the time-dependent variations in neuron properties occurred in concert with each other. Neuron property changes with high molarity electrode-fill solutions were great enough to decrease neuron firing strongly. An experiment with 14C-glucose electrode fill confirmed earlier work showing substantial leak from sharp electrodes. Sharp electrode work should thus be performed with cytoplasm-matched electrode fills.
Keywords: current injection, leech, neuron properties, stomatogastric
in whole-cell patch clamp, electrode fill solution ion composition is matched as closely as possible to neuron cytoplasmic composition because of the high leak and consequent cell dialysis that occur with these large-tip diameter electrodes (Hille 2003; Pusch and Neher 1988). Despite their much smaller-tip diameters, substantial leak of electrode contents (Fromm and Schultz 1981), sufficient to cause cell swelling (Stoner et al. 1984) and chloride loading (Eisen and Marder 1982), also occurs with sharp microelectrodes. Nonetheless, sharp electrodes filled with 3 M KCl (much greater than the ionic strength of neuron cytoplasm) solutions were used in the second paper, demonstrating that sharp electrode physiology was possible (Nastuk and Hodgkin 1950). Nastuk and Hodgkin (1950) made this choice to reduce the resistance of their electrodes, because it obviated the need to correct for liquid junctional potentials (see materials and methods). They were aware of the danger of electrode leak using such a high ionic strength electrode fill solution but reasoned that it would have very little effect with the volumes of the muscle fibers from which they were recording and their brief recording durations. (Due to uncontrolled muscle contraction, they typically had to change to a new muscle fiber after each induced muscle-action potential.)
Since that time, a wide variety of electrode fills has been used with sharp electrodes. Widely used solutions include 2.5–4 M KCl, 2–4 M KAc (both typically with low concentrations of KCl), and 0.6 M K2SO4. A great deal of this work includes recordings from neurons, which have much smaller volumes than muscle fibers and for long durations. All of these electrode fill solutions have much greater ionic strengths and very different ion compositions than neuron cytoplasm. Thus this use assumes that cell-compensatory mechanisms can overcome, without changing neuron properties, the ion leak that occurs with high ionic strength electrode fill solutions. To our knowledge, tests of this assumption have never been published. We tested this assumption in lobster (Panulirus interruptus) stomatogastric pyloric dilator (PD) and leech (either Hirudo medicinalis or verbena) (Siddall et al. 2007) Retzius neurons by repeatedly measuring, over 60 min, multiple neuron properties in a two-electrode voltage clamp using low ionic strength electrode fills, high ionic strength fills often used in these preparations, even higher ionic strength fills, or electrode fills that closely matched neuron cytoplasmic ion concentrations [lobster (Junge 1981), modified from Hodgkin (1951), and leech (Deitmer and Schlue 1981, 1983; Hintz et al. 1999; Schlue 1991; Walker and Smith 1973; Walz and Schlue 1982)].
MATERIALS AND METHODS
Electrophysiology.
P. interruptus were obtained from Marinus Scientific (Newport Beach, CA) or South Coast Bio-Marine (San Pedro, CA) and maintained in aquaria with chilled (11–13°C), circulating artificial seawater. Stomachs were dissected in the standard manner (Selverston et al. 1976), and preparations were superfused continuously with 11–13°C P. interruptus saline (in mM): 479 NaCl, 12.8 KCl, 13.7 CaCl2, 3.9 Na2SO4, 10 MgSO4, 11.1 Tris base, 5.1 maleic acid, pH 7.4–7.5. Leeches were obtained from Zuchtegel.de (Halle, Germany; H. verbena) or from Leeches U.S.A. (Westbury, NY; H. medicinalis) and stored in fresh water at 14°C. Animals were dissected in cold leech saline (in mM): 115 NaCl, 4 KCl, 1.8 CaCl2, 10 Hepes, pH 7.4. Individual segmental ganglia (except those of segments five and six, which innervate leech sexual organs) were removed and pinned ventral side up in a Petri dish. The connective tissue sheath overlying the nerve somata was opened immediately before the experiment. Ganglia were superfused continuously with room-temperature leech saline.
Lobster extracellular nerve recordings were made using stainless-steel pin electrodes and a Differential AC Amplifier (A-M Systems, Sequim, WA). Intracellular neuronal recordings were made with glass microelectrodes filled with 0.6 M K2SO4/20 mM KCl (lobster), 0.6 M KAc/20 mM KCl (lobster), 2.5 M KAc/20 mM KCl (lobster), 4 M KAc/20 mM KCl (leech), 6.5 M KAc/20 mM KCl (lobster and leech), squid cytoplasmic fill (20 mM NaCl, 15 mM Na2SO4, 10 mM Hepes, 400 mM potassium gluconate, 10 mM MgCl2), or leech cytoplasmic fill (7.6 mM NaCl, 1.4 mM Na2SO4, 10 mM Hepes, 112 mM potassium gluconate, 0.2 mM MgCl2) and an Axoclamp 2B electrometer. Another common electrode fill solution, KCl, was not used because of the already well-known difficulty of such electrodes causing Cl loading, at least in stomatogastric (lobster) neurons (Eisen and Marder 1982).
All electrodes were pulled with a Sutter Instrument (Novato, CA) Flaming/Brown electrode puller, with settings of heat, 490; pull, 195; velocity, 100; time, 135; and pressure, 515, typical values for sharp electrodes using thin-wall, 1 mm × 0.75 mm borosilicate glass, which gives 0.5–0.7 μm tip diameters. Unbeveled electrode resistances with these electrodes and the above fills were the following: leech cytoplasmic, 70–90 MΩ; leech, 4 M KAc/20 mM KCl, 10–15 MΩ; squid cytoplasmic, 25–35 MΩ; 0.6 M K2SO4/20 mM KCl, 15–20 MΩ; 0.6 M KAc/20 mM KCl, 15–25 MΩ; 2.5 M KAc/20 mM KCl, 10–15 MΩ; 6.5 M KAc/20 mM KCl, 5–10 MΩ. To achieve better clamp control, current injection electrodes were beveled by holding them, by hand, at an approximate 45° angle, with the electrode pointing in the direction of the solution flow, in a stirring solution of 10 g gamma alumina powder (0.05 μ) in 200 ml distilled water for 15–30 s to reduce input resistance (RN) ∼50%. Voltage-monitoring electrodes were never beveled. Data were recorded to a computer using a Cambridge Electronic Design (Cambridge, UK) 1401plus or Power1401 analog-to-digital interface and Spike2 software.
Pyloric neuron cell bodies were identified by correlating intracellular activity with extracellular recordings from the nerves containing their axons (Selverston et al. 1976). Retzius cells were identified based on size and position (Keyser and Lent 1977) and were recorded from either the Axoclamp 2B (U.S. experiments) or an NPI Electronic (Tamm, Germany) two-electrode, voltage-clamp electrometer composed of a BA-01X and a TEC-B-01 (German experiments), after which, data acquisition was as with lobster. All experiments used an agar bridge (4% agar, 3 M KCl) as bath ground. Lobster experiments were all performed in the S. L. Hooper laboratory; leech experiments were performed in both the S. L. Hooper and A. Büschges laboratories.
In some lobster experiments, after neuron identification, saline containing 10 μm picrotoxin (PTX; to block glutamatergic synapses) and 0.1 μm TTX (to block neuron spiking) was applied to the preparation. Completeness of TTX block was assessed by all spiking on the extracellular nerve recordings ceasing, which typically occurred ∼10 min after TTX application. After an additional 10 min, two electrodes were then placed in a PD neuron; prior work from our lab has shown that 20 min is more than sufficient time for PTX to have also taken full effect. Retzius cells are TTX insensitive (Lent 1977); therefore, all leech experiments were performed throughout in normal leech saline. Measurements of lobster neuron properties (see Fig. 1) began 10 min following the second electrode penetration. Because this measurement protocol involved a sequence of current injection stimuli into the neurons, we refer to this protocol as a “stimulation” in the text below. Leech experiments began a variable time following second-electrode penetration but never >10 min after it. See results for voltage-clamp command potential sequence and data analysis.
Fig. 1.
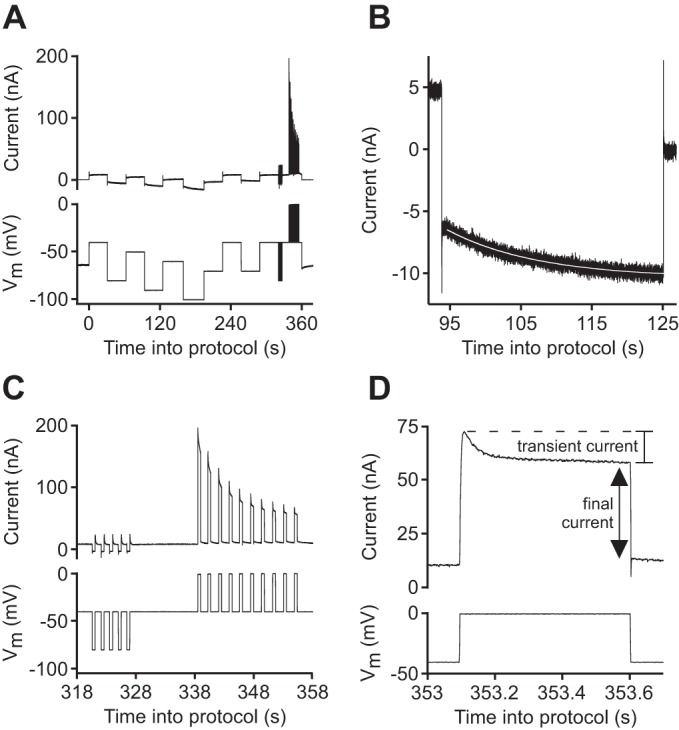
Protocol for measuring membrane potential (Vm), neuron input resistance (RN), hyperpolarization-activated current (Ih) time constant, and transient and sustained (“final”) depolarization-activated currents. A and C: approximately every 10 min, the electrometer was switched into 2-electrode voltage clamp, and (in lobster) a series of 30-s steps was commanded to various voltages, followed by (in lobster and leech) 5, 0.5-s steps from −40 to −80 mV and then 10, 0.5-s steps from −40 to 0 mV. Vm was measured just before the cell was clamped. B: the slow changes in current that occurred during the 30-s steps in lobster were used to calculate Ih time constants. Therefore, we fitted (white line running through data) these changes with a single exponential to measure Ih time constant as a function of Vm. C and D: the 0.5-s hyperpolarizing steps were used to calculate RN and the last 5 of the depolarizing steps to measure the transient and final currents.
Measurement of liquid junction potentials.
With high ionic-strength electrodes, the difference in liquid junction potential with the tip of the electrode in the bathing solution and in the neuron is inconsequential, and it is therefore sufficient simply to “zero” the electrode in the bath. For low ionic strength electrodes, this procedure cannot be used, because the liquid junction potential between the electrode fill solution and the bath will differ substantially from the liquid junction potential between the electrode-fill solution and the cytoplasm. In whole-cell patch-clamp work, which routinely uses low ionic strength, cytoplasm-matched electrode fills, the liquid junction potential correction is calculated from electrode fill ion concentrations and presumed cytoplasm ion concentrations.
Because we recorded from our neurons with two electrodes, we could, alternatively, directly measure this correction. To do so, we first placed a low molarity electrode and an electrode filled with preparation standard fill (lobster, 2.5 M KAc; leech, 4 M KAc) in the bath and zeroed their offsets with the electrometer. We then impaled a neuron of the relevant species with both electrodes. Because both electrodes had been zeroed with their tips in the bath, the difference in membrane potential (Vm) recorded by the two electrodes directly measured the liquid junction potential correction that needed to be applied to the low molarity electrode. For both lobster and leech neurons, we performed this procedure on each low molarity fill in at least six neurons and averaged the differences in measured Vm between the two electrodes. These means were then applied before neuron penetration to all low molarity electrodes in all experiments. For example, when lobster neurons were impaled simultaneously with squid and 2.5 M KAc/20 mM KCl electrodes, the Vm measured by the squid electrodes was, on average, 10 mV more depolarized than that measured by the 2.5 M KAc/20 mM KCl electrodes. Electrometer offsets were therefore initially (when their tips were in the bathing solution) set to −10 mV in all electrodes using squid electrode fill. The offsets for 0.6 M K2SO4, 0.6 M KAc, and leech cyto were −6 mV, −8 mV, and −24 mV, respectively.
14C-Glucose electrode-fill experiment.
Fifty microliters of a 0.08 Ci/ml, 0.26 M glucose (PerkinElmer, Waltham, MA) in water solution was prepared. This solution was used to fill an electrode, and the tip of the electrode was repeatedly placed in drops of water, placed on a small, plastic (hydrophobic) weighing dish. The tip was left in the drops for varying periods of time (30 s to several minutes), and then the electrode tip was removed and the entire drop transferred to a 1.5-ml Eppendorf tube. Serial, 10-fold dilutions were made from the solution in the Eppendorf to ensure that when all tubes were counted, at least some of the dilutions would be within scintillation counter (Packard 1900 TR) capabilities. The radioactive concentration of the electrode-fill solution was calibrated by similar serial dilution and counting all of the serial dilution tubes. In both cases, several serial dilutions had above background counts but few enough counts that scintillation counter limits were not exceeded. The data from all of these acceptable dilutions were combined when calculating the radioactive concentration of the electrode fill solution and the amount of glucose that had leaked into the drop in which the electrode tip was placed.
Statistics.
Statistics were performed in either KaleidaGraph (Synergy Software, Reading, PA) or Origin (OriginLab, Northampton, MA). Examination of the data showed that electrode fill affected cell properties in two ways. The first is that in some cases, different fills changed the property's values at all times in the experiment (see, for example, squid vs. 2.5 M and 6.5 M KAc data in Fig. 4). The second is that with some fills, the cell property changed with time into the experiment (see, for example, 2.5 M and 6.5 M KAc data in Figs. 3 and 5). In some of these cases, early in the experiment, the property could be much larger than the values of the property with other fills at any time and late in the experiment, much smaller than the values of the property with other fills at any time (see, for example, squid vs. 2.5 M KAc data in Fig. 5). In this example, the squid and 2.5 M KAc transient currents at 0 min differ significantly, as they also do at 10, 40, and 50 min. However, at times 0 and 10 min and at times 40 and 50 min, they vary in different ways: at 0 and 10 min, the 2.5 M KAc data are greater than the squid data at any time, but at 40 and 50 min, they are less than the squid data at any time. As a result of the 2.5 M KAc data beginning at a greater value than any of the squid data and ending at a lower value than any of the squid data, the use of a two-way ANOVA, with time and fill type as factors and a Tukey's post hoc, identifies 2.5 M KAc and squid as not differing. This is clearly not the case: the 2.5 M KAc data show an extremely pronounced dependence on time into the experiment, whereas the squid data show none.
Fig. 4.
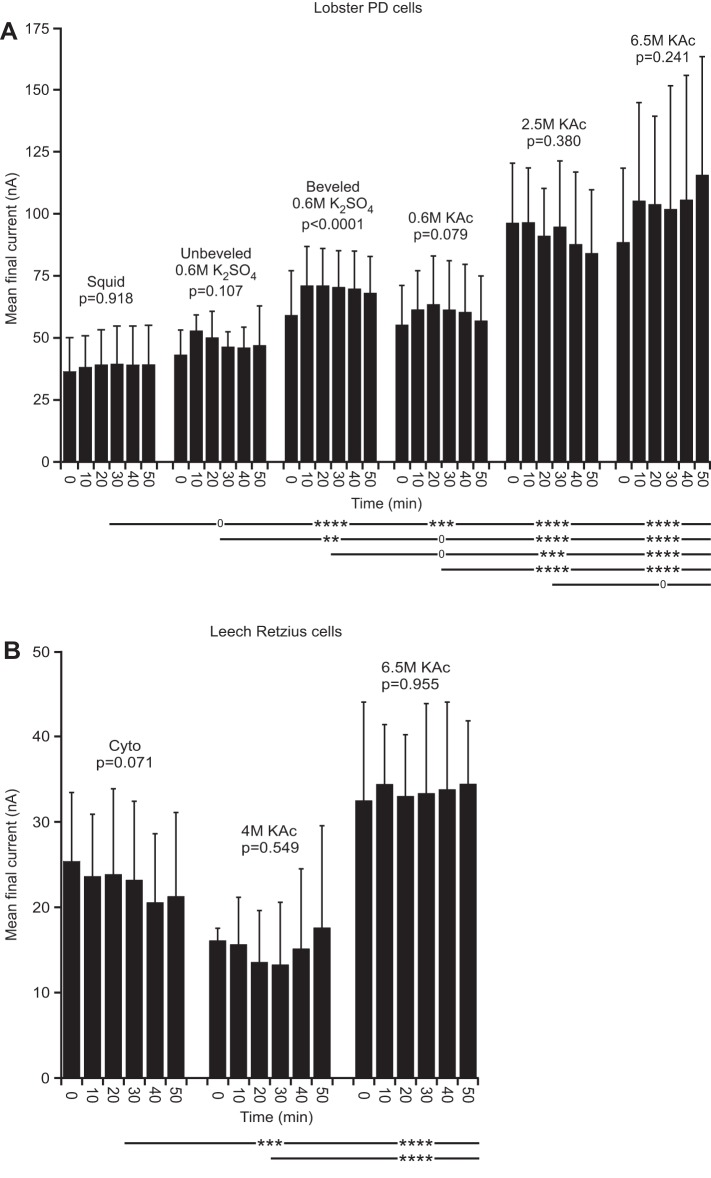
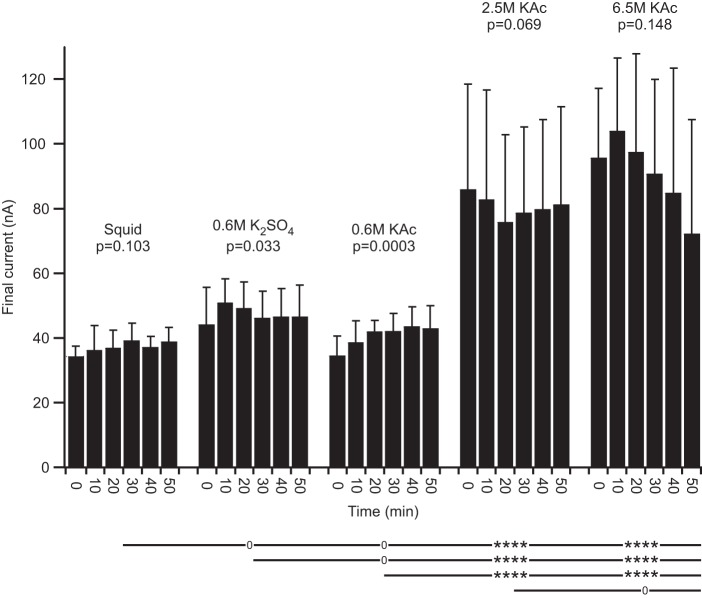
Lobster (in PTX-TTX saline) and leech final current. A: except for beveled 0.6 M K2SO4, no electrode fill changed with time. However, the amplitude of the high molarity fills was much larger than the low molarity fills and differed significantly from all low molarity fills. The mean squid fill final current differed from those of all other fills except unbeveled 0.6 M K2SO4. B: no leech electrode fill changed with time. Leech high molarity fills differed from cyto fills.
Fig. 3.
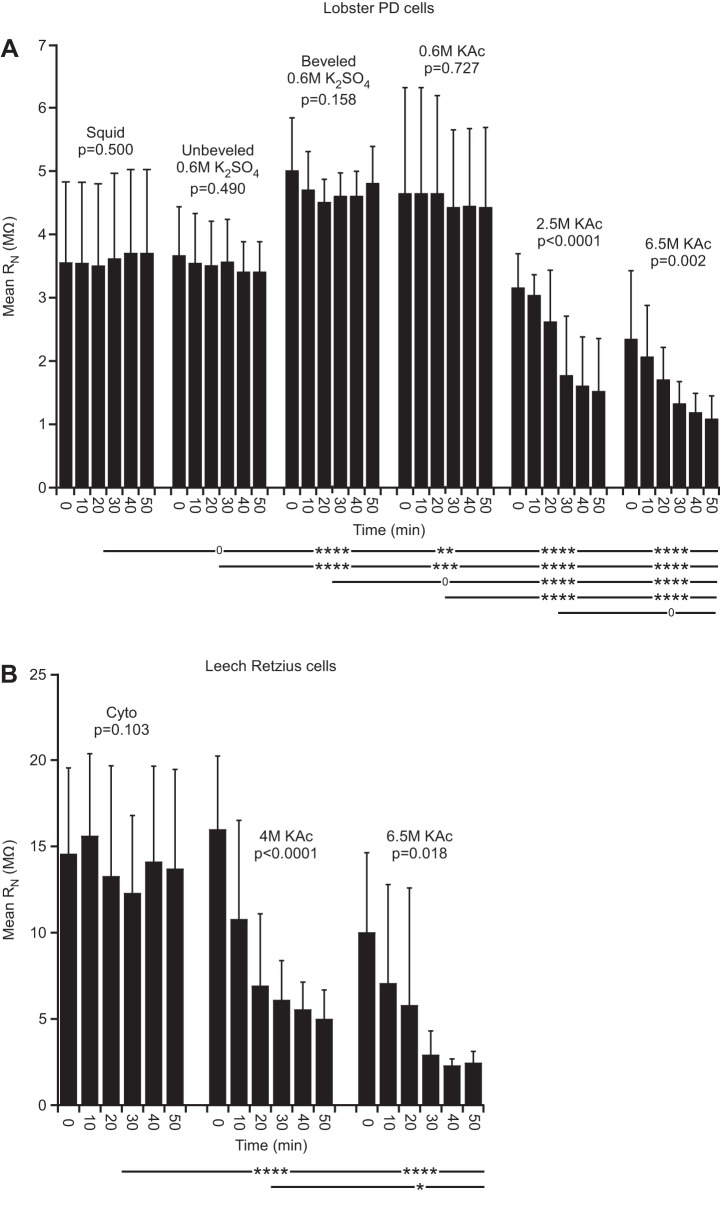
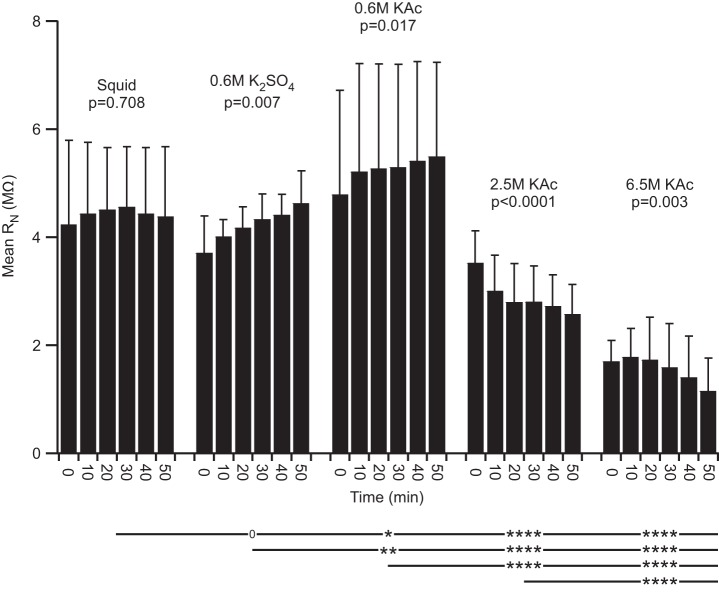
Lobster (in PTX-TTX saline) and leech RN. A: lobster PD neurons changed over time when using 2.5 or 6.5 M KAc fill. All low molarity fills showed no change over time. The mean RN of the 2 high molarity fills differed from those of all low molarity fills at P < 0.0001, and the mean squid fill RN differed from those of all other fills except unbeveled 0.6 M K2SO4 (compare columns 1, 3, and 4, and see also Figs. 4 and 5). B: leech high molarity fills changed over time and differed from the cyto fill at P < 0.0001.
Fig. 5.
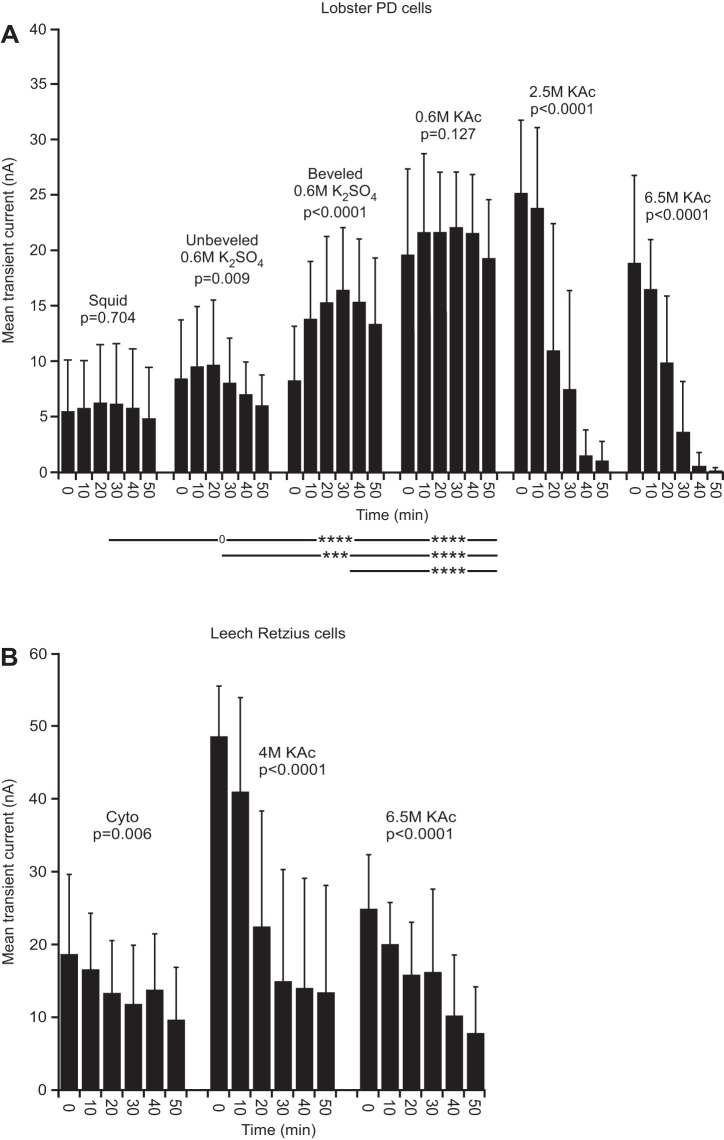
Lobster (in PTX-TTX saline) and leech transient current. A: squid and 0.6 M KAc electrode fills showed no change over time. Transient current amplitude decreased dramatically with time with high molarity fills. B: all leech fills changed with time. Across-fill ANOVAs were not performed because high molarity fill data spanned means of squid and cyto data (see materials and methods).
Perhaps more advanced statistical treatments could have overcome this difficulty. However, the effects of differing fill type are so pronounced that we did not attempt to do so. We instead performed only two statistical tests. First, for each fill type, we tested whether the cell property being measured changed with time into the experiment using a repeated-measures, one-way ANOVA on that fill type's data. This separated the fill types into two qualitative classes: those in which the cell property was stable across time and those in which the cell property changed with time into the experiment. For the fill types and properties, in which the time-dependent variation resulted in a range of values greater and less than the values across time of the other fill types (2.5 M KAc and 6.5 M KAc for transient current in PTX-TTX saline and in normal saline for lobster neurons; see Figs. 5 and 13), we did not include these data in further statistical tests. The means of the rest of the data, regardless of time (that is, all of the squid data vs. all of the unbeveled, 0.6 M K2SO4 data vs. all of the beveled, 0.6 M K2SO4 data, etc.) were then compared using a one-way ANOVA with a Tukey's all-pair comparison post hoc test. This allowed us to assess whether different electrode fills resulted in differences in the across-time mean value of the property being examined. Examination of the figures will show that these two tests were adequate to assess whether electrode fill type resulted in changes in cell properties.
Fig. 13.
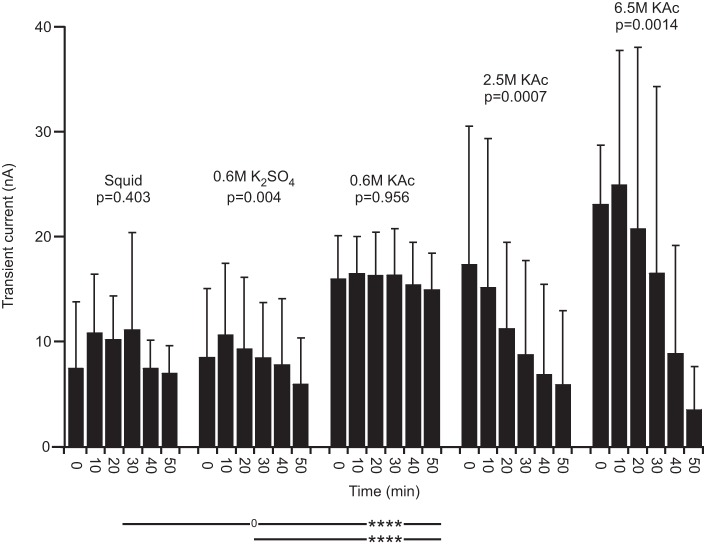
Lobster transient current in normal saline. High molarity fills again very strongly depended on time into the experiment. 0.6 M K2SO4 did not differ from squid fill.
RESULTS
Lobster and leech neuron properties were measured approximately every 10 min. In lobster, in which both the slowly activating hyperpolarization-activated current (Ih) and more rapidly activating and inactivating currents were measured, a two-part voltage-clamp protocol was performed (Fig. 1A). For each set of measurements, the electrometer was first switched to two-electrode voltage clamp (time 0; Fig. 1A). Vm was then stepped to a variety of voltages, each step lasting 30 s. In lobster neurons, the current evoked by these steps slowly changed with time, and at the Vm used here, these changes are primarily due to changes in Ih (Golowasch and Marder 1992). Therefore, we fitted these changes with a single exponential to measure Ih time constant as a function of Vm. Consistent with prior work (Gerard et al. 2012), preliminary experiments showed that Retzius neurons possessed little Ih. The 30-s pulses were therefore not performed in leech experiments.
Each neuron was then held at −40 mV for 10 s, and five, 0.5-s hyperpolarizing steps to −80 mV, separated by 1 s returns to −40 mV, were made (Fig. 1C). Ih would change very little during such brief steps. The mean of the current responses to these steps was therefore used to calculate neuron RN. Ten, 0.5-s depolarizing steps to 0 mV, separated by 1 s returns to −40 mV, were then made. The electrometer was then returned to current clamp mode. Because this protocol involved repeated injection of current stimuli, we refer to the protocol as stimulation in the text below.
The current necessary to achieve the depolarized voltages showed a marked decrease during the first five repetitions (Fig. 1C), and therefore, the currents of only the last five steps were averaged (mean). The negative of the mean current evoked by the steps to −80 mV was subtracted from the mean of the steps to 0 mV (Bezanilla and Armstrong 1977) to obtain the net voltage-dependent (depolarization-activated) current evoked by depolarization to 0 mV. This current often has both a transient and sustained (final) component (Fig. 1D). Prior work indicates that the transient component is due to inactivation of the transient outward current IA and a decrease of the calcium-activated potassium current {IKCa; arising from inactivation of the depolarization-activated calcium current and the consequent reduction of intracellular calcium concentration ([Ca]i)}, and the sustained component is the sum of the delayed rectifier current and IKCa at steady state [Ca]i (Golowasch and Marder 1992). Because of these mixed natures, we refer to these two components as “transient” and “final” currents. In leech neurons, we measured, as a function of electrode-fill solution and time after penetration with both electrodes, Vm, RN, and final and transient current. In lobster neurons, in normal saline, we measured these cell properties and in PTX-TTX saline, these properties and Ih time constant.
Vm varies with time with high ionic strength fills.
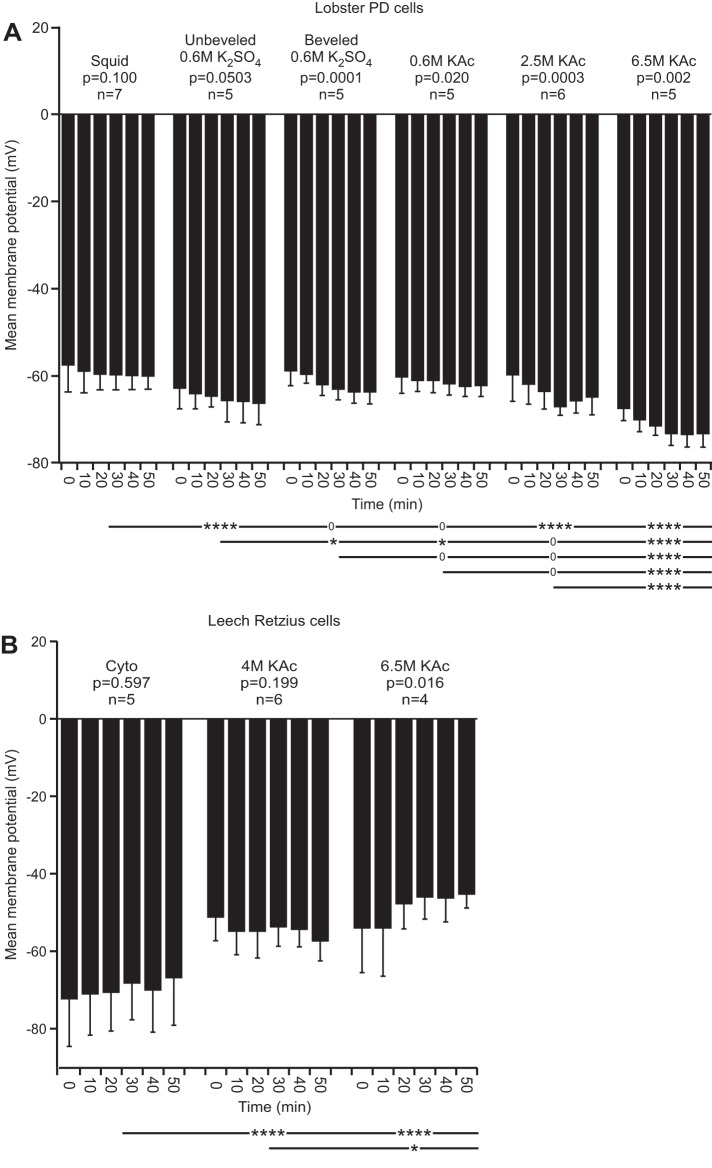
Whether Vm was constant across the experiment duration varied according to electrode fill (Fig. 2). In Fig. 2, A and B (and see Figs. 3–5 and 10–13), P values show whether there was a change over time within a fill type. Also shown is whether the means of each fill's data, grouped across time (see materials and methods) of the various fills, differed from one another (see Fig. 2 legend). In lobster (Fig. 2A), Vm changed with time in all fills except squid and unbeveled 0.6 M K2SO4. In all cases, the change in Vm was hyperpolarizing. The mean of the 6.5 M KAc fill data differed from all other fills at P < 0.0001. The squid fill differed from both high molarity fills at P < 0.0001. In leech (Fig. 2B), Vm did not change over time with cyto and 4 M KAc fills but did with 6.5 M KAc, in this case, with a depolarization. The cyto fill differed from the 4- and 6.5-M KAc fills at P < 0.0001.
Fig. 2.
Lobster [in picrotoxin (PTX)-TTX saline] and leech Vm. For this and all figures, all error bars are SD. The P values above the columns show whether change over time occurred within the fill type (repeated-measures, 1-way ANOVA; see Figs. 3–5 and 10–13 for the same convention used). The lines and asterisks below the columns denote whether the means of all of the data of each fill differed from the means of all of the data of the other fills (that is, each fill's data at all time points were grouped together and then compared with the similarly grouped data of the other fills; see materials and methods) using an ANOVA with a Tukey's all-pairs post hoc comparison (0, P > 0.05; *P = 0.05 to >0.01; **P = 0.01 to >0.001; ***P = 0.001 to >0.0001; ****P ≤ 0.0001). Each horizontal line compares the data at the line's left end with the other data sets. For example, the uppermost line shows that the squid data differ from the unbeveled 0.6 M K2SO4 data at P < 0.0001, do not differ from the beveled 0.6 M K2SO4 or 0.6 M KAc data, and differ from the 2.5 and 6.5 M KAc at P < 0.0001. The next line similarly compares the unbeveled 0.6 M K2SO4 data with the beveled 0.6 M K2SO4, 0.6 M KAc, 2.5 M KAc, and 6.5 M KAc data (see Figs. 3–5 and 10–13 for the same convention used, and see Figs. 3–5, as the same n for each column is used). A: lobster pyloric dilator (PD) neuron Vm was constant over time with squid and unbeveled 0.6 M K2SO4 fills but changed with time with all other fills. The squid fill data differed from the unbeveled 0.6 M K2SO4, 2.5 M KAc, and 6.5 M KAc data at P < 0.0001. The 6.5-M KAc fill differed at P < 0.0001 from all other fills. B: leech Vm was constant over time with cyto and 4 M KAc fills but changed significantly with 6.5 M KAc. The cyto fill differed from the 2 high molarity fills.
Fig. 10.
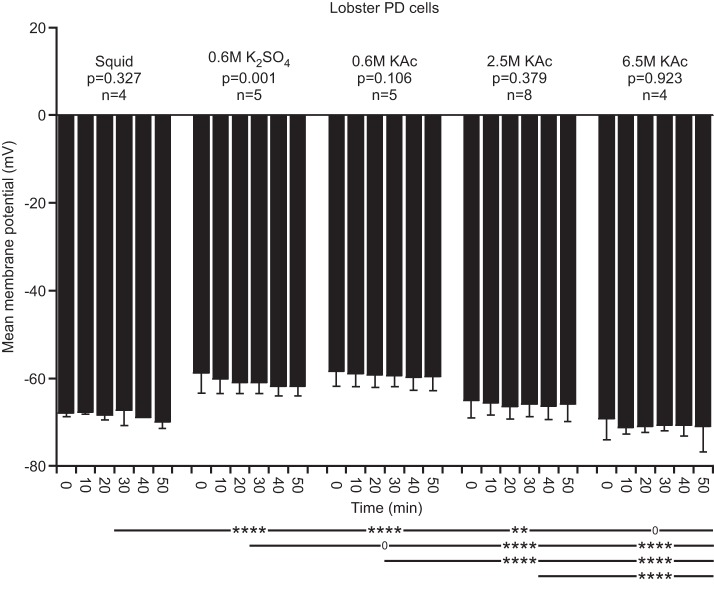
Lobster Vm in normal saline. Unlike in PTX-TTX, Vm is stable with all electrode fills except with 0.6 M K2SO4 fill. Squid fill differs from all fills except 6.5 M KAc.
RN varies with fill type and decreases with time with high ionic-strength fills.
Both lobster (Fig. 3A) and leech (Fig. 3B) neuron RN declined with time in all experiments using electrodes filled with high molarity solutions. These drops could be substantial, declining some three- to fourfold in 60 min. No change with time was seen in either lobster or leech with low molarity electrode fills. High molarity fills in lobster and leech differed from all low molarity fills at P < 0.0001. The 2.5 and 6.5 M KAc fills in lobster did not differ (P = 0.067); 4 and 6.5 M KAc in leech differed at P = 0.038. These RN differences could be substantial, with RN values with squid fill in lobster at ∼3.5 MΩ and varying between 3.5 and 1 MΩ in high molarity fills and RN values with cyto fill in leech at ∼13 MΩ and varying between 16 and 2.5 MΩ in high molarity fills.
Final current varied with fill type but varied with time only in lobster neurons with beveled 0.6 M K2SO4 fill.
In both lobster and leech neurons, final current was constant with time in all cases, except beveled 0.6 M K2SO4 fill in lobster neurons (Fig. 4). Tukey's comparison across fill type again showed strong differences in both lobster and leech between high and low molarity fills (at most, P < 0.001). Squid fill in lobster differed from all other fills at P < 0.001 or less, but 2.5 and 6.5 M did not differ (P = 0.254). Again, these differences were substantial, with lobster final current at ∼35 nA in squid fill and 100 nA in high molarity fills and leech final current at ∼23 nA in cyto, 15 nA in 4 M, and 35 nA in 6.5 M.
Transient current varied with fill type and decreased with time with high ionic strength fills.
With high molarity fills, transient current decreased with time in both lobster and leech (Fig. 5). These changes were large, with declines by 50 min of 26 (2.5 M lobster)-, 158 (6.5 M lobster)-, 3.6 (4 M leech)-, and 3.2 (6.5 M leech)-fold. With squid fill, alternatively, transient current was constant over time (P = 0.704). In leech, transient current declined with all three fill types, but with 4 and 6.5 M KAc electrode fill solutions, the initial current levels were larger than with cyto fill, and the declines were more substantial. In both lobster and leech, the high molarity fill data began at values larger than the squid or cyto fill data and ended at values equal to or lower than the data. These large data variations and their spanning the mean of the squid or cyto data, in most cases, prevent using an ANOVA by fill type to compare the data (see materials and methods). Visual comparison of the data nonetheless shows that the high molarity data are clearly very different from the squid and cyto data.
Ih time constant varied by fill type.
Due to the slowness of Ih dynamics and the need to measure Ih time constant at six Vm, at each measurement time (0, 10, 20 min, etc.), the characterization of Ih time constant required 5 min (Fig. 1A). It was therefore impossible to make multiple measurements of Ih time constant at, for example, 0 min, because by the time the first set of measurements was made, 5 min had elapsed. The five points (one for each test Vm) obtained at each measurement time are also insufficient to well fit the equation (Prinz et al. 2003) used to characterize the Ih time constant. Therefore, we did not analyze these data by time, as in Figs. 2–5. Instead, we grouped all data from each fill type, plotted them vs. Vm, and fit the data using the equation for Ih time constant (Fig. 6) to obtain the Vm dependence of the Ih time constant in each fill type. At all Vm, the Ih time constant was ∼5 s longer with squid than with 2.5 or 6.5 M fills, an increase, depending on Vm, of 40–50%. The nonmonotonic variation of the Ih time constant with Vm prevented performing an across-all-Vm ANOVA. Therefore, we performed one-way ANOVAs vs. fill type individually at each Vm. All of these ANOVAs showed a dependence on fill type (all P ≤ 0.0009). The Tukey's comparisons showed that in all cases except −50 mV, the squid data differed from the 2.5 and 6.5 M data (all P ≤ 0.0095), and the 2.5 and 6.5 M data did not differ. At −50 mV, squid and 2.5 M differed (P < 0.0001), 2.5 M and 6.5 M differed (P = 0.0351), and squid and 6.5 M did not.
Fig. 6.
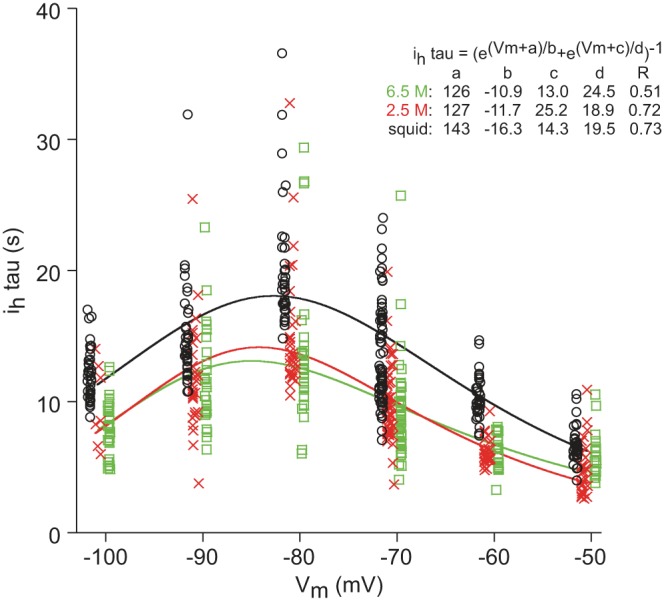
At all Vm, lobster Ih time constant (tau; curved lines) is ∼5 s longer when measured with squid-filled electrodes. Inset: equation and fit values.
Leech neurons swelled when recorded with high ionic strength electrodes.
The osmolarity of lobster neuron cytoplasm is ∼1 M (Junge 1981) [modified from Hodgkin (1951)] and that of leech neuron cytoplasm, ∼250 mM (Deitmer and Schlue 1981, 1983; Hintz et al. 1999; Schlue 1991; Walker and Smith 1973; Walz and Schlue 1982). These values are ∼2.5 (lobster)- and 16 (leech)-fold lower than the 2.5 (lobster) and 4 (leech) M electrode fills and 6.5 (lobster)- and 26 (leech)-fold lower than the strength of the 6.5 M electrode fill. Given earlier data showing substantial leak across sharp electrode tips, it followed that the fill-dependent effects that we observed might result from injury responses due to cell dialysis and changes in cytoplasm ionic concentrations when recording with the high ionic strength electrodes. If this were occurring, one would expect that the cells would swell, due to water inflow, as cytoplasm osmolarity increased.
Observation of lobster neurons during the experiments never showed any visibly evident swelling, but such observations did show visually evident swelling of the Retzius neuron being recorded. Indeed, the collection of data from Retzius neurons with electrodes filled with 6.5 M solution was difficult, because the swelling would often dislodge the electrode from the neuron, a difficulty that never occurred with lobster neurons or with Retzius neurons using lower molarity fill solutions. We quantified this swelling by taking photomicrographs of Retzius neurons before and after recording from the neurons with electrodes filled with 4 and 6.5 M solutions (Fig. 7A; data from one experiment after recording from the neuron for 160 s with a 6.5 M electrode). Examination of the photomicrographs showed that only the neuron being recorded swelled.
Fig. 7.
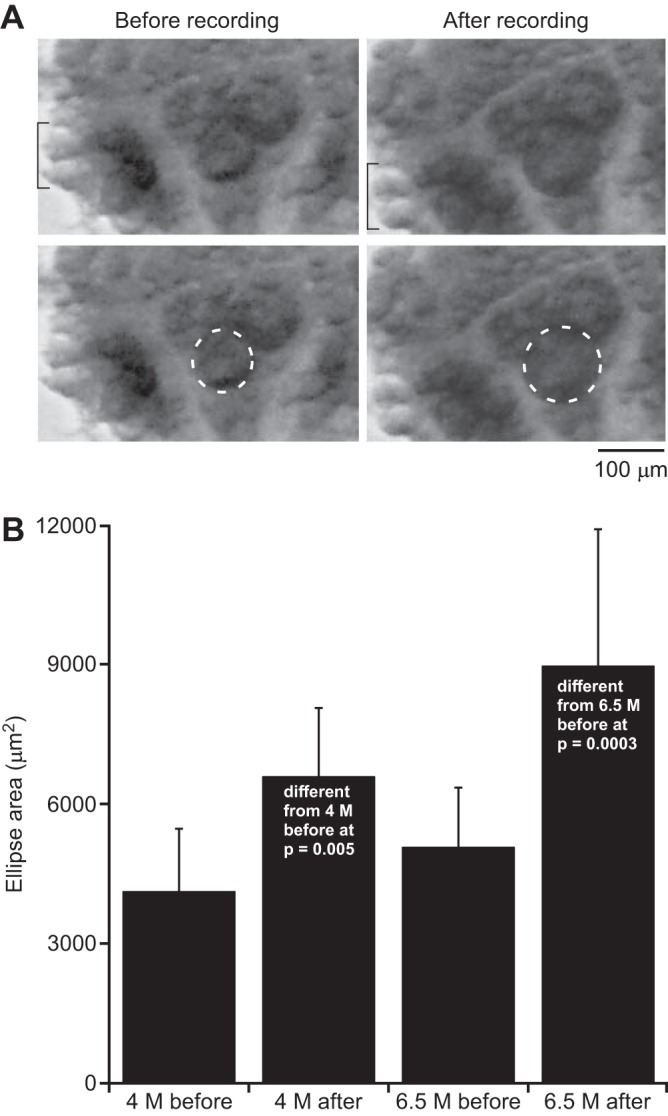
Retzius neurons swell when recorded with 4 or 6.5 M fill electrodes. A: photographs from 1 preparation. The top and bottom pictures are identical and are repeated so that the neuron around which the ellipses are drawn in the bottom row can be seen clearly. Only the neuron being recorded swelled [compare, for instance, the 2 light-colored neurons marked with a bracket or the neighboring Retzius cell (left and right)]. B: grouped data. Data from 4 experiments with 4 M electrode-fill solution and 11 experiments with 6.5 M.
These pictures allowed us to measure only neuron area, not volume, because we had no information about neuron size in the z direction. Therefore, we quantified these data by drawing an ellipse around the neurons before and after recording and calculating ellipse area (Fig. 7B). The mean ellipse areas of neurons recorded with 4 M electrodes increased from 4,121 ± 1,344 μm2 to 6,586 ± 1,473 μm2; the areas of neurons recorded with 6.5 M electrodes increased from 5,065 ± 1,286 μm2 to 8,957 ± 2,941 μm2 (±SD in all cases; Fig. 7B). We performed four Student's t-tests on these data for a Dunn-Šidák-compensated significance value of 0.0127 for a nominal α of 0.05. The 4 M and 6.5 M before data and the 4 M and 6.5 M after data did not differ (P = 0.276 and 0.064, respectively), but the 4 M before and after data (P = 0.005) and the 6.5 M before and after data (P = 0.0003) did.
With 2.5 M KAc electrodes, the decrease of time between stimulations caused synchronous changes in Vm, RN, and final and transient currents.
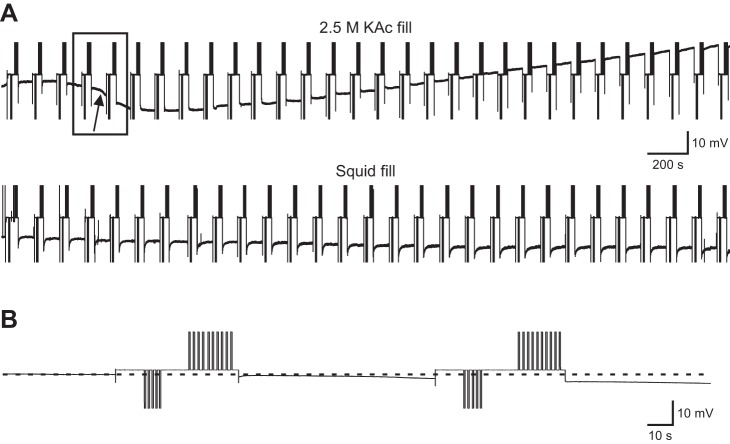
In the data presented thus far, the current injections shown in Fig. 1 were applied every 10 min. The application of these stimulations every 10 min did not provide fine time resolution of when the changes in neuron properties occurred with the high molarity fill electrodes nor did it address the question of whether similar changes would occur with cytoplasmic fill electrodes if the stimulations were applied more often. Therefore, we performed a series of experiments using 2.5 M KAc and squid-filled electrodes, in which the stimulation protocol shown in Fig. 1C (without the Ih measurement component) was applied every 2 min (Figs. 8 and 9). Figure 8A shows the entirety of the voltage trace (that is, the entire 60 min) from two complete experiments with each fill type; the downward deflections are the resistance-measuring hyperpolarizations of Fig. 1C, and the upward deflections are the outward current measuring depolarizations of Fig. 1C. Figure 8B shows a time-expanded version of the data—two stimulation protocols. When using the 2.5 M KAc fill, the neuron began to hyperpolarize after four stimulations, and Vm reached a nadir after six stimulations, ∼12 min into the experiment. After that, the neuron began to depolarize and continued to do so for the remainder of the experiment. Squid fill Vm showed a small, continuous hyperpolarization throughout the experiment.
Fig. 8.
Experiments showing voltage change that occurred in PD neurons with 2.5 M KAc and squid fill and stimulation every 2 min for 1 h. Initial voltage for the 2.5 M KAc cell is −46 mV and for the squid cell is −50 mV. A: raw data. Squid Vm shows only a slow, small hyperpolarization throughout the experiment. The 2.5 M fill neuron began to hyperpolarize sharply after ∼8 min (arrow). At ∼12 min, the cell “bottomed out” and began to depolarize, which continued for the remainder of the experiment. B: time expansion of data in rectangle in A showing stimulation protocol.
Fig. 9.
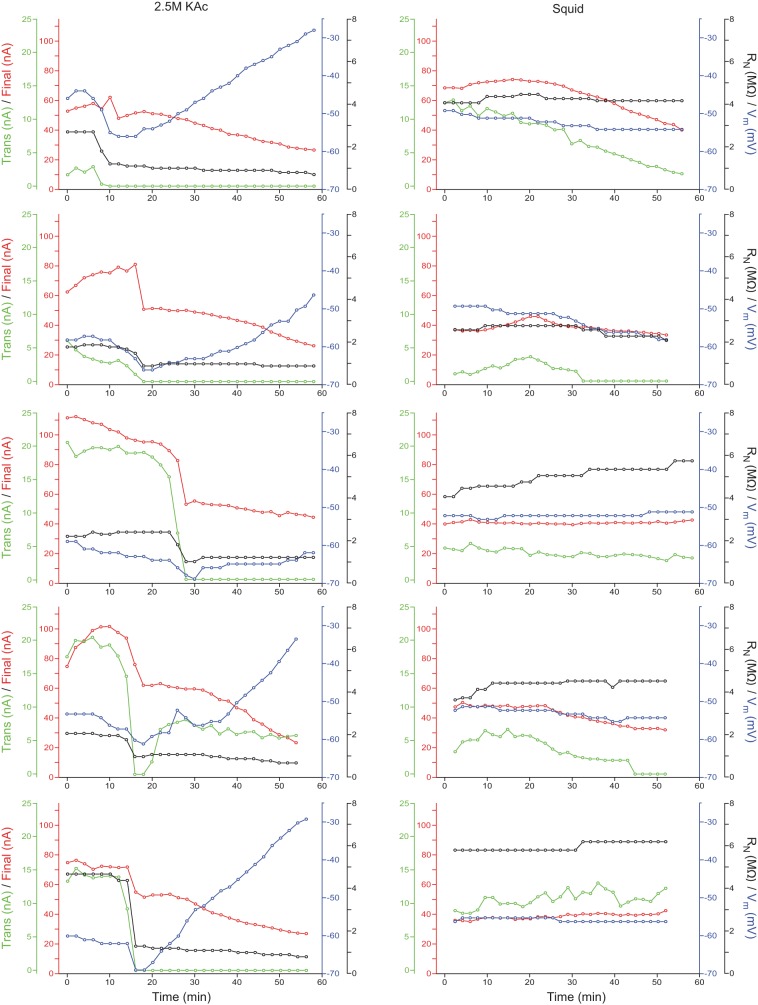
All 2.5 M KAc and squid fill experiments with 2-min stimulation intervals. Top row is from the experiments shown in Fig. 8. All graphs: final current, red lines; transient (Trans) current, green lines; Vm, blue lines; RN, black lines. The graphs in the left column show individual experiments using 2.5 M KAc electrode fill. Notice the simultaneous steep declines in all 4 parameters and subsequent slow decline in final current and slow increase in Vm. The right column shows experiments using squid fill. No simultaneous changes occurred, and Vm and RN remained stable. Final and transient currents were more stable than with 2.5 M KAc electrodes but showed some decline in 2 (final) or 3 (transient) experiments.
When the other parameters were examined (Fig. 9), it is clear that something global occurred to the 2.5-M neuron when it began to depolarize. Not only did Vm begin to hyperpolarize, but also, RN began to decrease rapidly, transient current fell to zero, and final current began a slow decline that lasted the remainder of the experiment. These four parameters changed in synchrony in four other experiments as well. When Vm began to hyperpolarize, RN decreased (sometimes very sharply), and transient current disappeared (in all but one experiment, permanently). At the same time, final current showed a large decrease in four of the five experiments, and in all five experiments, this time marked the beginning of its continuous, slow decline for the rest of the experiment. This would seem to indicate that in each experiment, some catastrophic event affecting all of these parameters at about the same time and from which the neuron was unable to recover occurred.
The squid fill was much more stable, even though the stimulation interval was the same. In all five experiments, Vm and RN remained constant or improved. In three of five experiments, final current remained constant. The transient current was more fragile and was relatively stable in only two experiments. However, at no point in any of the five squid fill experiments did simultaneous changes in all four parameters occur, suggesting that with squid fill, cell properties were much less affected by short-interval stimulations.
Passive recording with 2.5 M KAc fill also induced changes in neuron properties.
Current injection moves ions between the electrode and cytoplasm. It was thus possible that a simple passive recording would not alter neuron membrane properties. We tested this by impaling five neurons with two electrodes filled with 2.5 M KAc; waiting 10 min; measuring Vm, RN, and final and transient current; waiting 50 min; and remeasuring these parameters. Vm did not change (−60.8 ± 4 vs. −60.2 ± 3.3, P = 0.208, paired Student's t-test here and all other comparisons in this paragraph) and was approximately the same as the values observed with squid fill (Fig. 2A). RN fell ∼7.5% (4.1 ± 1 vs. 3.8 ± 0.8, P = 0.039), much less than the 50% drop (3.2 ± 0.6 vs. 1.5 ± 0.8) that occurred with 2.5 M electrodes stimulated every 10 min and having values approximately the same as those observed with squid fill (Fig. 3A). Final current increased ∼42% (50.5 ± 12.3 vs. 71.1 ± 5.9,P = 0.009), beginning in this set of experiments, at a lower value than those observed in Fig. 4A but ending at the same approximate level and always being larger than squid fill values (Fig. 4A). Transient current did not change significantly (21.6 ± 6.6 vs. 18.4 ± 1.1, P = 0.34), as opposed to the 25-fold decrease (25.1 ± 6.6 vs. 0.95 ± 1.8) observed with 10-min stimulations but was always much higher than squid fill values and had values close to the values observed early in the 10-min stimulation protocol (Fig. 5A). These data suggest that a passive recording induces changes in cell properties in the same direction as those induced by more frequent stimulation but more slowly and incompletely. (RN fell but not to as low of a final level; final current did not get larger than squid values until 50 min of passive recording; transient current remained at the high levels seen early in the every 10-min stimulation protocol.)
Changes in PD neuron properties were also observed in saline lacking PTX and TTX.
All lobster experiments presented thus far were performed in saline containing PTX and TTX. This raised the possibility that the changes in cell properties that we observed would not occur in normal saline. Therefore, we performed experiments in lobster, all with beveled electrodes and without the Ih component of the measurement-stimulation protocol for all electrode fills in normal saline. In normal saline, except for 0.6 M K2SO4, Vm was now stable with time (Fig. 10). The between-fill comparisons continued to show fill-dependent effects, but these were somewhat different from those in PTX-TTX saline, with squid fill in normal saline differing from 0.6 M K2SO4 and 0.6 M K2Ac but not 6.5 M KAc. RN effects were similar to PTX-TTX saline, with 2.5 and 6.5 M KAc fills having much smaller RN than the other fills and showing strong time dependence; in normal saline, only squid was stable with time (Fig. 11). Final current data were also similar to the PTX-TTX saline data, with 2.5 and 6.5 KAc having much higher final current than the other fills and squid again being stable with time (Fig. 12). Transient current data were also very similar in normal saline, with squid being stable, 0.6 M KAc being always greater than squid, and 2.5 and 6.5 M KAc fills being initially much greater than squid and then strongly declining to levels less than squid (Fig. 13). These data thus show that electrode fill affecting lobster cell properties and squid fill giving the most stable recordings are also true in normal saline.
Fig. 11.
Lobster RN in normal saline. All fills except squid varied with time into the experiment. High molarity fill values were again much less than those with squid fill, which differed from all other fills except 0.6 M K2SO4.
Fig. 12.
Lobster final current in normal saline. All low molarity fills were similar; 0.6 M K2SO4 and 0.6 M KAc varied with time into the experiment, but effect was small in magnitude. High molarity fills again had a much larger value than the other electrode solution fills.
Electrode fill-dependent changes in neuron activity.
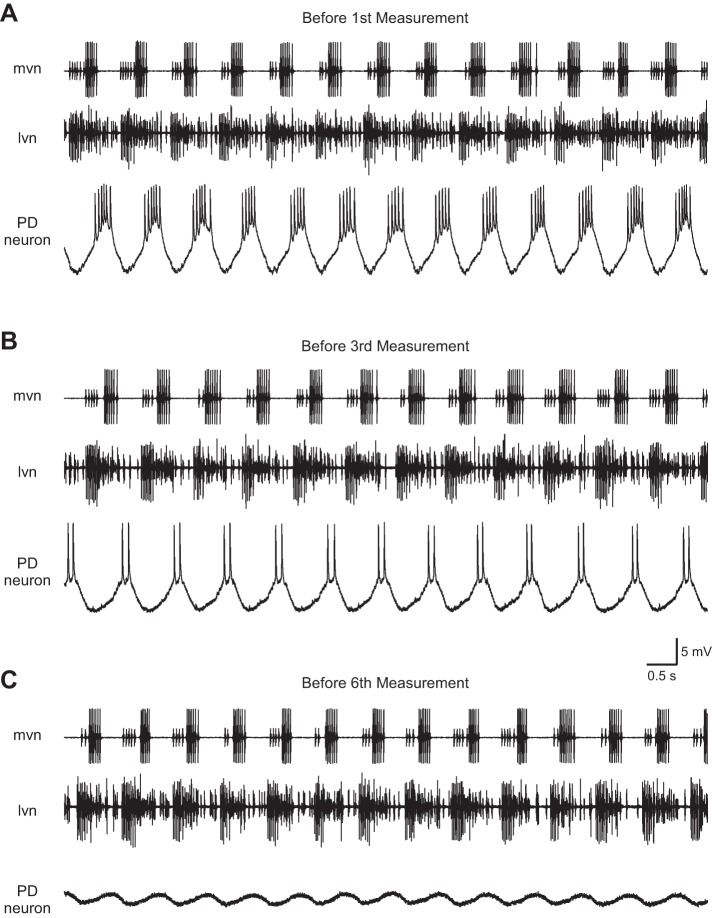
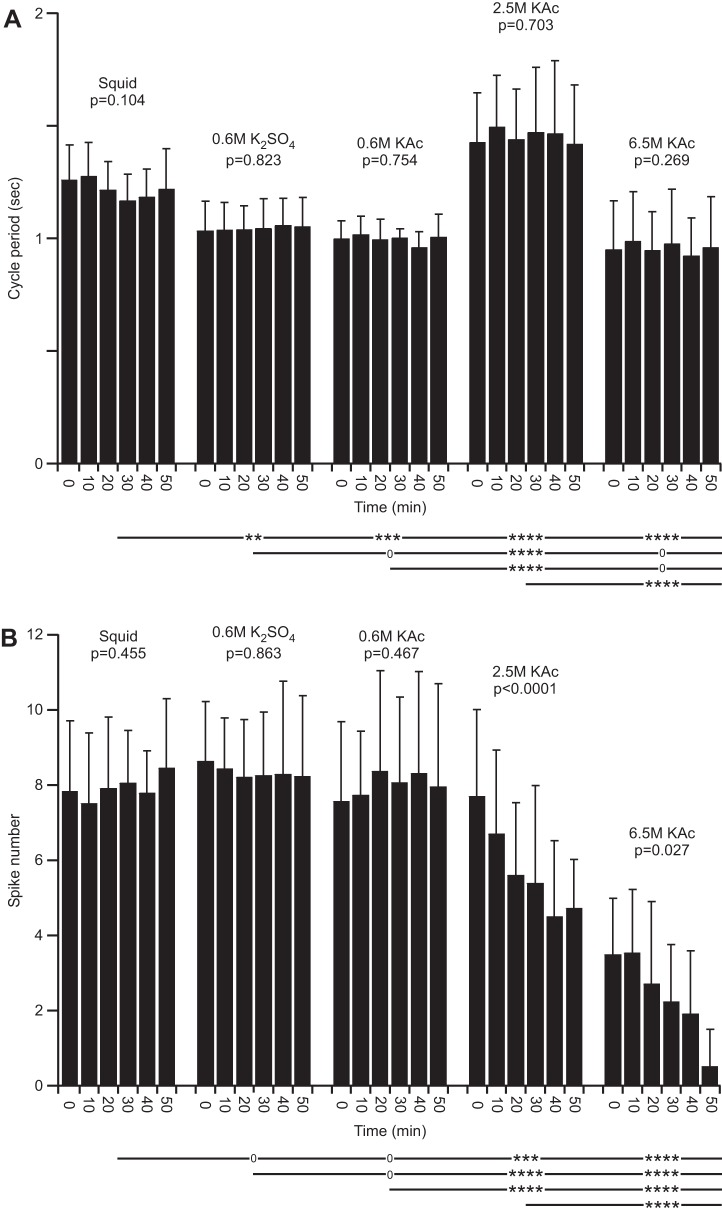
The normal saline experiments allowed us to examine the effects of the different electrode fills on neuron activity. Figure 14 shows neuron activity over time in an experiment with a 6.5 M KAc electrode. Before the first cell property measurement (Fig. 14A), the PD neuron fired five to six spikes/burst; after two measurements, the neuron fired only two spikes/burst (Fig. 14B), and after the fifth measurement, the cell had ceased to fire (Fig. 14C). Combined data showed that electrode fill affected both pyloric cycle period [the PD neurons are electrically coupled to the pyloric network's endogenously oscillating Anterior Burster neuron (Selverston et al. 1976)] and spiking activity. With all electrode fills, the cycle period was stable over time, but 0.6 M K2SO4, 0.6 M KAc, and 6.5 M KAc filled electrodes were associated with a faster cycle period and 2.5 M KAc with a slower cycle period than squid filled electrodes (Fig. 15A). With respect to spike number/burst, 0.6 M K2SO4 and 0.6 M KAc electrodes did not differ from squid-filled electrodes, and in all three cases, spikes fired per burst were stable over time. Electrodes (2.5 and 6.5 M KAc filled), alternatively, showed a marked decrease in spike number with time into the experiment (Fig. 15B).
Fig. 14.
Raw data showing effect on PD neuron activity of recording with an unbeveled 6.5 M KAc electrode. Before the 1st measurement stimulation, the neuron fired 5–6 spikes/cycle (A); before the 3rd, only 2 spikes/cycle (B); and before the 6th, 0 spikes/cycle (C). Effect was not due to generalized cessation of pyloric network activity (note continued spiking activity on the extracellular traces). mvn, median ventricular nerve: large amplitude spikes are due to ventricular dilator neuron and small spikes, inferior cardiac neuron. lvn, lateral ventricular nerve: large spikes are due to lateral pyloric neurons and small spikes, pyloric and PD neuron activity (which cannot be well distinguished in this recording).
Fig. 15.
Effects of electrode fill solution on pyloric network cycle period (A) and impaled PD neuron spike activity (B). A: cycle period was stable with all electrode fill solutions. Cycle period in squid differed from all other fill solutions. B: PD neuron spiking activity was stable and similar with all 3 low molarity electrode fills. Spiking activity progressively decreased with time with both high molarity fills.
Squid-filled electrodes give high-quality intracellular recordings.
A concern with cytoplasmic-matched electrodes is that because of their low molarity, intracellular recordings with them will be of markedly lower quality than with higher molarity electrode fills. However, unbeveled squid recording electrodes give, in our hands, intracellular recordings of at least equal quality as higher molarity electrodes, with very little noise and clean action and postsynaptic potentials (Fig. 16).
Fig. 16.
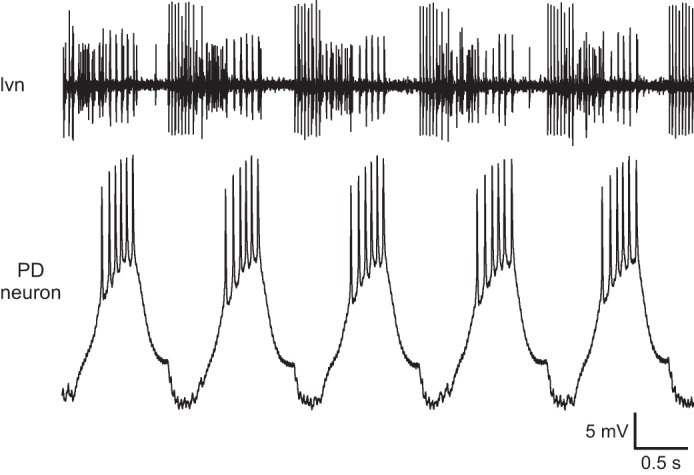
Squid-filled, unbeveled recording electrodes give high-quality recordings. Spikes are clean, and lateral pyloric neuron inhibitory postsynaptic potentials are clear in intracellular recording. Comparison with high ionic strength recordings (see Fig. 15, in which the intracellular recording was made with an unbeveled electrode filled with 6.5 M KAc) shows no noticeable differences. See Fig. 14 legend for identification of lvn and its activity.
An experiment with radioactive glucose fill confirmed sharp electrode fill leak.
We also confirmed earlier work (Eisen and Marder 1982; Fromm and Schultz 1981; Stoner et al. 1984), demonstrating that substantial fill leak occurs with sharp electrodes by filling an electrode with 14C-labeled glucose, placing the tip of the electrode in a drop of water, and periodically replacing the drop and measuring the radioactivity in it. This experiment (performed only once because of its expense and because it was only to confirm earlier results) gave a leak rate of ∼3 fmol/s. This value is somewhat less than the 3 to 10 fmol/s leak rates reported before (Fromm and Schultz 1981; Stoner et al. 1984), but this discrepancy is understandable, given the lower solute concentration used (0.26 M glucose vs. 3 M KCl) and the higher molecular weight of glucose.
DISCUSSION
We have shown that when current is injected into the neurons, lobster PD neuron Vm, RN, the amplitudes of the depolarization-activated transient and final currents, and the time constant of Ih vary as a function of electrode fill solution. Under these experimental conditions, leech Retzius cell Vm, RN, and transient and final current also vary with high molarity fills. High molarity fills induce leech neuron swelling, and we confirmed earlier work that substantial leak occurs from sharp electrodes. These data show that fill solution alters neuron properties even with sharp electrodes. Depending on the fill and when in the experiment the measurements are taken, these changes can be large, in some cases, resulting in many-fold changes in property value and altering neuron firing activity. Although less, a simple passive recording also induced changes in cell properties. The determination of which electrode fill best maintains neuron physiology is thus important even when using sharp electrodes. The neurons used here are much larger (70–100 μm cell diameter) than typical vertebrate neurons, and these effects would therefore likely be more pronounced in vertebrate neurophysiology.
Artifactual explanations.
Given the wide-ranging relevance of these data, it is especially important to examine alternative explanations for them. All electrodes were made identically, and often electrodes filled with different solutions were made in the same pull session. Experiments were performed independently in both species by three workers (S. L. Hooper, J. B. Thuma, and C. Guschlbauer). The lobster experiments were performed on more than one experimental setup, and the leech experiments were performed in two labs using electrometers from different manufacturers.
Another possible source of error is that the liquid junction potential offset used for the cyto fills was incorrect, and thus different Vm were being achieved in two-electrode voltage clamp with the squid and cyto and other ionic strength electrodes. For example, it could be that the decline in transient current that occurred with time with high ionic strength electrodes (Fig. 5) occurred because the achieved Vm with squid and cyto vs. high ionic strength fills differed, and the decline occurred only at certain Vm. This explanation is unlikely for multiple reasons. First, the difference in liquid junction potential between the salines bathing the preparations and neuron cytoplasm was measured directly multiple times (see materials and methods), and these measurements were similar across neurons. It is thus unlikely that they differed in the neurons on which the experiments were performed. Second, spike threshold in leech neurons was very similar with both cyto and high ionic strength electrodes (data not shown), which would not be expected if liquid junction compensation were incorrect. Third, this explanation cannot explain why final current differs for 4 and 6.5 M fills in leech neurons (Fig. 4), since liquid junction potentials will not differ between bathing saline and neuron cytoplasm for these high ionic strength electrodes. Fourth, this explanation would cause the squid Ih time constant curve to shift horizontally, not vertically, relative to the 2.5 and 6.5 M curves (Fig. 6). Fifth, an incorrect liquid junction potential cannot explain the cell swelling (Fig. 7) seen with high ionic strength fills.
Comparison with prior work.
A large amount of work has examined stomatogastric neuron conductances and their effects on neuron activity, both experimentally (Golowasch et al. 1999a, b; Schulz et al. 2006; Turrigiano et al. 1994, 1995) and with models (Golowasch et al. 1999b, 2002; LeMasson et al. 1993; Prinz et al. 2003). This work has shown that conductance expression is activity dependent (Golowasch et al. 1999a, b; Turrigiano et al. 1994, 1995), neurons or models with different conductance makeups can produce very similar outputs (Golowasch et al. 1999b, 2002; LeMasson et al. 1993; Prinz et al. 2003; Schulz et al. 2006), and stomatogastric neurons (of the same cell type) show wide animal-to-animal variation in conductance makeup (Golowasch et al. 1999a) and channel mRNA concentration (Schulz et al. 2006).
A first concern arising from this earlier work is that the changes we report here are due to the activity changes induced by our current injection protocol. However, all experiments were performed with identical stimulation protocols when comparing across electrode fills, and thus if any activity-dependent changes occurred, they would have presumably been the same in all cases. The activity dependence of stomatogastric neuron conductances is thus unlikely to play a role in explaining the data presented here. Much of this prior work involved relatively long-lasting electrode recordings and frequently considerable current injection. A second concern is therefore that the variability in conductance makeups observed in it is due, at least in part, to the electrode fill effects described here. All of this work was either performed in the (Eve) Marder lab or by researchers who had worked in this lab. The Marder lab shifted from using high molarity electrode fills to a 0.6 M K2SO4/20 mM KCl fill, ∼1992 [see, for instance, Golowasch and Marder (1992)], in all cases with unbeveled electrodes. This is the only noncytoplasmic electrode fill case in which almost all neuron properties (Vm being the only exception and the effect being modest) remain the same as with cytoplasmic fill in the work reported here. As such, it is very unlikely that this work is contaminated by the electrode fill-dependent changes in conductance makeup reported here.
An area where these data, alternatively, are likely very relevant is the issue that neuron models, even when physiologically based, almost always require hand tuning (changing model parameters from the values measured experimentally) to reproduce real neuron activity. Some of this requirement undoubtedly arises from the models not accurately representing neuron morphology and conductance placement on neuron processes. However, in many to most cases, these data were obtained with high ionic strength electrodes. Given that it is not only conductance amounts that high ionic strength fills can alter but also conductance time constant (Fig. 6), it is not surprising that models built with such data would not produce correct neuron activity.
Which electrode fill is best?
Strictly speaking, we have shown only that electrode fill affects neuron properties, not that the cytoplasmic-matched (squid, cyto) fills best maintain a neuron normal physiological state. This issue is made more difficult by the work of Marder and coworkers (Golowasch et al. 1999b, 2002; LeMasson et al. 1993; Prinz et al. 2003; Schulz et al. 2006) noted above, in that neuron activity can be maintained, despite large changes in neuron properties. Unchanging neuron activity is thus not an assurance of unchanging neuron physiology. Nonetheless, multiple arguments support the idea that low ionic strength electrodes better maintain neuron physiology and therefore, that measurements made with them most accurately measure a neuron natural state. First, many enzymes change their activity when the ion composition of their bathing medium changes (Berg et al. 2002) and thus will not function normally when a neuron is dialyzed with a high ionic strength solution. Second, the depolarization of Vm and decrease of RN are typical signs of cell damage. Third, cell swelling cannot represent the normal physiological state. Fourth, large time-dependent changes in neuron properties occurred most often with high ionic strength electrodes, suggesting that high ionic strength electrode fills are progressively altering neuron physiology.
With respect to the low ionic strength electrodes, in comparable electrode types (squid, beveled 0.6 M K2SO4, and 0.6 M KAc), RN and final and transient current showed differences between squid and the other fills (see Figs. 3–5). With the beveled 0.6 M K2SO4, electrode final and transient currents were not stable over time, and with the beveled 0.6 M K2SO4 and 0.6 M KAc, electrode Vm was not. Furthermore, the 0.6 M K2SO4/20 mM KCl and 0.6 M KAc/20 mM KCl fills have greater osmolarities (1,840 and 1,240 osM, respectively) than squid fill (925 osM) and very different actual ion concentrations than lobster neuron cytoplasm (Junge 1981) [modified from Hodgkin (1951)]. These data suggest that cytoplasm-matched electrode fills are likely best at maintaining neuron physiology.
Achievement of a steady state does not necessarily mean the state is a natural one.
It is frequent practice to wait for various periods after electrode penetration to allow the electrodes to “seal in” and the neuron to recover from presumed damage from electrode penetration. After the first ∼30-min postelectrode penetration, RN in lobster 2.5 and 6.5 M KAc and RN and transient current in leech 4 and 6.5 M KAc appear to be stabilizing. However, as explained above, it is unlikely that these states are the natural states of the neuron. It is instead more likely a steady state that the neuron achieves in response to an unnatural challenge, to wit, having its interior dialyzed with a high ionic-strength solution.
It is unclear that increasing electrode resistance avoids the problems described here.
A natural presumption is that with higher resistance electrodes, fill leak will be less, perhaps sufficiently so that the cell dialysis that likely underlies our results would no longer occur. For electrodes pulled with the type of electrode puller (Flaming/Brown) used in most labs, potassium (K) leak decreases exponentially with increases in electrode resistance (Stoner et al. 1984). The limited data on cell swelling also suggest that for Flaming/Brown electrodes, high resistance (>62 MΩ when filled with 3 M KCl) electrodes reduce cell swelling (Stoner et al. 1984). A comparison of our beveled and unbeveled electrode data supports these observations, as the unbeveled (higher resistance) electrode data, in most cases, most closely resemble that of the squid-filled electrodes.
Although these data are encouraging, a difficulty is that very high resistance electrodes are primarily used for recording from very small neurons or from neuron processes. Given that neuron volume decreases as the cube of size, it is unclear that the decrease in K+ leak with increasing electrode resistance would be sufficient to prevent cell dialysis of such small cytoplasm volumes. For example, if K+ leak with a 100-MΩ electrode were reduced 100-fold to only 0.1 fmol/s, then it would still only take 500 s for the intracellular potassium concentration ([K]i) of a cuboidal neuron with a side length of 10 μm (1 pl vol) with a normal [K]i of 0.1 M to increase 50%. The volume of a 100-μm length of nerve process with a 1-μm radius is only 0.3 pl, and thus the equivalent increase in [K]i in this local volume would take only 167 s. These calculations suggest that cell dialysis could also be a problem, even for very high resistance electrodes. Furthermore, with respect to transient current, even unbeveled electrodes caused time-dependent changes in lobster neurons (Fig. 5). As such, even for high resistance electrodes, it is still probably best practice to use cytoplasm-matched fills.
Lack of neuron swelling does not assure that neuron physiology is unchanging.
Lobster neurons did not appear to swell when recorded with high ionic strength electrodes. The most likely reason for this is that lobsters are marine, and leeches are fresh water. Lobster cytoplasm consequently has an osmolarity of ∼1 osmol/l and leech cytoplasm of ∼0.25 osmol/l. As a result, the transfer of equal moles of ions into equal volumes of the two cytoplasms would cause much smaller relative changes in lobster cytoplasm osmolarity. Cell swelling results from a difference in internal and external osmolarity (originally equal). The smaller relative osmolarity change in lobster neurons would therefore result in less neuron swelling. Regardless, the changes in lobster neuron properties with high ionic strength electrodes show that a lack of visible cell swelling is not evidence of unchanging neuron physiology.
General implications.
Our data show that neuron membrane properties changed even when current was not repeatedly injected. Thus they also call into question prior work in which neuron activity was only passively recorded. Our data thus indicate that electrode fill solution leak is a potential problem, not only for whole-cell patch work but also for sharp electrode recording. It is important to stress that unusually large currents were not injected in our experiments. Our protocols are typical or less than those required to characterize most conductance types, and we performed the tests only once every 10 min. Furthermore, in the leech experiments, the current protocol was much shorter, because Ih measurements were not made. Sharp electrode electrophysiology should thus be performed with cytoplasm-matched electrode fills.
An objection that can be raised is that since neuron cytoplasm has much lower ionic strength than typical electrode fill solutions, this will result in electrodes with unusably high resistances. However, resistance decreases with electrode fill ionic strength much less than linearly, with a 10-fold decrease in fill ionic strength increasing electrode resistance only 4.4-fold (Brown and Flaming 1986), and in our hands, cytoplasm-matched electrodes give high-quality recordings. Moreover, because matching fill and cytoplasm ionic strengths minimize the variation in net ion movement between electrode and cytoplasm, these higher resistance electrodes often have lower noise than high ionic strength electrodes (Brown and Flaming 1986). In most applications, cytoplasm-matched electrode fills are thus likely usable. If high ionic strength electrodes are used, then it is important to take measurements as soon as possible after electrode penetration. In such cases, it is also likely best to report only qualitative data (e.g., current X is present, conductance Y is depolarization activated), as the magnitude of the changes shown here indicates that quantitative measurements may have large error.
GRANTS
Support for this research was provided by the National Institute on Drug Abuse Grant RC1DA028494 (to S. L. Hooper) and Deutsche Forschungsgemeinschaft Grant Bu857/9 (to A. Büschges).
DISCLOSURES
No conflicts of interest, financial or otherwise, are declared by the authors.
AUTHOR CONTRIBUTIONS
Author contributions: S.L.H. and J.B.T. conception and design of research; S.L.H., J.B.T., C.G., and J.S. performed experiments; S.L.H. and J.B.T. analyzed data; S.L.H. and J.B.T. interpreted results of experiments; S.L.H. and J.B.T. prepared figures; S.L.H. and J.B.T. drafted manuscript; S.L.H. and J.B.T. edited and revised manuscript; S.L.H., J.B.T., C.G., J.S., and A.B. approved final version of manuscript.
REFERENCES
- Berg JM, Tymoczko JL, Stryer L. Biochemistry. New York: W. H. Freeman, 2002. [Google Scholar]
- Bezanilla F, Armstrong CM. Inactivation of the sodium channel. I. Sodium current experiments. J Gen Physiol 70: 549–566, 1977. [DOI] [PMC free article] [PubMed] [Google Scholar]
- Brown KT, Flaming DG. Advanced Micropipette Techniques for Cell Physiology. Chichester, UK: John Wiley & Sons, 1986. [Google Scholar]
- Deitmer JW, Schlue WR. Intracellular Na+ and Ca2+ in leech Retzius neurones during inhibition of the Na+-K+ pump. Pflügers Arch 397: 195–201, 1983. [DOI] [PubMed] [Google Scholar]
- Deitmer JW, Schlue WR. Measurements of the intracellular potassium activity of Retzius cells in the leech central nervous system. J Exp Biol 91: 87–101, 1981. [Google Scholar]
- Eisen JS, Marder E. Mechanisms underlying pattern generation in lobster stomatogastric ganglion as determined by selective inactivation of identified neurons. III. Synaptic connections of electrically coupled pyloric neurons. J Neurophysiol 48: 1392–1415, 1982. [DOI] [PubMed] [Google Scholar]
- Fromm M, Schultz SG. Some properties of KCl-filled microelectrodes: correlation of potassium “leakage” with tip resistance. J Membr Biol 62: 239–244, 1981. [DOI] [PubMed] [Google Scholar]
- Gerard E, Hoschstrate P, Dierkes PW, Coulon P. Functional properties and cell type specific distribution of Ih channels in leech neurons. J Exp Biol 215: 227–238, 2012. [DOI] [PubMed] [Google Scholar]
- Golowasch J, Abbott LF, Marder E. Activity-dependent regulation of potassium currents in an identified neuron of the stomatogastric ganglion of the crab Cancer borealis. J Neurosci 19: RC33, 1999a. [DOI] [PMC free article] [PubMed] [Google Scholar]
- Golowasch J, Casey M, Abbott LF, Marder E. Network stability from activity-dependent regulation of neuronal conductances. Neural Comput 11: 1079–1096, 1999b. [DOI] [PubMed] [Google Scholar]
- Golowasch J, Goldman MS, Abbott LF, Marder E. Failure of averaging in the construction of a conductance-based neuron model. J Neurophysiol 87: 1129–1131, 2002. [DOI] [PubMed] [Google Scholar]
- Golowasch J, Marder E. Ionic currents of the lateral pyloric neuron of the stomatogastric ganglion of the crab. J Neurophysiol 67: 318–331, 1992. [DOI] [PubMed] [Google Scholar]
- Hille B. Ion Channels of Excitable Membranes. Sunderland, MA: Sinauer Associates, 2003. [Google Scholar]
- Hintz K, Günzel D, Schlue WR. Na+-dependent regulation of the free Mg2+ concentration in neuropile glial cells and P neurones of the leech Hirudo medicinalis. Pflügers Arch 437: 354–362, 1999. [DOI] [PubMed] [Google Scholar]
- Hodgkin AL. The ionic basis of electrical activity in nerve and muscle. Biol Rev 26: 339–409, 1951. [Google Scholar]
- Junge D. Ionic properties of resting and active membranes. In: Nerve and Muscle Excitation. Sunderland, MA: Sinauer Associates, 1981, p. 31–40. [Google Scholar]
- Keyser KT, Lent CM. On neuronal homologies within the central nervous system of leeches. Comp Biochem Physiol A 58: 285–297, 1977. [Google Scholar]
- LeMasson G, Marder E, Abbott LF. Activity-dependent regulation of conductances in model neurons. Science 259: 1915–1917, 1993. [DOI] [PubMed] [Google Scholar]
- Lent CM. The Retzius cells within the central nervous system of leeches. Prog Neurobiol 8: 81–117, 1977. [DOI] [PubMed] [Google Scholar]
- Nastuk WL, Hodgkin AL. The electrical activity of single muscle fibers. J Cell Comp Physiol 35: 39–73, 1950. [Google Scholar]
- Prinz AA, Billimoria CP, Marder E. Alternative to hand-tuning conductance-based models: construction and analysis of databases of model neurons. J Neurophysiol 90: 3998–4015, 2003. [DOI] [PubMed] [Google Scholar]
- Pusch M, Neher E. Rates of diffusional exchange between small cells and a measuring patch pipette. Pflügers Arch 411: 204–211, 1988. [DOI] [PubMed] [Google Scholar]
- Schlue WR. Effects of ouabain on intracellular ion activities of sensory neurons of the leech central nervous system. J Neurophysiol 65: 736–746, 1991. [DOI] [PubMed] [Google Scholar]
- Schulz DJ, Goaillard JM, Marder E. Variable channel expression in identified single and electrically coupled neurons in different animals. Nat Neurosci 9: 356–362, 2006. [DOI] [PubMed] [Google Scholar]
- Selverston AI, Russell DF, Miller JP, King DG. The stomatogastric nervous system: structure and function of a small neural network. Prog Neurobiol 7: 215–290, 1976. [DOI] [PubMed] [Google Scholar]
- Siddall ME, Rontelj P, Tevsky SY, Kamany M, Macdonald KS III. Diverse molecular data demonstrate that commercially available medicinal leeches are not Hirudo medicinalis. Proc Biol Sci 274: 1481–1487, 2007. [DOI] [PMC free article] [PubMed] [Google Scholar]
- Stoner LC, Natke E Jr, Dixon MK. Direct measurement of potassium leak from single 3 M KCl microelectrodes. Am J Physiol Renal Fluid Electrolyte Physiol 246: F343–F348, 1984. [DOI] [PubMed] [Google Scholar]
- Turrigiano G, Abbott LF, Marder E. Activity-dependent changes in the intrinsic properties of cultured neurons. Science 264: 974–979, 1994. [DOI] [PubMed] [Google Scholar]
- Turrigiano G, LeMasson G, Marder E. Selective regulation of current densities underlies spontaneous changes in the activity of cultured neurons. J Neurosci 15: 3640–3652, 1995. [DOI] [PMC free article] [PubMed] [Google Scholar]
- Walker RJ, Smith PA. The ionic mechanism for 5-hydroxytryptamine inhibition on the Retzius cells of the leech Hirudo medicinalis. Comp Biochem Physiol 45A: 979–993, 1973. [Google Scholar]
- Walz W, Schlue WR. External ions and membrane potential of leech neuropile glial cells. Brain Res 239: 119–138, 1982. [DOI] [PubMed] [Google Scholar]


