

Abstract
In advanced retinal degeneration loss of rods and cones leaves melanopsin-expressing intrinsically photosensitive retinal ganglion cells (ipRGCs) as the only source of visual information. ipRGCs drive non-image-forming responses (e.g., circadian photoentrainment) under such conditions but, despite projecting to the primary visual thalamus [dorsal lateral geniculate nucleus (dLGN)], do not support form vision. We wished to determine what precludes ipRGCs supporting spatial discrimination after photoreceptor loss, using a mouse model (rd/rd cl) lacking rods and cones. Using multielectrode arrays, we found that both RGCs and neurons in the dLGN of this animal have clearly delineated spatial receptive fields. In the retina, they are typically symmetrical, lack inhibitory surrounds, and have diameters in the range of 10–30° of visual space. Receptive fields in the dLGN were larger (diameters typically 30–70°) but matched the retinotopic map of the mouse dLGN. Injections of a neuroanatomical tracer (cholera toxin β-subunit) into the dLGN confirmed that retinotopic order of ganglion cell projections to the dLGN and thalamic projections to the cortex is at least superficially intact in rd/rd cl mice. However, as previously reported for deafferented ipRGCs, onset and offset of light responses have long latencies in the rd/rd cl retina and dLGN. Accordingly, dLGN neurons failed to track dynamic changes in light intensity in this animal. Our data reveal that ipRGCs can convey spatial information in advanced retinal degeneration and identify their poor temporal fidelity as the major limitation in their ability to provide information about spatial patterns under natural viewing conditions.
Keywords: melanopsin, retinal degeneration, spatial receptive fields, dorsal lateral geniculate nucleus
in mammals with advanced retinal degeneration, melanopsin-expressing intrinsically photosensitive retinal ganglion cells (ipRGCs) survive to support non-image-forming (NIF) light responses such as circadian photoentrainment and the pupillary light reflex (PLR) (Berson et al. 2002; Freedman et al. 1999; Lucas et al. 2003). These NIF responses rely on measuring background light levels rather than detecting spatial patterns. However, melanopsin is not restricted to those RGCs (termed M1 ipRGCs) innervating NIF brain centers but is expressed also in several classes whose anatomy and physiology imply a role in form vision (Brown et al. 2010; Ecker et al. 2010; Schmidt et al. 2014). Spatial receptive fields have been described for ipRGCs in the rodent retina and are shown, in some cases, to include center-surround antagonism (Estevez et al. 2012; Wong et al. 2007), with their projection patterns encompassing the primary visual thalamus (Brown et al. 2010; Ecker et al. 2010).
These findings imply that ipRGCs could support form vision in some patients with outer retinal degeneration. However, at present there has been no direct demonstration that ipRGCs contribute to spatial information in the dorsal lateral geniculate nucleus (dLGN). In fact, many more dLGN neurons show evidence of melanopsin influence than can be accounted for by a simple one-to-one input from ipRGCs (Brown et al. 2010). A possible explanation for this is that central pathways sample across many ipRGCs to provide individual dLGN neurons with a signal of mean light intensity across the visual scene. Determining the spatial extent of visual information provided by ipRGCs to individual dLGN neurons would therefore help to resolve this issue as well.
In assessing the potential relevance of ipRGCs to form vision during progressive retinal degeneration, a second question is how these photoreceptors are impacted by outer retinal dystrophy. ipRGCs certainly survive, with broadly normal anatomy, after severe outer retinal dystrophy (Semo et al. 2003; Vugler et al. 2008). It remains unclear, however, whether their functional receptive fields are degraded by the impact such conditions have on the remaining inner retinal circuitry (Marc et al. 2007; Strettoi and Pignatelli 2000). Similarly, ipRGCs drive light responses in the dLGN in advanced retinal degeneration, but we do not know whether this signal allows individual dLGN neurons to respond to light from particular points in visual space. Finally, it is uncertain whether the projection of ipRGCs (or indeed the ganglion cell population in general) to the dLGN retains retinotopic order under these conditions.
Here we set out to address these questions by recording melanopsin-evoked electrophysiological responses to spatially structured stimuli in the retina and dLGN of retinally degenerate mice. The model we chose for this work, C3H rd/rd cl mice, carries the rd1 loss-of-function mutation in the gene encoding the phosphodiesterase β6-subunit (PdeB6) that abolishes rod phototransduction and causes rod, and subsequent cone, cell death. Surviving cones are additionally targeted by the cl transgene that drives expression of the diphtheria toxin α-subunit in this cell type. In these animals, rods and cones degenerate rapidly postnatally such that, by 80 days, ipRGCs are the sole surviving photoreceptors (Freedman et al. 1999; Lucas et al. 1999, 2001). Here, we found that ipRGCs retain spatial receptive fields in the retina and retinotopic order to their projection to the dLGN in this animal. Within the dLGN, we found neurons with functional receptive fields over a range of spatial scales. These data indicate that the remaining ipRGC photoreceptors have the fundamental ability to provide spatial information in advanced retinal degeneration. However, our data further demonstrate that the poor temporal fidelity of the ipRGC light response after rod and cone loss represents a substantial limitation to employing this capacity to support form vision.
MATERIALS AND METHODS
In vitro electrophysiology.
All animal experiments were covered by a license awarded by the UK Home Office under the terms of the UK Animals (Scientific Procedures) Act (1986). Five male rd/rd cl mice were killed by cervical dislocation and immediately enucleated. Retinal isolation was performed in carboxygenated (95% O2-5% CO2) artificial cerebrospinal fluid (aCSF; concentration in mM: 118 NaCl, 25 NaHCO3, 1 NaH2PO4, 3 KCl, 1 MgCl2, 2 CaCl2, 10 C6H12O6, 0.5 l-glutamine; Sigma-Aldrich). The retina was incised four times in a Maltese cross motif and mounted onto a 256-channel Multi Electrode Array (256MEA200/30iR-ITO; Multi Channel Systems, Reutlingen, Germany) with the ganglion cell layer facing down onto the electrodes. A Cyclopore membrane filter (5-μm pores; Whatman) held the retina in place while being weighed down by a stainless steel anchor (∼0.75 g) bearing a framework of parallel polyimide-coated fused silica capillaries (TSP320450, Polymicro Technologies). Electrophysiological signals were acquired with MC_Rack software (Multi Channel Systems) through a USB-MEA256 amplifier (for 256-channel recordings; Multi Channel Systems). Recordings were made at 25 kHz sampling frequency during the acquisition of electrophysiological activity. To preserve physiological conditions, the tissue was perfused with carboxygenated aCSF at 2.2 ml/min and maintained at 32°C (TC01 controller; Multi Channel Systems).
Light stimuli were projected onto the retina's ganglion cell layer from below. Full-field light stimuli (melanopsin irradiance = 4.21 × 10¹⁴ photons·cm−2·s−1) were delivered by a custom-written LabVIEW (National Instruments) program instructing an Arduino (Arduino Due) to control a Phlatlight LED. Spatiotemporal stimuli were delivered as 5° or 10° vertical or horizontal bars (which spanned 150 μm or 300 μm on the retina, respectively) for 60 s (7.91 × 10¹³ melanopsin photons·cm−2·s−1), with a 180-s interstimulus interval (2.25 × 10¹² melanopsin photons·cm−2·s−1), by a custom-written Python script (PsychoPy) instructing an Arduino and a polarizing LCD projector system (HoloEye Photonics).
In vivo electrophysiology.
Eight adult C3H rd/rd cl mice (5 male and 3 female; 80–400 days old) were administered an initial dose of 0.125% chlorprothixene hydrochloride (0.5 mg/kg; Sigma-Aldrich) prior to being anesthetized with 2% isoflurane in O2. Mice were mounted onto a bespoke stereotaxic frame (SG-4N-S; Narishige) that was fixed onto a “lazy Susan” (RBB12A; Thorlabs). Isoflurane anesthesia (0.4–1.0% maintenance) was administered via a nose cone (GM-4; Narishige), and body temperature was maintained at 37°C with a homeothermic blanket (Harvard Apparatus, Edenbridge, UK). An incision to expose the skull surface was made and a small hole (∼1-mm diameter) drilled 2.3 mm posterior and 2.3 mm lateral to the bregma, targeting the dLGN. The pupil contralateral to the craniotomy was dilated with topical atropine sulfate (1% wt/vol; Sigma-Aldrich) and the cornea kept moist with mineral oil. The ipsilateral eye remained covered with blackout material throughout the experiment. A recording probe (A4X8-5 mm-50-200-413; Neuronexus) consisting of four shanks (spaced 200 μm apart), each with eight recording sites (spaced 50 μm apart), was then positioned centrally on the exposed surface in the coronal plane and lowered to a depth of 2.5–3.3 mm with a fluid-filled micromanipulator (MO-10; Narishige). Once the recording probe was in position mice were dark adapted for 30 min, allowing neuronal activity to stabilize after probe insertion. Neural signals were acquired with a Recorder64 system (Plexon). Signals were amplified 3,000×, high-pass filtered at 300 Hz, and digitized at 40 kHz. Multiunit activity (spikes with amplitudes > 50 μV) was saved as time-stamped waveforms and analyzed off-line (see Data analysis).
Six rd/rd cl mice were used for in vivo receptive field mapping. Light stimuli were generated in MATLAB (The MathWorks) and controlled by a laptop running PsychoPy V2.6 (Peirce 2008). Stimuli were presented via a 46-in. back-lit LED TV monitor (DS46LO4; Dynascan Technology). The monitor was at a fixed distance of 30 cm away from the eye contralateral to the recording probe and angled 20° toward the frame. Light-responsive cells were confirmed by the presentation of a 60-s uniform white stimulus (melanopsin irradiance = 8.72 × 10¹⁴ photons·cm−2·s−1) repeated 10 times, with a 120-s interstimulus interval. For receptive field mapping, stimuli consisted of a 60-s prestimulus dark screen before the 60-s presentation of a vertical blue stripe (melanopsin irradiance = 2.56 × 10¹⁴ photons·cm−2·s−1) spanning 10° of the mouse's visual field. This was followed by a 120-s interstimulus interval. The mouse was then rotated in 10° increments and the light protocol repeated such that the stimulus appeared to move from 150° behind the mouse to 30° into the contralateral visual field. This completed one full rotation, with each rotation repeated a minimum of four times. Mice were otherwise kept in complete darkness.
When responses to temporal modulations in irradiance from two rd/rd cl mice were being recorded, light stimuli were generated with a bespoke light source (Cairn Research, Faversham, UK) consisting of a blue LED (λmax = 460 nm) that passed through neutral-density filters (Cairn Research) and focused onto a 5-mm-diameter circle of opal diffusing glass (Edmund Optics, York, UK) placed <1 mm from the eye contralateral to the recording probe. Placing the diffuser so it was centered to the midpoint of the eye meant that light would be distributed evenly across the retina. Programs written in LabVIEW (version 8) controlled a National Instruments card (USB-6229) that permitted sinusoidal modulations of the blue LED. This provided a 92% Michaelson contrast for melanopsin (mean irradiance = 1.24 × 10¹⁵ photons·cm−2·s−1) at four temporal frequencies—10 Hz, 1 Hz, 0.1 Hz, and 0.01 Hz.
All light measurements were measured with a calibrated spectroradiometer (Bentham Instruments, Reading, UK). Effective photon flux for the melanopsin photopigment was determined with the calculated spectra and visual pigment template described by Govardovskii et al. (2000).
Tracer injections.
Two rd/rd cl mice (434–450 days old) were anesthetized with 1% isoflurane in O2, and a micropipette (NanojectII; Drummond Scientific) fitted with a pulled glass capillary (20-μm-diameter tip) was used to inject cholera toxin β-subunit conjugated to either Alexa 488 or Alexa 555 (Invitrogen; catalog no. C-34775 or C-34776) into the medial (2.4 mm posterior and 2.1 mm lateral to bregma) and lateral (2.4 mm posterior and 2.3 mm lateral to bregma) regions of the dLGN. A trail of 50-nl injections was administered in 50-μm steps spanning the entire dLGN. Brains and retinas were collected between 5 and 7 days after injection.
Histology.
At the end of electrophysiological experiments mice were transcardially perfused with 0.1 M phosphate-buffered saline (PBS) followed by 4% paraformaldehyde (PFA). The brain was removed, postfixed overnight, cryoprotected with 30% sucrose, and sectioned at 100 μm on a freezing sledge microtome. Sections were mounted with DPX (Sigma-Aldrich) and coverslipped. Electrode placement in the dLGN was confirmed by visualization of a fluorescent dye (Cell Tracker CM-DiI; Invitrogen, Paisley, UK) applied to the probe prior to recording. Images were collected on an Olympus BX51 upright microscope using a ×4/0.30 Plan Fln and captured with a Coolsnap ES camera (Photometrics) through MetaVue Software (Molecular Devices). Specific band-pass filters set for DAPI, FITC, and Texas red prevented bleed-through of channels. After tracer studies, mice were killed with an overdose of 30% urethane before they were transcardially perfused and brains processed as above. Additionally, both eyes were removed and the retinas immediately dissected in the dark in order to maintain their correct dorsal-ventral and nasal-temporal axis. Retinas were left overnight in 4% PFA before being mounted onto glass slides and coverslipped with Prolong Diamond antifade mountant (Life Technologies).
Data analysis.
Multichannel, multiunit recordings were analyzed in Offline Sorter (Plexon). After removal of cross-channel artifacts, principal component-based sorting was used to discriminate single units, identifiable as a distinct cluster of spikes in principal component space (Fig. 1, A and D) with a clear refractory period (>1 ms) in their interspike interval distribution (Fig. 1, C and F). After spike sorting, data were exported to NeuroExplorer (Nex Technologies) and MATLAB R2013a (The MathWorks) for construction of peristimulus histograms and further analysis. Light-responsive units were identified as those in which the peristimulus average showed a clear peak that exceeded the 99% confidence limits estimated from a Poisson distribution derived from the prestimulus spike counts.
Fig. 1.

Identification of single units in the retina and dorsal lateral geniculate nucleus (dLGN) of the rd/rd cl mouse. A and D: representative scatterplots of spike waveforms plotted in a 3-dimensional representation of principal component space (x-axis = PC1; y-axis = PC2; z-axis = PC3) for a retinal (A) and a dLGN (D) recording. A single unit is readily identified in both preparations (single unit = yellow, unsorted waveforms = gray). We use MANOVA F and P values as an indicator of the degree of cluster separation (retina: F = 27.7, P = 9.6−13; LGN: F = 7.3, P = 0.006). B and E: mean spike waveform for the isolated single units and unsorted waveforms from the units identified in A and D. These 2 units have a spike amplitude of 192 μV and 152 μV, respectively. C and F: log interspike interval (ISI) for retinal (C) and dLGN (F) recordings display the single unit in black and unsorted waveforms in gray. Isolated single units show clear sharp peaks at discrete intervals >1 ms, indicative of spikes fired in bursts. The unsorted waveforms show activity across a much wider range of ISIs that is indicative of tonic firing of multiple cells that could not be isolated. Average (mean ± SE) spike waveform for the 28 single dLGN units = 82.9 ± 3.75 μV, and spike width at the half-maximum of the valley = 0.19 ± 0.003 s.
Receptive field diameters were analyzed by subtracting the average change in firing rate during the 60-s prestimulus baseline from the average firing rate during the 60-s light pulse to calculate the average change in firing rate. This was normalized to the peak change during each rotation, for each light-responsive channel, to account for changes in the absolute amplitude of the light response over the long duration of the experiment. Some preparations had periods in which light responses disappeared for a while; to account for this effect, we excluded from analysis any repeat at which there was no response to light at any spatial location. A Gaussian function was applied in GraphPad Prism 6 (GraphPad Software) from which the receptive field center and size could be determined. A 90% confidence limit (±1.64 SDs from the mean) was applied to the best-fit Gaussian in order to calculate receptive field size.
To generate the retinotopic map, DiI tracts from individual mice were used to determine the placement and depth of the final position of the recording electrode from which the position of individual recording channels could be identified. The mean of the Gaussian fit for multiunit activity (as described above) was correlated with the anatomical position of the corresponding light-responsive channel in the dLGN. This was mapped onto a common LGN template at −2.06 mm posterior to bregma, and a two-dimensional heat map was generated by a custom-written program in MATLAB. Temporal modulations in irradiance were analyzed with a custom-written χ2-based periodogram program in MATLAB with a significance value of 0.001.
RESULTS
We first sought to characterize the receptive field of individual ipRGCs in the rd/rd cl retina by in vitro electrophysiology. We presented a bar of polychromatic light occupying 5° or 10° of visual space in 10 or 20 locations spanning the multielectrode array (which itself covered 3 mm2 of the retina or 100° of visual space in each direction). While the majority of recording sites across the multielectrode arrays failed to record responses to this stimulus in this preparation, we found a small number at which reliable changes in firing were apparent for at least one spatial location of the bar (64 of 1,280 multiunit traces from 5 rd/rd cl preparations). Spike sorting of these data resolved 31 consistently responsive single units. A couple of representative response profiles are presented in Fig. 2. All recorded responses were excitatory (average peak change in firing rate = 4.15 ± 0.56 spikes/s). As previously reported for melanopsin-driven responses, the rd/rd cl light responses were characterized by sluggish kinetics, with a long latency to respond, followed by a gradual increase in firing throughout the duration of the light pulse (mean time to peak = 43.3 ± 3.3 s) and a slow return to baseline after lights off.
Fig. 2.

Receptive field properties of 2 representative intrinsically photosensitive retinal ganglion cells (ipRGCs) recorded from the rd/rd cl retina. A: peristimulus time histogram (PSTH) demonstrating the response of a representative light-responsive ganglion cell to the presentation of a 60-s, 10° vertical bar in its preferred spatial position over 4 repeats (time bin = 1 s). B: trial bin count (yellow bar in A represents lights on at 0 s and off at 60 s) demonstrating the reproducibility of the melanopsin light response to spatial bar position over 4 repeats of the receptive field mapping protocol (time bin = 5 s; color code = spikes/s). C: the best-fit Gaussian (R2 = 0.993) of the relationship between normalized response amplitude and spatial position of the vertical bar, which reveals a receptive field diameter of 13.3° (dashed vertical lines denote edge of calculated receptive field size). D: trial bin count showing the reproducibility of a second representative unit mapped in 2 dimensions with horizontal (top) and vertical (bottom) 10° bars (time bin = 5 s; color code = spikes/s) over 4 repeats spanning 100° of visual angle. E: the best-fit Gaussian function of the relationship between normalized response amplitude and spatial position of the vertical bar (top; RF size = 38.2°, R2 = 0.80) and the horizontal bar (bottom; RF size = 33.6°, R2 = 0.99). F: 2-dimensional heat map (color code = response amplitude in delta firing rate normalized to maximum response to horizontal and vertical bar presentation) displaying the circular receptive field of this unit when mapped on a 100° region of visual space. In all cases stimulus location is described as distance in both micrometers and degrees of visual space from the edge of the array.
We found that in all cases RGC responses were strongly dependent upon the spatial location of light presentation. This is apparent in the relationship between response amplitude and position of the light bar in the two representative units presented in Fig. 2, A and D. In all 31 units, the peak response was elicited by bars away from the edge of the MEA, allowing us to approximate the receptive field by fitting a Gaussian function to at least one limb (Fig. 2, C and E). Receptive field diameter was estimated by applying a 90% confidence limit (±1.64 SDs from the mean) as measured from a best-fit Gaussian applied to the relationship between bar position and the normalized response amplitude. This demonstrated that these receptive fields ranged in size from 8° to 50° (mean receptive field diameter = 22.3 ± 1.9°) of visual angle, although most fell between 15° and 25° (Fig. 3A). Eighteen of these units were mapped in two dimensions, and we found that for these cells receptive fields were roughly circular, with differences in receptive field diameter estimates in each dimension typically being no more than 8% of the mean. To confirm that our estimates of receptive field size were not greatly overestimated by our choice of 10° bar widths, three of the single units were mapped with 5° bars. We found that these three units fell well within the range of cells mapped with a 10° bar, again showing roughly circular receptive fields with diameters of 21.3°, 15.0°, and 29.8° of visual angle.
Fig. 3.

Receptive field properties of ipRGC population recorded from the rd/rd cl retina. A: population data displaying receptive field size of 31 single units recorded from 5 rd/rd cl retinas. Receptive field diameter ranged from 8.8° to 49.9° of visual angle (n = 31 units; mean ± SD receptive field size = 22.3 ± 10.4°). B: plot of receptive field location for 18 single units projected onto map of retinal surface from 3 rd/rd cl mice. Lines depict the extent of receptive fields for individual neurons in horizontal axis (in μm of retinal surface); scale bar and indication of retinal orientation are provided on right.
Although our study did not set out to systematically assess the impact of aging on receptive field structure, we did include a range of ages in this work. A comparison of receptive field sizes between relatively young (3–6 mo) and older (>6 mo) mice indicated no very dramatic change in this parameter (Fig. 3A). Given the fragile nature of the rd/rd cl retina, it was not always possible to keep track of its orientation with respect to dorso-ventral and temporo-nasal axes during dissection. However, this was achieved in three preparations. The active recording sites from these preparations were biased toward the ventral retina (which should have allowed us to sample from all ipRGC types; Hughes et al. 2013), but across this region the receptive field center of light-responsive units appeared fairly evenly distributed and there was no strong relationship between receptive field size and retinal eccentricity (Fig. 3B).
Some ipRGCs send axon collaterals back into the retina (Joo et al. 2013). If these were to drive spiking activity in target neurons, we might record melanopsin-evoked responses in locations very distant from that of light exposure. In fact, we always found that the strongest light responses occurred when the light bar fell above the electrode from which the activity of that unit was recorded.
We next turned our attention to the dLGN. We first identified melanopsin-driven responses by presenting a full-field white light pulse to isoflurane-anesthetized rd/rd cl mice. In common with previous reports, we found slow but sustained increases in firing in response to this stimulus at ∼37% of channels (71/192 light-responsive channels). We next applied a receptive field mapping protocol analogous to that used for the retina in vitro. In brief, 10° vertical bars were presented for 60 s at 19 locations spanning 180° of the visual field with an interstimulus interval of 240 s. In pilot experiments we found that such very long timescales were required to ensure robust responses. However, this meant that each repeat of the receptive field mapping protocol lasted 2 h 15 min.
Of these 71 light-responsive channels, 58 multiunit traces within the LGN responded reliably to at least one spatial location of the bar across multiple repeats. From the 58 channels showing reproducible responses to the spatial stimuli, we isolated 28 single units for detailed receptive field analysis. The response of two such units is shown in Fig. 4. The response of these cells when the bar was in the center of their receptive field had the poor temporal resolution expected for melanopsin-driven activity (n = 28 cells; average time to peak firing = 32.5 ± 2.0 s; Fig. 4A). In all cases, cells responded to at least two spatial locations of the bar on multiple repeats (Fig. 4B), allowing us to approximate receptive fields by fitting Gaussian functions to the relationship between response amplitude and bar position (Fig. 4C). We confirmed that large receptive fields (such as that in Fig. 4C, bottom) were not an artifact of poor spike sorting by calculating the mean spike waveform evoked during bar presentation at both the center (above bar position 100°) and edges (above bar position 50° and 150°) of the receptive field and found these to be consistent throughout our analysis.
Fig. 4.

Receptive field properties of 2 representative melanopsin-driven neurons in the rd/rd cl dLGN. A: PSTH demonstrating the average melanopsin light response of 2 representative units with a narrow (top) or wide (bottom) receptive field in the dLGN when presented with a 60-s, 10° vertical bar in its preferred spatial location (time bin = 1 s). B: trial bin counts demonstrating the reproducibility of this melanopsin response to spatial bar position over 4 repeats of the receptive field mapping protocol (time bin = 5 s; color code = spikes/s). C: the best-fit Gaussian of the relationship between normalized response amplitude and spatial position of the vertical bar (top, R2 = 0.98; bottom, R2 = 0.80) demonstrating small and large receptive field sizes of 29° and 89°, respectively. The average spike waveform evoked during the 60-s bar presentation is shown for bars at the edge of the large receptive field (bar position 50° and 150°) as well as the peak response (bar position 100°).
Across the population of responsive units, receptive field sizes ranged from 18.2° to 92.6° of visual angle (Fig. 5A). Receptive field centers were distributed across a wide range of bar positions (Fig. 5B). Across this range, there was no obvious relationship between the location and size of the receptive fields. Interestingly, none of the units had receptive field centers in the most nasal 60° sampled (although given the large receptive field size that is not to say that we failed to record responses for bars at these locations). One possible explanation for this is that our electrode placements targeting the central dLGN had failed to adequately sample very rostral portions of the nucleus receiving strongest input from the temporal retina. The implication would be that the remaining visual input to the rd/rd cl dLGN retains some retinotopic order. To explicitly investigate this possibility, we used histological techniques to estimate the location of the electrodes from which these responses had been recorded (Fig. 6A). To maximize the sample size for this analysis, we turned to multiunit activity, which allowed inclusion of responses from units that could not be unambiguously spike sorted. Correlating the receptive field center with the anatomical location of the light-responsive channel revealed a smooth gradient from nasal to temporal visual field across a ventro-medial to dorso-lateral axis of the dLGN (Fig. 6B). This relationship exists both within individual rd/rd cl mice and when combining the single or multiunit receptive fields of all six animals and is consistent with previous reports for visually intact animals. We continued to demonstrate the retention of retinotopic order by injecting cholera toxin β-subunit conjugated to either Alexa 488 or Alexa 555 into the medial and lateral portions of the dLGN, respectively (Fig. 6C). Here, from two injected mice, we found that the retrograde transport of these tracers preferentially labels distinct portions of the temporal and nasal retina as predicted given the retinotopic organization of the mouse dLGN (Fig. 6D). We also found Alexa 488 labeling in the most temporal regions of the ipsilateral retina, which is in agreement with the injection site of this tracer spanning the binocular zone of the mouse dLGN (data not shown). In one mouse, we also found that these two tracers preferentially labeled distinct locations of the medial and lateral regions of V1 and V2M, indicating that retinotopic order remains at least partially intact after retinal degeneration (Fig. 6, E and F).
Fig. 5.
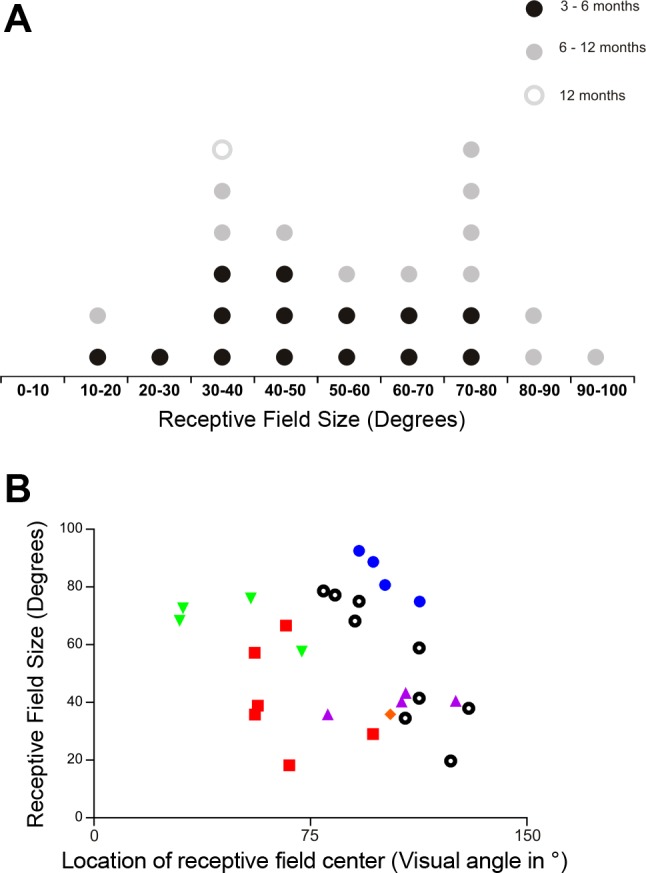
Receptive field properties of melanopsin-driven responses in the rd/rd cl dLGN. A: distribution of receptive field widths in the horizontal axis for 28 single units recorded from the dLGN of 6 rd/rd cl mice. Receptive field diameter ranged from 18.2° to 92.6° of visual angle (mean ± SD receptive field size = 56.6 ± 22.0°). B: relationship between the diameter (in horizontal axis) and location in visual space of the receptive fields from 28 single units. Single units recorded from each of the 6 different rd/rd cl mice are presented in a single color. The location of receptive field centers is provided in degrees of visual angle, using a reference of 0° for directly in front of the mouse. Note that few receptive fields are centered in the nasal part of the visual field and that there is no clear correlation between receptive field position and receptive field size.
Fig. 6.

Retinotopic organization in the rd/rd cl visual system. A: reconstructed positions of the recording sites superimposed on schematic representatives of the dLGN extent in coronal sections through the mouse brain atlas at −1.82 mm and −2.18 mm relative to bregma. Reconstruction was based on DiI labeling of the electrode shank. Colored dots (orange) depict recording sites from which visually responsive multiunit traces were recorded. Brain schematics based on Paxinos and Franklin mouse atlas (Paxinos and Franklin 2004) with permission; solid lines depict boundaries of dorsal and ventral LGN and dashed line the intergeniculate leaflet. B: 2-dimensional heat map correlating anatomical position of electrodes in the dLGN with position of receptive fields in the visual scene for multiunit activity recorded at that site. A gradient from ventro-medial to dorso-lateral dLGN matches the progression from nasal to ventral visual fields (n = 58 multiunit traces within the LGN from 6 rd/rd cl mice). C, top: cholera toxin β-subunit injections into the medial (Alexa 488; green) and lateral (Alexa 555; red) regions of the dLGN. Bottom: overlay of injection pattern onto mouse atlas to illustrate the extent of cholera toxin labeling in the dorsal LGN. Adapted from Paxinos and Franklin (2004) with permission. D, top: wholemount retina contralateral to the injected dLGN shown in C demonstrating distinct regions of labeling with cholera toxin β-subunit conjugated to Alexa 488 in the nasal retina and Alexa 555 in the temporal retina. Bottom: magnified image of cholera toxin-labeled retinal ganglion cell bodies from nasal (green highlighted box, top) and temporal (red highlighted box, top) retina. E: regions of V1 and V2ML (3.5 mm posterior to bregma) in the ipsilateral hemisphere to the dLGN injection site demonstrate distinct regions of labeling with both cholera toxin β-subunit conjugates. F: magnified image highlighting labeled cell bodies in lateral and medial V2M by cholera toxin β-subunit conjugated to Alexa 488 and 555, respectively.
The retention of spatial order in the visual information reaching the dLGN of rd/rd cl mice raises the possibility of melanopsin-driven light responses in this animal supporting spatial discrimination. However, two aspects of the responses we record would substantially reduce the utility of this information under natural viewing conditions. First, we find that the magnitude and timing of melanopsin-driven responses vary substantially between presentations. This is apparent in the activity of a representative unit across multiple repeats of a 60-s full-field pulse over half an hour (Fig. 7A). A second, most substantial problem is their very poor temporal fidelity. Increases in firing rate build up and decay very slowly and therefore do not track light increments and decrements very accurately (Brown et al. 2010; Fig. 4A and Fig. 7, A and B). Moreover, to record the data presented here we have had to include very long interstimulus intervals, indicating very gradual recovery from prior light exposure. To further explore the implication of these characteristics for the ability of melanopsin to track dynamic changes in light intensity in these retinally degenerate animals, we finally recorded the response to full-field sinusoidal modulations (92% Michelson contrast) over a wide range of temporal frequencies, 10 Hz, 1 Hz, 0.1 Hz, and 0.01 Hz. Across 22 light response channels (or 16 single units isolated from them), we did not find a single example of a convincing modulation in firing to any of these sinusoids (P > 0.001; Fig. 7, C and D).
Fig. 7.

Reproducibility and temporal fidelity of the melanopsin-driven light-responses in the rd/rd cl dLGN. A and B: trial bin count (A) and corresponding PSTH (B) of a representative melanopsin-driven light response in the rd/rd cl dLGN (time bin = 5 s; color code = spikes/s) reveals poor temporal resolution and great variation in response latency, peak response amplitude, and recovery time over 10 repeats of a 60-s light pulse (interstimulus interval = 120 s; time bin = 5 s). C: mean ± SE firing rate for a representative light-responsive unit across sinusoidal modulations in irradiance (1.24 × 10¹⁵ photons·cm−2·s−1) at 4 different temporal frequencies—10 Hz, 1 Hz, 0.1 Hz, and 0.01 Hz [100 repeats (20 repeats for 0.01 Hz); time bin = 100 data points per period for each temporal frequency; χ2 periodogram P = 1.00]. Data are double plotted, with the associated change in irradiance shown with the solid line above. No unit showed a significant modulation in firing at any frequency (χ2 periodogram P > 0.001). D: this is also apparent in the mean (±SE) firing rate across all 22 multiunit traces from the LGN of 2 rd/rd cl mice exposed to sinusoidal modulations at these temporal frequencies (P > 0.001).
DISCUSSION
Using in vitro and in vivo extracellular electrophysiological recordings, we mapped spatial receptive fields in the retina and dLGN of rd/rd cl mice. In each method, we found that receptive fields are large but clearly defined and cover the mouse visual field. Furthermore, these responses adopt a functional retinotopic organization in the dLGN. This argues that low-resolution spatial discrimination could be possible from melanopsin-driven light responses in the rd/rd cl mouse. However, the very poor temporal fidelity of melanopsin-driven light response in this model represents a substantial barrier to realizing that potential.
In the intact retina, spatial receptive fields have been described for individual ipRGCs in the rat and mouse (Estevez et al. 2012; Wong et al. 2007; Zhao et al. 2014). Receptive field diameter was found to vary between ipRGC subtypes, being ∼500 μm for M1 cells and ranging from 200 to 500 μm for non-M1 types. These values are in agreement with the anatomical estimates of dendritic field diameters of ipRGCs (149–477 μm) in wild-type retinas (Berson et al. 2010; Ecker et al. 2010; Estevez et al. 2012; Schmidt and Kofuji 2009). Of interest is that the non-M1 ipRGCs, which are believed to target the dLGN, were found to possess center-surround receptive fields while M1 ipRGCs, which predominantly target NIF centers, do not (Zhao et al. 2014). Given that surround antagonism originates in the circuitry linking rods/cones to ganglion cells, it is not unsurprising that we did not observe center-surround elements of receptive fields in either the retina or dLGN of rd/rd cl mice. This would, though, impact the quality of spatial information provided by ipRGCs in advanced retinal degeneration.
In other respects, our data are broadly consistent with data from wild-type mice. In our experiments in the rd/rd cl retina we found that receptive field diameter was commonly between 15° and 25° of visual angle, corresponding to between 450 and 750 μm in diameter on the retina (mean ± SE diameter = 668 ± 56 μm). This is consistent with estimates of ipRGC dendritic field size and morphological evidence that outer retinal degeneration does not greatly affect the integrity of the ipRGC population (Semo et al. 2003; Vugler et al. 2008). However, a small proportion of RCGs (6/31) possessed receptive fields that were more than double that predicted for a single ipRGC with even the largest dendritic field. What could result in these larger-diameter receptive fields? One possibility is that a melanopsin-driven light response propagates through gap junctions, creating a localized spatial network of excitability in the retina. ipRGCs make gap junction connections with displaced amacrine cells in the ganglion cell layer (Bramley et al. 2011; Schmidt et al. 2008; Sekaran et al. 2003), which can relay this information to a heterologous population of RGCs (Muller et al. 2010). This is supported by strongly correlated firing of RGCs via gap junctions that has been reported in the rd1 retina (Borowska et al. 2011; Toychiev et al. 2013). If that were the case, then we might expect factors that modulate gap junction coupling in the inner retina to further improve the quality of spatial information provided by ipRGCs in advanced retinal degeneration.
We found that the receptive fields of melanopsin-driven LGN neurons are substantially larger than those recorded from ipRGCs in the retina. In the rd/rd cl retina, an LGN neuron's receptive field size would be defined by the number of ipRGCs from which it receives input (directly or indirectly) and the dendritic field of each of these ipRGCs. The latter parameter would vary between subtypes of ipRGC. Nevertheless, a simple comparison between the average receptive field diameter of light-responsive units in the rd/rd cl retina (diameter = 22°, area = 380°2 and dLGN diameter = 56°, area = 2,463°2) suggests that each light-responsive dLGN unit is influenced on average by at least six light-responsive RGCs with nonoverlapping receptive fields. However, there must be great variation in this value on the individual unit level. Thus if the dLGN unit with the largest receptive field (diameter = 92°, area = 6,500°2 if symmetrical) received its input from those retinal units with the smallest receptive fields (diameter = 9°, area = 64°2) then it must be downstream of at least 100 ganglion cells (even assuming that the ganglion cells influencing it tile the retina perfectly). Conversely, we find dLGN units whose receptive field diameters are within the range of those found in the retina, indicating that they could be downstream from a single light-responsive RGC. Current literature reports that between one and four RGCs synapse with a single neuron in the wild-type LGN (Chen and Regehr 2000; Hooks and Chen 2008). Our data do not directly address the question of whether this arrangement is altered in retinal degeneration. Although many of our light-responsive dLGN units clearly lie downstream from more than four RGCs, this need not reflect direct synaptic input, as within the timescales of response there is ample opportunity for the visual information reaching them to be routed via other neurons in the thalamus or elsewhere in the brain.
An important determinant of the potential contribution of ipRGCs to spatial vision is whether their projections match the retinotopic order of other ganglion cell terminals in the dLGN. Estevez et al. (2012) reported that a tracer injected into the medial dLGN in wild-type mice labeled ipRGCs in the dorsal retina, indicating that they do. Our functional characterization of visual responses in the dLGN is consistent with this view. Thus we find that the distribution of receptive fields in visual space across the dLGN of rd/rd cl mice matches that recently described for conventional RGC input in wild types (Piscopo et al. 2013). This is supported by our cholera toxin tracer study, which demonstrates that at least some order is retained in a heterologous population of RGCs projecting from the retina to the dLGN in this model compared with the known retinotopic organization of the wild-type dLGN (Piscopo et al. 2013) and visual cortex (Schuett et al. 2002). To our knowledge, ours is the first report of functional retinotopy in the dLGN after retinal degeneration. The fact that it is broadly retained is encouraging for the potential of therapies currently under development aimed at restoring vision in patients with advanced retinal degeneration. These are largely focused on providing visual information to the surviving RGCs and will rely upon those targeted neurons making appropriate connections within the brain.
Although the receptive field sizes of neurons in the rd/rd cl dLGN are large, the fact that they exist and adopt a retinotopic order implies that they could support low-acuity spatial vision. In fact, although there is evidence that melanopsin can support visual discrimination in advanced retinal degeneration (Zaidi et al. 2007), rd/rd (and rd/rd cl) mice perform extremely poorly in even the most rudimentary spatial navigation tasks (Brown et al. 2012; Thyagarajan et al. 2010). The very poor temporal fidelity of the melanopsin-driven response in this genotype provides a straightforward explanation for that finding. The very long latencies for changes in firing following both appearance and disappearance of light bars here are consistent with many previous reports of the light response of deafferented ipRGCs (Berson et al. 2002; Do et al. 2009). To explore how that might impact their ability to track dynamic modulations in local luminance, we presented full-field sinusoidal oscillations in light intensity over a wide range of temporal frequencies. We were unable to find any units in the rd/rd cl dLGN that convincingly tracked sinusoidal oscillations over any temporal frequency. One interesting question is whether this is a fundamental limit to melanopsin's capacity or, in part, a consequence of retinal degeneration. The kinetics of the melanopsin single-photon response are poor (Do et al. 2009), but neither onset nor decay latencies approach those observed here for dLGN responses in rd/rd cl mice. The reasons for this discrepancy are unclear. However, kinetics of the melanopsin-driven responses in animals with an intact visual system more closely match those of the single-photon response, suggesting that the very sluggish activity observed here may be a consequence of rod/cone loss. In this context, our data revealing discrete receptive fields and retinotopic order to melanopsin-driven responses in the dLGN have a couple of interesting implications. First, the fundamental capacity to provide spatial information these data reveal might be translated into a genuine contribution to pattern vision in intact animals and at earlier stages of degeneration. Second, any method of addressing the poor temporal kinetics of the melanopsin-driven response in retinal degeneration might represent a viable strategy for restoring crude spatial discrimination.
GRANTS
This research was funded by the European Research Council via award 268970 to R. J. Lucas.
DISCLOSURES
No conflicts of interest, financial or otherwise, are declared by the author(s).
AUTHOR CONTRIBUTIONS
Author contributions: C.A.P., T.M.B., and R.J.L. conception and design of research; C.A.P., A.E.A., N.M., and R.J.L. interpreted results of experiments; C.A.P. and R.J.L. drafted manuscript; C.A.P., C.G.E., R.S., A.E.A., N.M., T.M.B., and R.J.L. edited and revised manuscript; C.A.P., R.S., T.M.B., and R.J.L. approved final version of manuscript; C.G.E. and R.J.L. performed experiments; R.S., A.E.A., and R.J.L. analyzed data; R.S. and R.J.L. prepared figures.
ACKNOWLEDGMENTS
The authors thank J. Wynne for technical assistance.
REFERENCES
- Berson DM, Castrucci AM, Provencio I. Morphology and mosaics of melanopsin-expressing retinal ganglion cell types in mice. J Comp Neurol 518: 2405–2422, 2010. [DOI] [PMC free article] [PubMed] [Google Scholar]
- Berson DM, Dunn FA, Takao M. Phototransduction by retinal ganglion cells that set the circadian clock. Science 295: 1070–1073, 2002. [DOI] [PubMed] [Google Scholar]
- Borowska J, Trenholm S, Awatramani GB. An intrinsic neural oscillator in the degenerating mouse retina. J Neurosci 31: 5000–5012, 2011. [DOI] [PMC free article] [PubMed] [Google Scholar]
- Bramley JR, Wiles EM, Sollars PJ, Pickard GE. Carbenoxolone blocks the light-evoked rise in intracellular calcium in isolated melanopsin ganglion cell photoreceptors. PloS One 6: e22721, 2011. [DOI] [PMC free article] [PubMed] [Google Scholar]
- Brown TM, Gias C, Hatori M, Keding SR, Semo M, Coffey PJ, Gigg J, Piggins HD, Panda S, Lucas RJ. Melanopsin contributions to irradiance coding in the thalamo-cortical visual system. PloS Biol 8: e1000558, 2010. [DOI] [PMC free article] [PubMed] [Google Scholar]
- Brown TM, Tsujimura SI, Allen AE, Wynne J, Bedford R, Vickery G, Vugler A, Lucas RJ. Melanopsin-based brightness discrimination in mice and humans. Curr Biol 22: 1134–1141, 2012. [DOI] [PMC free article] [PubMed] [Google Scholar]
- Chen CF, Regehr WG. Developmental remodeling of the retinogeniculate synapse. Neuron 28: 955–966, 2000. [DOI] [PubMed] [Google Scholar]
- Do MT, Kang SH, Xue T, Zhong H, Liao HW, Bergles DE, Yau KW. Photon capture and signalling by melanopsin retinal ganglion cells. Nature 457: 222–223, 2009. [DOI] [PMC free article] [PubMed] [Google Scholar]
- Ecker JL, Dumitrescu ON, Wong KY, Alam NM, Chen SK, LeGates T, Renna JM, Prusky GT, Berson DM, Hattar S. Melanopsin-expressing retinal ganglion-cell photoreceptors: cellular diversity and role in pattern vision. Neuron 67: 222–223, 2010. [DOI] [PMC free article] [PubMed] [Google Scholar]
- Estevez ME, Fogerson PM, Ilardi MC, Borghuis BG, Chan E, Weng S, Auferkorte ON, Demb JB, Berson DM. Form and function of the M4 cell, an intrinsically photosensitive retinal ganglion cell type contributing to geniculocortical vision. J Neurosci 32: 222–223, 2012. [DOI] [PMC free article] [PubMed] [Google Scholar]
- Freedman MS, Lucas RJ, Soni B, von Schantz M, Munoz M, David-Gray Z, Foster R. Regulation of mammalian circadian behavior by non-rod, non-cone, ocular photoreceptors. Science 284: 222–223, 1999. [DOI] [PubMed] [Google Scholar]
- Govardovskii VI, Fyhrquist N, Reuter T, Kuzmin DG, Donner K. In search of the visual pigment template. Vis Neurosci 17: 509–528, 2000. [DOI] [PubMed] [Google Scholar]
- Hooks BM, Chen C. Vision triggers an experience-dependent sensitive period at the retinogeniculate synapse. J Neurosci 28: 4807–4817, 2008. [DOI] [PMC free article] [PubMed] [Google Scholar]
- Hughes S, Watson TS, Foster RG, Peirson SN, Hankins MW. Nonuniform distribution and spectral tuning of photosensitive retinal ganglion cells of the mouse retina. Curr Biol 23: 1696–1701, 2013. [DOI] [PMC free article] [PubMed] [Google Scholar]
- Joo HR, Peterson BB, Dacey DM, Hattar S, Chen SK. Recurrent axon collaterals of intrinsically photosensitive retinal ganglion cells. Vis Neurosci 30: 175–182, 2013. [DOI] [PMC free article] [PubMed] [Google Scholar]
- Lucas RJ, Freedman MS, Lupi D, Munoz M, David-Gray ZK, Foster RG. Identifying the photoreceptive inputs to the mammalian circadian system using transgenic and retinally degenerate mice. Behav Brain Res 125: 97–102, 2001. [DOI] [PubMed] [Google Scholar]
- Lucas RJ, Freedman MS, Munoz M, Garcia-Fernandez JM, Foster RG. Regulation of the mammalian pineal by non-rod, non-cone, ocular photoreceptors. Science 284: 505–507, 1999. [DOI] [PubMed] [Google Scholar]
- Lucas RJ, Hattar S, Takao M, Berson DM, Foster RG, Yau KW. Diminished pupillary light reflex at high irradiances in melanopsin-knockout mice. Science 299: 245–247, 2003. [DOI] [PubMed] [Google Scholar]
- Marc RE, Jones BW, Anderson JR, Kinard K, Marshak DW, Wilson JH, Wensel T, Lucas RJ. Neural reprogramming in retinal degeneration. Invest Ophthalmol Vis Sci 48: 3364–3371, 2007. [DOI] [PMC free article] [PubMed] [Google Scholar]
- Muller LP, Do MT, Yau KW, He S, Baldridge WH. Tracer coupling of intrinsically photosensitive retinal ganglion cells to amacrine cells in the mouse retina. J Comp Neurol 518: 4813–4824, 2010. [DOI] [PMC free article] [PubMed] [Google Scholar]
- Paxinos G, Franklin K. The Mouse Brain in Stereotaxic Coordinates (2nd ed). San Diego, CA: Gulf Professional, 2004. [Google Scholar]
- Peirce JW. Generating stimuli for neuroscience using PsychoPy. Front Neuroinform 2: 10, 2008. [DOI] [PMC free article] [PubMed] [Google Scholar]
- Piscopo DM, El-Danaf RN, Huberman AD, Niell CM. Diverse visual features encoded in mouse lateral geniculate nucleus. J Neurosci 33: 4642–4656, 2013. [DOI] [PMC free article] [PubMed] [Google Scholar]
- Schmidt TM, Alam NM, Chen S, Kofuji P, Li W, Prusky GT, Hattar S. A role for melanopsin in alpha retinal ganglion cells and contrast detection. Neuron 82: 781–788, 2014. [DOI] [PMC free article] [PubMed] [Google Scholar]
- Schmidt TM, Kofuji P. Functional and morphological differences among intrinsically photosensitive retinal ganglion cells. J Neurosci 29: 476–482, 2009. [DOI] [PMC free article] [PubMed] [Google Scholar]
- Schmidt TM, Taniguchi K, Kofuji P. Intrinsic and extrinsic light responses in melanopsin-expressing ganglion cells during mouse development. J Neurophysiol 100: 371–384, 2008. [DOI] [PMC free article] [PubMed] [Google Scholar]
- Schuett S, Bonhoeffer T, Hubener M. Mapping retinotopic structure in mouse visual cortex with optical imaging. J Neurosci 22: 6549–6559, 2002. [DOI] [PMC free article] [PubMed] [Google Scholar]
- Sekaran S, Foster RG, Lucas RJ, Hankins MW. Calcium imaging reveals a network of intrinsically light-sensitive inner-retinal neurons. Curr Biol 13: 1290–1298, 2003. [DOI] [PubMed] [Google Scholar]
- Semo M, Lupi D, Peirson SN, Butler JN, Foster RG. Light-induced c-fos in melanopsin retinal ganglion cells of young and aged rodless/coneless (rd/rd cl) mice. Eur J Neurosci 18: 3007–3017, 2003. [DOI] [PubMed] [Google Scholar]
- Strettoi E, Pignatelli V. Modifications of retinal neurons in a mouse model of retinitis pigmentosa. Proc Natl Acad Sci USA 97: 11020–11025, 2000. [DOI] [PMC free article] [PubMed] [Google Scholar]
- Thyagarajan S, van Wyk M, Lehmann K, Lowel S, Feng GP, Wassle H. Visual function in mice with photoreceptor degeneration and transgenic expression of Channelrhodopsin 2 in ganglion cells. J Neurosci 30: 8745–8758, 2010. [DOI] [PMC free article] [PubMed] [Google Scholar]
- Toychiev AH, Ivanova E, Yee CW, Sagdullaev BT. Block of gap junctions eliminates aberrant activity and restores light responses during retinal degeneration. J Neurosci 33: 13972–13977, 2013. [DOI] [PMC free article] [PubMed] [Google Scholar]
- Vugler AA, Semo M, Joseph A, Jeffery G. Survival and remodeling of melanopsin cells during retinal dystrophy. Vis Neurosci 25: 125–138, 2008. [DOI] [PubMed] [Google Scholar]
- Wong KY, Dunn FA, Graham DM, Berson DM. Synaptic influences on rat ganglion-cell photoreceptors. J Physiol 582: 279–296, 2007. [DOI] [PMC free article] [PubMed] [Google Scholar]
- Zaidi FH, Hull JT, Peirson SN, Wulff K, Aeschbach D, Gooley JJ, Brainard GC, Gregory-Evans K, Rizzo JF, Czeisler CA 3rd, Foster RG, Moseley MJ, Lockley SW. Short-wavelength light sensitivity of circadian, pupillary, and visual awareness in humans lacking an outer retina. Curr Biol 17: 2122–2128, 2007. [DOI] [PMC free article] [PubMed] [Google Scholar]
- Zhao X, Stafford BK, Godin AL, King WM, Wong KY. Photoresponse diversity among the five types of intrinsically photosensitive retinal ganglion cells. J Physiol 592: 1619–1636, 2014. [DOI] [PMC free article] [PubMed] [Google Scholar]