

Abstract
Extremely thermoacidophilic Crenarchaeota belonging to the order Sulfolobales flourish in hot acidic habitats that are strongly oxidizing. The pH extremes of these habitats, however, often exceed the acid tolerance of type species and strains. Here, adaptive laboratory evolution was used over a 3-year period to test whether such organisms harbor additional thermoacidophilic capacity. Three distinct cell lines derived from a single type species were subjected to high-temperature serial passage while culture acidity was gradually increased. A 178-fold increase in thermoacidophily was achieved after 29 increments of shifted culture pH resulting in growth at pH 0.8 and 80°C. These strains were named super-acid-resistant Crenarchaeota (SARC). Mathematical modeling using growth parameters predicted the limits of acid resistance, while genome resequencing and transcriptome resequencing were conducted for insight into mechanisms responsible for the evolved trait. Among the mutations that were detected, a set of eight nonsynonymous changes may explain the heritability of increased acid resistance despite an unexpected lack of transposition. Four multigene components of the SARC transcriptome implicated oxidative stress as a primary challenge accompanying growth at acid extremes. These components included accelerated membrane biogenesis, induction of the mer operon, and an increased capacity for the generation of energy and reductant.
INTRODUCTION
Extremophiles are defined by their unusual traits relative to most microbes by the magnitude of physical or chemical parameters governing their ability to grow. Many but not all extremophiles belong to the domain Archaea. Those native to acidic geothermal environments include members of the phylum Crenarchaeota, and Sulfolobus solfataricus is a commonly used species that expresses the extreme thermoacidophilic biotype. The confluence of superheated groundwater penetrating pyritic mineral deposits creates the niche in which these organisms flourish. These highly oxidative environments result from both abiotic and biotic processes and are typified by high levels of iron and sulfur (1).
While geothermal pool and sediment temperatures do not exceed 100°C, their pH values range widely, from near neutral to pH 0 and below. Curiously, despite over 40 years of research at such locations across many continents, the pH optima of the type species and strains do not correlate with the extremity of the resident low-acid conditions. For example, five strains of S. solfataricus and Sulfolobus acidocaldarius analyzed for pH optima showed variation between strains, and while all strains were able to grow at more neutral pHs (>4.0), none were able to grow below pH 2.0 (2). A second trend associated with the thermoacidophilic biotype is a direct correlation between the temperature optimum and pH optimum: as one decreases, so too does the other. For example, with a 5°C drop in the temperature optimum (Topt), the corresponding pH optimum (pHopt) is reduced 1 unit, such as for Metallosphaera sedula (Topt, 75°C; pHopt 2.0) (3). With another 10°C drop in the temperature optimum, the pH optimum is reduced another 1 unit, such as for Picrophilus torridus (Topt, 60°C; pHopt 1.0) (4). These trends support the idea that extremes of heat resistance preclude extremes of acid resistance, perhaps reflecting the overall extent of oxidation (1). They also suggest that retention of thermoacidophily may depend strongly on continued selection.
Despite the lack of correlation between pH optima and habitat, Sulfolobus species still grow well under relatively acidic conditions ranging from pH 2.5 to 4.0 (pHopt 3.0) (2). While the mechanism of pH homeostasis in all acidophiles is poorly understood, the Sulfolobales maintain a near-neutral cytoplasm (pH 6.5) like neutrophiles but are able to tolerate significantly greater pH gradients (5). General mechanisms that acidophiles employ to prevent proton influx include maintaining chemiosmotic gradients that maintain a positively charged cytoplasm that repels the entry of positively charged protons (6, 7) and using proton pumps to remove excess protons that enter the cell (8). Acid resistance in thermoacidophilic archaea can also be explained by their novel membrane structure. Archaeal membranes contain a variety of diether- and tetraether-linked lipids (9, 10), and these lipids are more impermeable to protons than neutrophile membranes, minimizing proton leakage into the cytoplasm (11–14). Their lipid packing may also change with temperature and possibly pH to control proton permeability (15).
Most studies on acid resistance in neutrophiles have focused on the ability of enteric bacteria to maintain viability after being acid shocked (pH 2.5) for short periods (16–20). One common mechanism of acid resistance in neutrophiles is an amino acid decarboxylase-dependent system where specific amino acids such as glutamate and arginine are protonated and exported, titrating the protons in the cytoplasm. The efflux of the protonated amino acids is coupled to the import of unprotonated amino acids that can be used to titrate more protons (20–22). Because these mechanisms require amino acids, they do not function in minimal media, and neutrophiles like Escherichia coli become much more acid sensitive under these conditions (21, 22). However, S. solfataricus does not contain the amino acid decarboxylases used in this process.
In this work, experimental evolution was employed to explore the limits of extreme thermoacidophily. Unlike the experimental microbial evolution approach that has focused on genetic drift and natural mutation rates under nonselective conditions (23), so-called “adaptive laboratory” evolution (24, 25) was used here to explore the limits of the thermoacidophilic biotype. The phenotype of the resulting super-acid-resistant Crenarchaeota (SARC) supports the hypothesis that this trait, at least in a thermoacidophile, can remanifest with selection.
MATERIALS AND METHODS
Archaeal strains and cultivation.
Sulfolobus solfataricus 98/2 (JCM 30930) (26, 27) and its derivatives PBL2025 (28, 29) and PBL2091 (29) were grown in basal salts medium (30), modified as described previously by Brock et al. (31). Complex medium contained 0.2% (wt/vol) tryptone, and the medium was adjusted to the desired pH by using sulfuric acid. All cultures were incubated at 80°C in glass screw-cap flasks with aeration in orbital baths, as previously described (27, 32, 33). Planktonic growth was monitored by light absorption at a wavelength of 540 nm using a Cary 50 spectrophotometer (Agilent). Cultures were stored as described previously for other thermoacidophiles (34). Cells were cultured in complex medium containing 0.2% (wt/vol) tryptone adjusted to different pH values by using various acids, as indicated, or with the addition of sodium sulfite.
Adaptive evolution.
S. solfataricus cell lines were inoculated into 50-ml flasks with media with pH values ranging from 1.0 to 3.0. Maximum growth rates (μmax) of each strain under each pH condition were calculated by exponential regression of cell density measurements to fit to a first-order rate equation. Mid-exponential-phase cells of S. solfataricus 98/2 strain SULA (26) that were grown at a pH optimum of pH 3.0 were then subcultured into pH 2.5 medium. The initial growth rate at pH 2.5 was calculated, and exponential-phase cells from this culture were passaged back into pH 2.5 medium. The new growth rate at pH 2.5 was determined, and these cells were then passaged into pH 2.0 medium. This process of subculturing cells at slightly lower pHs, with passaging several times under each condition, and then decreasing the pH again was repeated on multiple S. solfataricus cell lines. The cells were passaged under each condition until the growth rate no longer improved with passaging at that pH. At this point, the cells were considered evolved to the new pH value.
Clonality was established repeatedly during the experimental process. When pH 1.5-adapted lineages were obtained, the strains were purified to clonality by using a solid complex medium (pH 3.0) prepared by using Brock salts mixed with 0.6% Phytagel (Sigma) and supplemented with 0.2% (wt/vol) tryptone, followed by incubation at 80°C. Clonal isolates were then rescreened for the phenotype of stronger acid resistance than the wild type by measuring their growth rates at low pH. The growth rates at low pH were also remeasured after passaging of the isolates at pH 3.0 for several cycles to verify that the acid resistance phenotype was stable and heritable rather than a transient response. One of the clonal isolates of pH 1.5-adapted cells, named SULB, was passaged under increasingly acidic conditions through this process. In general, as the pH was decreased, the number of passages under each condition was increased. When the cultures were adapted to pH 1.0, more clonal isolates were purified, and their phenotype was verified. One of the pH 1.0-evolved isolates, named SULC, was then used for subsequent passaging below pH 1.0 to pH 0.8.
Modeling of growth limitation at extreme pH.
The degree of change in thermoacidophily exhibited by the experimentally evolved strains was evaluated by maximum growth rate differences at various pH values. The maximum growth rate was obtained by exponential regression of optical density (OD)-versus-time data. Each regression demonstrated a coefficient of determination (r2) of >0.95. Only growth curves from the cultures considered fully evolved to each pH were used to obtain maximum growth rate data points (intermediate passages were not included). A residual sum of squares was calculated to compare the degrees of fit between experimental growth data and the cardinal pH model (CPM) (35) and three additional models (36–38). The CPM was selected to analyze the maximum growth rate of the SARC and parental strains as a function of pH due to a higher degree of fit. A four-parameter nonlinear regression using Sigma Plot (version 12) determined the three gamma parameters (pHmin, pHmax, and pHopt) and the maximum growth rate at the optimal pH (μopt) according to the equation γpH = μmax/μopt (31), where
| (1) |
Lipid analysis.
Total lipid fractions were extracted, using the Bligh-Dyer method (39), from 2.5 × 10¹⁰ cells of SULA and SULC cultivated at pH 3.0 and SULC cultivated at pH 1.0. The lipid fractions were then separated by thin-layer chromatography (TLC) on silica 60 plates (Millipore), using a 65:25:4 chloroform-methanol-water solvent system. Replicate samples were analyzed after chromatography using various dyes. 8-Anilino-1-naphthalene sulfonic acid (ANSA) (1 mM) was used for detection of total lipids, and alpha-naphthol (15%, wt/vol) was used for detection of glycolipids (40). The ANSA-stained TLC plates were examined under UV light, while the alpha-naphthol-stained plates were examined under visible light.
Measurement of intracellular pH.
Membrane-soluble pH-sensitive fluorescent dyes were used to examine intracellular pH. Cell samples of SULA cultivated at pH 3.0 and SULC cultivated at pH 1.0 were washed and resuspended in pH 3.0 basal salts. 2′,7′-Bis-(2-carboxyethyl)-5 (and -6)-carboxyfluorescein acetoxymethyl ester (BCECF-AM) (Life Technologies) was added to a final concentration of 1 μM, and cells were incubated at 80°C for 1 h (41). The cells were then washed twice and resuspended in pH 3.0 basal salts. The fluorescence emission at 535 nm was measured as a result of excitation at either 490 nm or 440 nm (isobestic point), and the ratios of fluorescence were used to compare the internal pHs between the strains relative to fluorescence using standard curves prepared with pH-adjusted basal salts.
Genome and transcriptome sequencing.
High-molecular-weight genomic DNA was prepared from clonal cultures of the S. solfataricus strains as described previously (34, 42). RNA was prepared, as described previously (32), from wild-type cells grown at pH 3.0, pH 1.5-adapted clonal isolates grown at pH 1.5, and pH 1.0-adapted isolates grown at pH 1.0. Biological replicates were isolated under each of these conditions. The integrity and purity of the DNA and RNA samples were verified by spectroscopic measurements (the ratio of absorbance at 260 nm to absorbance at 280 nm and the ratio of absorbance at 260 nm to absorbance at 230 nm) and confirmed by agarose gel electrophoresis. DNA and RNA library preparation was conducted by using the Joint Genome Institute (JGI) automated process with a BioMek FX robot. rRNA was depleted from the RNA samples by using exonucleases (Epicentre mRNA-only prokaryotic RNA isolation kit) prior to the rest of the process. The samples were sheared by using a Covaris E210 sonicator, followed by end repair and phosphorylation. Fragments ranging from 100 to 500 bp were selected for sequencing using an automated solid-phase reversible immobilization selection system. 3′-terminal adenine was added to the fragments, followed by adaptor sequence ligation. RNA libraries with adaptors added were converted into cDNA libraries by reverse transcription. Genome and transcriptome sequencing of the libraries was done by using an Illumina Hiseq 2000 system, generating paired-end 100-bp reads. Samples were applied to a 25-Gb 2-by-100 channel that gave 1 Gb of sequence information per sample (500× coverage). All of the RNA libraries were ∼25 Gb in size and had 45 million to 75 million non-rRNA reads that mapped to the transcriptome.
Sequences were mapped to the Sulfolobus solfataricus 98/2 strain SULA reference genome (26) (GenBank accession number CP011057) by using BOWTIE2 (version 2.1.0) and SAMTOOLS (version 1.0). Genome sequence information is available in the NCBI database. All mutations in the genome sequence were identified through sequence comparisons, and mutations that were located within open reading frames (ORFs) were analyzed in more detail to determine their codon positions and the effects that they would have on the protein sequence. The coordinates of each mutation were also cross-referenced to locations of the known domains in each protein to verify whether or not any mutations occurred within important functional domains. Transcriptome sequencing (RNA-seq) read depth was evaluated across ORFs to eliminate artifacts and identify antisense transcripts, and counts for each ORF were normalized by using the reads per kilobase per million (RPKM) method (43). Read depth was also normalized to the transcript abundance of the archaeal generalized transcription factor TFB1 because it exhibited an invariant pattern of abundance. This enabled comparisons between different RNA-seq samples, as described previously, using several other methods for mRNA quantitation (29, 32).
Mutant construction.
One of the genes identified as being upregulated in SULC, merI (SULA_0494), was disrupted with lacS in S. solfataricus strain PBL2025 by targeted recombination using plasmid pPB1015, as previously described (29). Recombinant identity was confirmed by PCR and restriction analysis of the wild-type merI allele and the disrupted allele in the recombinant strain. Amplification of the disrupted merI locus in strain PBL2036 produced a single band ∼1.80 kb larger than that observed with the undisrupted locus due to the presence of the inserted copy of lacS.
Accession numbers.
The S. solfataricus strain 98/2 (SULA) genome sequence is available at GenBank under accession number CP011057. The sequences of the evolved derivatives SULB and SULC are available under GenBank accession numbers CP011055 and CP011056. RNA-seq raw data are available in the JGI Genome Portal under JGI Project IDs 1019993 (SULA), 1019996 (SULB), and 1019999 (SULC). Finally, RNA-seq data are also available in the Sequence Read Archive under accession numbers SRX872629 and SRX872630 (SULA), SRX872631 and SRX872632 (SULB), and SRX712375 and SRX712376 (SULC).
RESULTS
Isolation of SARC.
To test the hypothesis that the thermoacidophilic archaeon Sulfolobus solfataricus might harbor the capacity for significantly greater thermoacidophily than currently described, an adaptive laboratory evolution process was employed by using extensive culture passage that extended over a 3-year period. Prior to the initiation of these experiments, growth rates were determined for the parental S. solfataricus cell lines. Wild-type S. solfataricus strain 98/2 (26, 27), strain PBL2025 (28, 29), and strain PBL2091 (29) (here named SULA, SULG, and SULM, respectively) were inoculated after a single passage at pH 3.0 into complex medium with a range of pH values from 3.00 to 1.00 (Fig. 1; see also Fig. S1 and S2 in the supplemental material). All these cell lines were unable to grow below pH 1.60. The cardinal pH model (CPM) (35) predicted a minimum pH of 1.54 for growth of SULA (Fig. 2). Parental strain SULA was then passaged for 130 cell divisions with 29 increments in shifted culture pH that gradually increased the culture acidity from pH 3.0 to pH 0.80. Periodically, clonally purified isolates were recovered and stored for subsequent analysis. The growth rate and cell yield for SULA decreased with increasing acidity; however, both physiological parameters improved upon continued passage, as indicated by bars of decreasing height (Fig. 1). A clonal isolate from the evolved population cultured at pH 1.5 was named SULB. This isolate maintained the ability to grow at pH 1.5 even after passage at a starting pH of 3.0. Strain SULB was used for subsequent passage in media with pH values of <1.5. Cultures that evolved to grow at pH 1.0 were repeatedly passaged and then clonally purified and screened for the ability to grow at low pH values, indicating increased acid resistance relative to the parental cell line. A resulting isolate, named SULC, was derived from SULB. Strain SULC was used for all passaging below pH 1.0 (Fig. 1). Clonal isolates of cultures grown at pHs below 1.0 were also recovered and purified. One isolate recovered at pH 0.8 was named SULD. To determine whether there might be significant variation in the rate and extent of change in evolved physiological parameters, the same experimental process was repeated independently by using two other S. solfataricus strains, SULG and SULM, as the starting cell lines. The overall growth physiology of these strains and their derivatives was similar to that of SULA and its derivatives throughout the process of successive passage (see Fig. S1 and S2 in the supplemental material).
FIG 1.
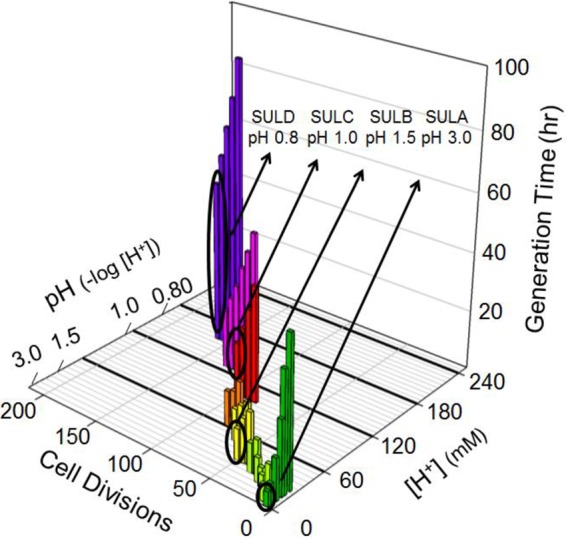
Increasing thermoacidophily by adaptive passage. Bars indicate individual passaged cultures of Sulfolobus solfataricus. Clonal populations adapted for specific pH values are circled (green, SULA; yellow, SULB; red, SULC; blue, SULD). Only SULA, the wild-type parental strain, was pH downshifted without adaptation. The bar height is proportional to the generation time and decreases with increasing passages.
FIG 2.
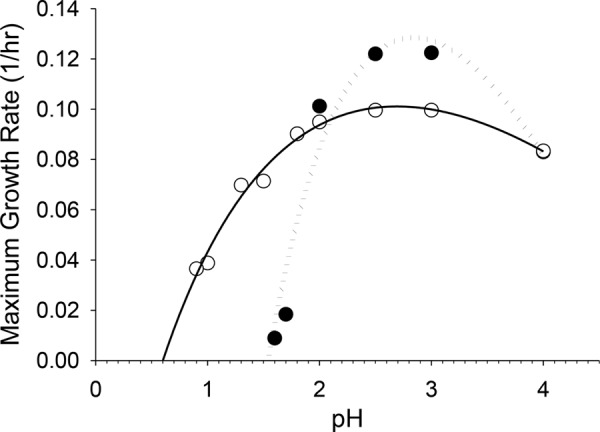
Model of microbial growth during acid adaptation. Shown are experimentally determined maximum growth rates of SULA (closed circles) and SULC (open circles) grown under conditions of decreasing pH by serial passage. Maximum growth rates predicted by the CPM utilizing values listed in Table 1 are shown as lines (dotted line, SULA CPM; solid line, SULC CPM).
Physiology of acid-adapted strains.
The SARC strains have increased resistance to strong-acid conditions relative to their respective parental strains. In addition to increased resistance to sulfuric acid, their response to other acids was examined. A similar pattern of increased resistance was evident using hydrochloric acid, while no change was observed in response to phosphoric or nitric acid. Strain SULD, the most evolved isolate, was able to grow at a 6.32-fold-higher acidity (pH 0.80; 158 mM H2SO4) than the limit for the parental cell line SULA (pH 1.60; 25 mM H2SO4) and at a 158-fold-higher acidity than the SULA optimum (pH 3.0; 1 mM H2SO4). A comparison of the growth rates of SULA and SULD over this range of acidities is shown in Fig. 3.
FIG 3.
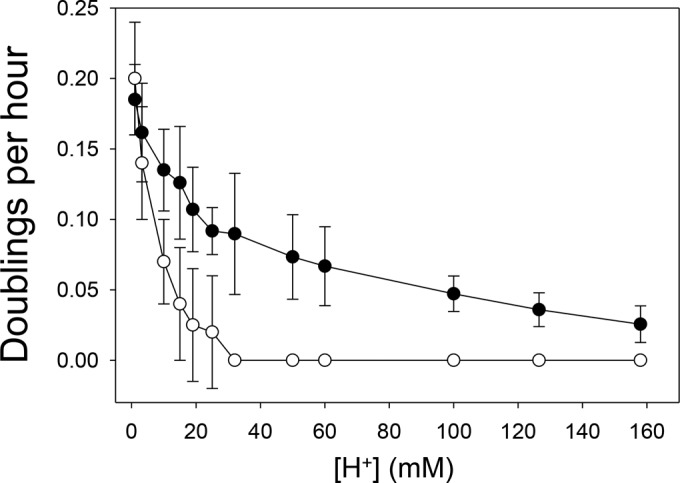
Comparison of SULA and SULD physiologies at low pH. The growth patterns of SULA (open circles) and SULD (closed circles) across a range of acidities from 1 mM (pH 3.0) to 158 mM (pH 0.8) are shown as doublings per hour.
The increased acid resistance of the SARC strains was both constitutive and heritable, and the phenotype was evident even after repeated passage at a more neutral pH (pH 3.0) followed by a downshift to more acidic cultivation conditions. Since increased sulfuric acid resistance was accompanied by a similar pattern for hydrochloric acid, the altered trait also encompassed increased resistance to chloride ions and sulfate ions, respectively. To assess the response to other sulfur ions, the effect of the addition of sulfite (SO32−) was examined. Increased resistance to sulfite (sodium salt) was evident. SULC exhibited a 10-fold increase in the response to this well-known microbicide (44, 45) relative to the parental strain. At pH 3.0, SULC grew in the presence of 1.0 mM sodium sulfite, while the concentration limit for the parental strain SULA was 10-fold lower (0.1 mM sodium sulfite). In the presence of 1.0 mM sodium sulfite, SULC had a 2-fold-longer generation time than that of SULC grown in the same medium without the addition of sodium sulfite, while its growth yield was decreased by 44% (see Fig. S3 in the supplemental material).
Modeling of evolved acid resistance.
The maximum exponential growth rate of SULC was less affected by moderate pH shifts and showed a gradual decrease as acidity was increased compared to the steep drop-off exhibited by the wild-type parental strain SULA (Fig. 1 to 3). However, the growth rate of strain SULC began to decrease more dramatically when the pH was shifted to <1.0. The CPM model predicted that SULC should be able to grow to a minimum pH of 0.60, which is a pH minimum decrease of 0.94 pH units or a 10.04-fold-higher acidity than the minimum for the parental strain SULA and a 251-fold-higher acidity than the optimal pH (Fig. 2). Nonlinear regression to fit parameters to μmax at various obtained pH values was performed (Table 1). The model for growth physiology during experimental passage of SULA and SULC to enhance thermoacidophily fit the experimentally determined growth rates closely, with r2 values of 0.96 and 0.97, respectively. Empirical data demonstrated that SULC could not grow below a pH value of 0.8 and therefore that the modeled value could not be achieved with this evolved cell line.
TABLE 1.
Results of CPM nonlinear regression of maximum growth rates of SULA and SULC
| Parameter | Value for strain |
|
|---|---|---|
| SULA | SULC | |
| pH optimum | 2.84 | 2.61 |
| pH maximum | 4.95 | 6.73 |
| μmax at optimal pH (1/h) | 0.1284 | 0.1010 |
| pH minimum | 1.54 | 0.60 |
| r2 | 0.96 | 0.97 |
Analysis of mutations in evolved strains.
Genome resequencing of the parental strain SULA and its SARC derivatives SULB and SULC was conducted to identify their possible mutational differences (26). A total of 1 Gb of reads (500-fold coverage) was generated for each genome. The S. solfataricus 98/2 strain SULA genome (26) deposited in the NCBI database (GenBank accession number CP011057) was used as the reference for SULB and SULC. The pH 1.5-evolved SULB strain had only three mutations compared to its parent strain SULA (Table 2). Two of these mutations were nonsynonymous mutations in a formate dehydrogenase (SULA_0631) and an amino acid permease (SULA_0993). Additionally, SULB had one synonymous mutation in a hypothetical protein (SULA_0550).
TABLE 2.
Mutations in SARC strain SULCa
| Strain | Coordinate(s) | Change | ORF | Protein | Mutation location(s) | Domain |
|---|---|---|---|---|---|---|
| SULC | 394425 | C→T | SULA_0431 | Phenylacetate-CoA ligase | nt 633/1308 | Phenylacetate-CoA ligase |
| Gln→stop | aa 211/435 | |||||
| SULC | 470619 | G→T | SULA_0515 | Sugar ABC transporter ATP-binding protein | nt 710/945 | ABC-type sugar transport system, ATPase component |
| Met→Ile | aa 237/314 | |||||
| SULB and SULC | 507233 | C→T | SULA_0550 | Hypothetical protein | nt 176/810 | NA (no conserved domains) |
| Synonymous | aa 59/269 | |||||
| SULC | 529755 | A→T | SULA_570 | Hypothetical protein | nt 673/1356 | BAR superfamily |
| Glu→Val | aa 225/451 | |||||
| SULB and SULC | 590768 | C→T | SULA_0631 | Oxidoreductase | nt 556/2940 | 4Fe-4S dicluster domain |
| Gly→Ala | aa 186/979 | |||||
| SULC | 604037–606806 | Transposition event | SULA_0647-SULA_0648 | ABC transporter substrate-binding protein, sugar ABC transporter permease | Periplasmic binding protein type 2 superfamily, transmembrane PBP2 superfamily | |
| SULB and SULC | 962913 | G→A | SULA_0993 | Amino acid permease | nt 256/1341 | Amino acid transporter |
| Thr→Ile | aa 86/446 | |||||
| SULC | 1123466 | C→A | SULA_1179 | NAD-dependent dehydratase | nt 891/936 | NADB Rossmann superfamily |
| Gln→Lys | aa 297/311 | |||||
| SULC | 1235929 | C→A | SULA_1334 | Hypothetical protein | nt 1840/1899 | NA (outside domains) |
| Arg→Leu | aa 614/632 | |||||
| SULC | 1321391 | G→A | Intergenic region | NAb | NAb | NA (no conserved domains) |
| SULC | 1761347 | C→T | SULA_1945 | Glutamyl tRNA amidotransferase | nt 336/1335 | GatD subunit of archaeal Glu-tRNA amidotransferase |
| Synonymous | aa 112/444 | |||||
| SULC | 1847693 | G→A | SULA_2027 | Oxidoreductase | nt 611/1323 | Oxidoreductase q1 superfamily |
| Synonymous | aa 204/440 | |||||
| SULC | 1847144 | C→T | SULA_2027 | Oxidoreductase | nt 1160/1323 | Hydrogenase 4 subunit F |
| Synonymous | aa 387/440 | |||||
| SULC | 1892243 | A→C | SULA_2076 | Amino acid permease | nt 746/1944 | Amino acid permease |
| Arg→Ser | aa 249/647 | |||||
| SULC | 1892577 | T→G | SULA_2076 | Amino acid permease | 1080/1944 nt | Amino acid permease |
| Ser→Ala | 360/647 AA | |||||
| SULC | 1892619 | A→T | SULA_2076 | Amino acid permease | nt 1122/1944 | Amino acid permease |
| Thr→Ser | aa 374/647 | |||||
| SULC | 2569782 | C→T | NA | Pseudogene | nt 296/407 | NA (no conserved domains) |
| SULC | 2691508 | G→A | NA | Pseudogene | nt 903/1202 | NA (no conserved domains) |
aa, amino acid; nt, nucleotide; NA, not applicable; NADB, nicotinamide adenine dinucleotide binding; PBP2, periplasmic binding protein type 2.
Note that these mutations represent only unique changes seen between SARC strain SULC and its parental strain SULA.
The pH 1.0-evolved SULC strain contained a total of 18 mutations relative to the parental strain SULA. This included all three of the mutations seen in SULB whose presence verified the integrity of the experimental process. Since additional mutations were evident in SULC, it was concluded that the SULB mutations were not sufficient to cause the more extreme phenotype exhibited by SULC. The new mutations in SULC included three synonymous mutations, eight nonsynonymous mutations in annotated ORFs, two mutations in pseudogenes, one transposition, and one intergenic mutation (Table 2). Because the intergenic mutation did not map to a regulatory sequence or promoter based on promoter localization predicted by analysis of 5′ untranslated regions (UTRs) flanking transcribed regions derived from analysis of the RNA-seq data, it and the mutations in pseudogenes, and synonymous mutations, were not pursued. The remaining mutations were examined further to determine their importance for the evolved phenotype. One of the genes with a nonsynonymous substitution (SULA_0515) and both of the genes disrupted by the transposition event (SULA_0647 and SULA_0648) were sugar transporters. Since there was no sugar in the SULC growth media, these mutations were unlikely to be related to the acid resistance phenotype. Two of the nonsynonymous substitutions in SULC occurred very close to the 3′ ends of the ORFs (SULA_1179 and SULA_1334), away from annotated functional domains and active sites, and are therefore also unlikely to affect the phenotype. One of the nonsynonymous substitutions resulted in a nonsense mutation in phenylacetate coenzyme A (CoA) ligase (SULA_0431). This enzyme catalyzes the first step in the phenylacetate pathway used to degrade organic aromatic substrates. Disruptions of this gene in other organisms affected only growth on organic substrates such as phenylacetate or sensitivity to organic acids such as phenylacetic acid (46). The remaining nonsynonymous changes were one substitution in a hypothetical protein (SULA_0570) containing a Bin/amphiphysin/Rvs (BAR) domain, which is known to play a role in lipid binding and membrane dynamics (47), and three substitutions in an amino acid permease (SULA_2076). While no single mutation in SULC appeared sufficient to explain the evolved phenotype, it is possible that acting together, several or all of them confer improved fitness at lower pH values.
Because adaptive laboratory evolution has not been applied previously to studies involving archaea, it was of interest to evaluate the mutation rate and spectrum arising during the experimental process. The mutation rates for SULB and SULC were lower than the value of 2.8 × 10⁻⁷ reported previously for S. solfataricus strain P2 (48). SULB had a mutation rate of 2.50 × 10⁻⁸ mutations per cell division, and SULC had a mutation rate of 7.49 × 10⁻⁸ mutations per cell division. In contrast, the number of substitution mutations and insertions/deletions identified between the sequence of SULA (strain 98/2) and the sequence reported under GenBank accession number CP001800.1, excluding the 50-kb deletion (28), was 74. However, the mutation rate for this comparison could not be determined in the absence of passage information for the genome reported under GenBank accession number CP001800.1. During the 85 cell divisions that took place between the isolation of SULB and SULC, the mutation rate increased 3-fold compared to the rate observed between SULA and SULB. This suggested that there was greater selective pressure accompanying the increase in thermoacidophily for SULC than for SULB.
Despite the high number of insertion sequence (IS) elements in the S. solfataricus genome (49), the frequency of transposition in the SARC strains (calculated as the number of transpositions per cell across all passages) was 8 × 10⁻⁹ transpositions per cell. This was 4 to 5 orders of magnitude lower than the values of 10−4 to 10−5 transpositions per cell reported previously (50–52). Consequently, this observation suggests that the endogenous IS elements are less active than previously observed, at least during the imposition of acid selection. However, 30 transposase genes were highly upregulated (>5-fold) in SARC strain SULC grown at pH 1.0 (see Table S1 in the supplemental material). The most upregulated transposases were all members of the same gene families: transposase ISC1217, transposase 1234/ST1916, and the IS1 transposase (26). As it was reported previously that transposase activities in vitro are dependent on pH (53), the possibility that the intracellular pH may have changed in the evolved cell lines was tested, as the pH may have been an inhibitor of transposition. Intracellular pH was measured by using a membrane-permeable pH-dependent fluorescent dye (BCECF-AM) (41). However, comparison of the ratios of fluorescence at 534 nm produced by excitation at 490 nm and 440 nm for the SULA and SULC strains did not show significant differences. This result indicated that at least large changes in internal pH values were not evident in the evolved strains and could not be used to explain the lack of transposition.
Transcriptomics.
RNA-seq analysis with a read depth of 45 million to 75 million non-rRNA reads per transcriptome was conducted to examine changes in gene expression that accompanied the adaptive evolution process. The key pattern that emerged was that growth under more acidic pH conditions precipitated an oxidative stress response. There were 235 ORFs that were up- or downregulated 5-fold or more in SULC relative to the parental strain SULA (see Table S1 in the supplemental material). Eighty-four of these changes were in ORFs for hypothetical proteins and proteins of unknown function, and another 31 were in ORFs annotated as transposases (see Table S1 in the supplemental material). The remaining 117 affected ORFs that had annotated functions were sorted into six major categories, signal transduction (13 ORFs), protein-modifying enzymes such as radical S-adenosyl methionine (SAM) proteins (6 ORFs), transporters (16 ORFs), oxidoreductases (17 ORFs), membrane biogenesis (4 ORFs), and overall metabolism (61 ORFs), particularly those involved in glycolysis and the tricarboxylic acid (TCA) cycle (Fig. 4; see also Table S1 in the supplemental material). The RNA-seq libraries of biological replicates all had Pearson correlation coefficients of >0.98, indicating that the transcriptomic data were reproducible.
FIG 4.
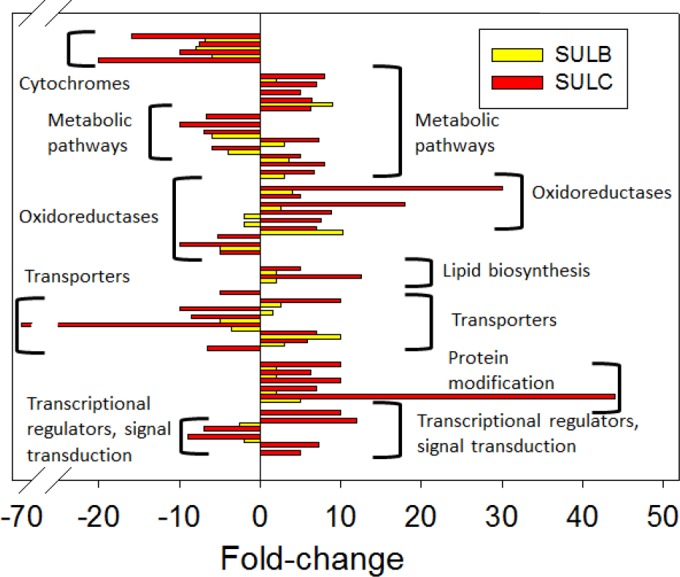
Relative transcriptomic profiles of evolved SARC cell lines. RNA-seq analysis was conducted by using total RNA extracted from exponential-phase cultures. Strains (cultivation pH) used were SULA (pH 3.0), SULB (pH 1.50), and SULC (pH 1.00). Fold changes in abundances of all transcripts for SULB and SULC were normalized to those of SULA. Classes of affected genes are indicated. RNA-seq was conducted by using biological replicates for all RNA samples. Pearson correlation coefficients were >0.98 for all transcriptomes.
Many of the ORFs that had expression level changes of 5-fold or greater in SULC were also altered in expression in the intermediate strain SULB (Fig. 4). This is consistent with the idea that growth at lower pH imposes a common stress evident in the SULB and SULC transcriptomes. In many cases, in SULB, the changes were of a lesser magnitude. Sixty-nine of the 235 ORFs that had differences in expression levels of 5-fold or greater in comparisons of SULC and SULA also showed similar patterns between SULB and its parent strain SULA. Sixty-five ORFs showed an intermediate effect, while four others showed an even greater fold change than the change observed between SULC and SULA. The occurrence of the latter group of regulatory alterations may reflect a transient need for higher expression levels subsequently satisfied by events accompanying additional passage.
In the SULC transcriptome, the signal transduction genes included SULA_2129 and SULA_2591. These are both SirA response regulators, two-component response regulators that control secondary metabolism and have a signature CPxP motif that might be important in mRNA binding (54). In addition, the MerI protein, SULA_0494, which contains a CBS domain implicated in ionic sensing (55) and energy status sensing (56), was also upregulated in SULC along with the entire mercury resistance operon (mer), which encodes MerH (mercury chaperone) and MerA (mercuric reductase) (28, 29, 57). Induction of the mer operon suggests that growth at lower pH is an oxidative stress, as recent studies demonstrated that the MerR transcription factor also controls the expression of MarR, an oxidative stress regulator (58). Three AbrB family transcriptional regulators were also affected, SULA_0734, SULA_1070, and SULA_1531. In bacterial firmicutes, AbrB regulates the transcription of genes expressed during the transition state between vegetative growth and the onset of stationary phase and sporulation (59, 60). While AbrB homologs have been reported in Sulfolobus and its viruses (61, 62), their functional roles are unclear.
The second indicator of oxidative stress consisted of genes coding for proteins within the membrane lipid biogenesis and degradation cycle that were upregulated >5-fold (Fig. 5, green boxes, and Table 3). These proteins may be upregulated to promote membrane repair resulting from the increased exposure to hot acid causing oxidative damage and accelerated membrane turnover. As the membrane lipid composition of acidophiles is known to play a role in acid resistance, an attempt was made to compare general patterns of lipid composition by using thin-layer chromatography of total lipid extracts from SULA and SULC. The resulting major lipid classes separated by head group were characterized by using lipid-specific dyes; however, no significant differences were evident in comparisons of total lipids and glycolipids (see Fig. S4 in the supplemental material).
FIG 5.
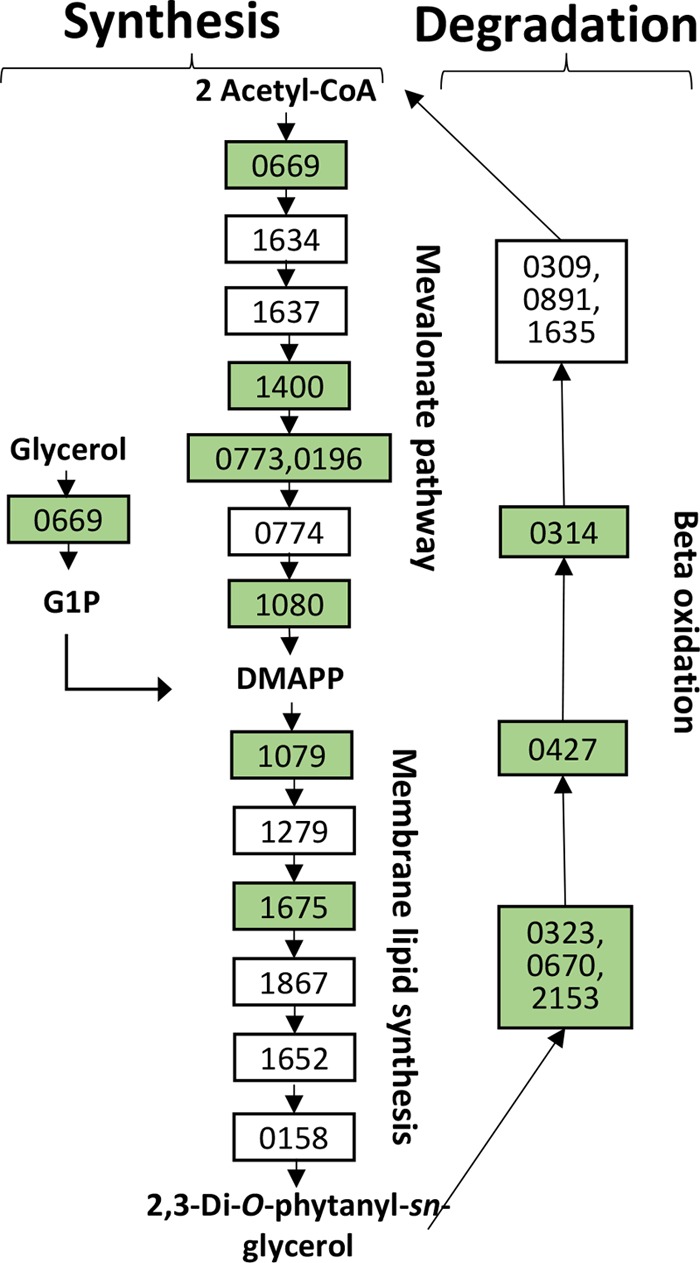
Membrane lipid synthesis pathway in S. solfataricus. Boxes are labeled with the enzyme ORF that they represent. Green boxes indicate genes that are upregulated in SARC. DMAPP, dimethylallyl diphosphate; G1P, glycerol-1-phosphate; DHAP, dihydroxyacetone phosphate. Gene names are indicated in Table 3.
TABLE 3.
Upregulated membrane synthesis genes in SULCa
| ORF(s) | Product |
|---|---|
| SULC_0669 | Acetoacetyl-CoA transferase |
| SULC_1400 | Mevalonate kinase |
| SULC_0773 and SULC_0196 | Phosphomevalonate kinase |
| SULC_1080 | Isopentyl-PP isomerase |
| SULC_1079 | Geranylgeranyl diphosphate synthase |
| SULC_1675 | Geranylgeranylglycerol-phosphate geranylgeranyl transferase |
| SULC_0323, SULC_0670, and SULC_2153 | Acyl-CoA dehydrogenase |
| SULC_0427 | Enoyl-CoA hydratase |
| SULC_0314 | 3-Hydroxyacyl-CoA dehydrogenase |
The full list of genes in the membrane synthesis pathway can be found in Table S2 in the supplemental material. PP, pyrophosphate.
A third indicator of oxidative stress consisted of genes coding for the TCA cycle and glycolytic enzymes that were upregulated 2-fold or more. Their upregulation could be an indicator of increased energy generation required to efflux excess protons from the cytoplasm. This included genes for pyruvate ferredoxin/flavodoxin oxidoreductase (SULA_2869, SULA_2870, and SULA_2871), citrate synthase (SULA_0393), 2-oxoacid:ferredoxin oxidoreductase (SULA_0623 and SULA_0624), succinyl-CoA synthase (SULA_0284 and SULA_0285), and malate dehydrogenase (SULA_0389). Of the glycolytic pathway, only gluconate dehydratase (SULA_0968) and KDG (2-keto-3-deoxygluconate) aldolase (SULA_0967) were upregulated >2-fold. An additional pattern consistent with oxidative stress was that 8 of 17 oxidoreductase genes with moderately induced expression (see below) were alcohol dehydrogenases. S. solfataricus harbors a large number of primary and secondary alcohol dehydrogenases whose phylogenetic relationships have been examined (63). Increased levels of these enzymes could promote the production of reduced pyridine nucleotides as a response to increased oxidation.
Three radical SAM proteins were also upregulated (SULA_0674, SULA_1500, and SULA_2656), as was the radical SAM enzyme PqqE (SULA_2655). Radical SAM proteins are responsible for diverse reactions often involving posttranslational modifications such as methylation of RNA, small molecules, and proteins (64, 65). Finally, the affected transporters included two amino acid permeases (SULA_0962 and SULA_2170) and two sugar ABC transporter permeases (SULA_0648 and SULA_0649). Several other ABC transporters and MFS transporters were also affected, including homologs of the EmrB/QacA subfamily of drug resistance transporters (SULA_0517 and SULA_2161). These are associated with proton-motive-force-driven antiport (66). In other organisms, the efficiency of this family of transporters has been shown to be affected by changes in external pH, with transport improving as the pH is decreased (67). Altered expression of these proteins may promote increased proton efflux by ion exchange.
In addition to the transcriptomic changes of 5-fold or greater described above, there were 326 ORFs that showed smaller yet significant changes in expression levels ranging from 2- to 5-fold (see Table S1 in the supplemental material). Seventeen of these changes were in ORFs involved in signal transduction, 5 were in protein-modifying enzymes, 43 were in transporters, 17 were in oxidoreductases, and 2 were in membrane biogenesis proteins. The remaining changes involved ORFs associated with overall cell metabolism and DNA binding as well as hypothetical proteins and transposases. Many of these categories had duplicate ORFs and ORFs with similar functions that showed similar expression patterns: multiple copies of CopG transcriptional regulators were downregulated, while multiple copies of TrmB family transcriptional regulators were upregulated. Similar to the large RNA-seq changes, multiple ORFs involved in protein methylation were upregulated, in addition to ORFs involved in histone deacetylation.
Physiology of a merI mutant.
The induction of the mer operon genes suggested that growth at lower pH was an oxidative stress. Therefore, the role of merI in the SARC phenotype was examined further. Of the three classes of signaling genes altered in the SULC transcriptome, including SirA, the CBS domain, and AbrB, only the CBS domain encoded by merI occurred in a genome environment where genetic manipulation was unlikely to cause flanking genetic disturbances arising from alterations of polycistrons and divergent transcription units. Because the SARC strains were derived from SULA, the wild-type strain of S. solfataricus, genetic markers that are available could not be used to manipulate the merI gene. Therefore, gene inactivation studies were conducted with an otherwise wild-type derivative, PBL2025, that supported genetic analysis (28). A gene disruption mutant of merI, PBL2036, was cultured in media with pH values ranging from pH 3.0 to pH 1.3. Its growth was monitored under each pH condition, and the resulting generation times were calculated and compared to those for the growth of the wild type (SULA). The merI mutant, however, showed no phenotypic difference in acid resistance from SULA (see Fig. S5 in the supplemental material).
DISCUSSION
The SARC phenotype of extreme thermoacidophily is unique and not present in reported type strains belonging to the order Sulfolobales. Because the natural habitats occupied by thermoacidophilic archaea often exhibit greater extremes of acidity and temperature, the capacity of the SARC lineages to achieve increased thermoacidophily indicates that this trait was retained in a cryptic state. During the adaptive process, the mutation rate increased in concert with elevated acidity at rates normalized to cell division that were consistent with those reported in previous studies. Surprisingly, however, the mutation spectrum was distinct because of the near absence of transposition. While no single mutation in SULC appeared sufficient to explain the evolved phenotype, it is possible that acting together, several or all of these mutations conferred improved fitness at lower pH values. Reconstruction of these mutations in a clean genetic background would be required to test this idea. Repairing them in the original SARC background cannot be done due to the incompatibility of these cell lines with current genetic markers (28, 29, 34).
SARC strain SULC was observed to have a transposition frequency several orders of magnitude lower than the reported values for this microbial species (50–52), despite showing increased expression levels of 30 transposases relative to the wild type. This discrepancy between transposase expression and transposition frequency could not be explained by a change in the internal pH, and it is unclear why the rate of transposition in this strain is decreased while many of its transposases show increased expression. One possibility is that the majority of transposition events are counterselected because they decrease fitness at low pH.
Evaluation of the SARC transcriptome strongly suggests that growth at low pH is accompanied by oxidative stress. This finding is consistent with the natural habitat of these organisms (1). Four major components of the SARC transcriptome support this conclusion: accelerated membrane biogenesis, mer operon induction, increased expression of TCA cycle genes, and increased expression of the alcohol dehydrogenase superfamily. Externally exposed features such as the membrane and its integral proteins are most affected by acidity. Therefore, membrane oxidation resulting from hot-acid damage is likely to be a primary contributing factor for the phenotype of increased acid resistance, and increased turnover of membrane lipids represents a predicted response for evolved thermoacidophily. For example, acid is known to degrade sugars via dehydration. The sugar head groups of SARC membrane lipids are exposed to an environment that is 100-fold more acidic than that of the parental type strain and might be degraded accordingly. To accommodate such conditions, increased membrane lipid cycling might be necessary. Increased turnover and recycling of specific lipids as a response to oxidative stress have been seen in other organisms (68). In the SARC cell lines, induction of these genes is predicted to increase the rate of membrane turnover as a way to replace lipids that have been damaged by exposure to external acidity without altering the overall structure of the membrane lipids. Accelerated lipid turnover, however, was not accompanied by significant changes in the major lipid classes in comparisons of total lipids, phospholipids, and glycolipids.
The upregulation of the merHAI mercury resistance operon was a second indicator of oxidative stress during growth at low pH. This interpretation is consistent with data from a recent report showing that the transcription factor MerR, which responds to the metal mercury, coregulates the expression of MarR, a second transcription factor which controls the response to oxidative stress (58). Because mercury titrates sulfhydryls, as do many oxidants, a coregulatory response should enhance the response to oxidation (in this case increased acid) and promote fitness.
Two additional transcriptomic patterns indicating that growth at lower pH precipitated oxidative stress included enhanced expression of the alcohol dehydrogenase superfamily (63) and of key genes in the TCA cycle. In other organisms, alcohol dehydrogenases are involved in responding to oxidative stress (69), to which strong-acid conditions contribute. The large number of alcohol dehydrogenase proteins that were upregulated in SULC could be a response to the great oxidative stress to which the SARC cell lines were exposed during cultivation at low pHs. Increased TCA cycle activity would enhance energy production, providing larger amounts of ATP to support proton extrusion from the cytoplasm and thereby retain pH homeostasis.
In addition to those genes associated with oxidative stress, the SARC transcriptome includes other genes with strongly altered expression. It is therefore important to note that previous studies have shown similar genome-wide changes in gene expression levels (hundreds of ORFs differentially regulated) in several thermoacidophilic archaea (70–72), including S. solfataricus (73) grown under heat shock conditions, and in multiple bacterial species grown under acid stress conditions (74, 75).
Many mathematical models have described the effect of pH on microbial growth (35–37). In this study, the cardinal pH model (CPM) was used to predict growth-limiting conditions for extreme acidophily by extrapolation from known data. The CPM avoided overparameterization by not including nonbiological parameters; assumed a constant temperature; and required optimal-, minimum-, and maximum-pH growth conditions (35). The CPM has been modified by other groups to achieve a high degree of fit to experimental observations in studies involving growth characteristics of microorganisms under various conditions (76, 77). Here, a high degree of fit could be shown between the CPM and experimentally determined growth rates for the SARC cell lines and approximate a limit for further evolutionary adaptation in the absence of induced mutagenesis. Transcriptomic analysis implicated complex changes in expression involving environmental sensing, transporters, and membrane turnover as being integral to the strong-acid-resistant traits of these cell lines. In light of these findings, the additional use of adaptive laboratory evolution in archaea could provide a useful approach to investigate mechanisms associated with life under extreme conditions.
Supplementary Material
Funding Statement
This work was supported by National Science Foundation grant MCB 1517408, the Nebraska Center for Energy Science Research, the UNL Cell Development Facility, and the Department of Energy Joint Genome Institute (DOE-JGI) under the community sequencing program (CSP Proposal 1218, projects 1019966, 1019969, and 1019972). The work conducted by the DOE-JGI, a DOE Office of Science User Facility, was supported by the Office of Science of the U.S. Department of Energy under contract no. DE-AC02-05CH11231.
Footnotes
Supplemental material for this article may be found at http://dx.doi.org/10.1128/AEM.03225-15.
REFERENCES
- 1.Maezato Y, Blum P. 2012. Survival of the fittest: overcoming oxidative stress at the extremes of acid, heat and metal. Life (Basel) 2:229–242. doi: 10.3390/life2030229. [DOI] [PMC free article] [PubMed] [Google Scholar]
- 2.Grogan DW. 1989. Phenotypic characterization of the archaebacterial genus Sulfolobus: comparison of five wild-type strains. J Bacteriol 171:6710–6719. [DOI] [PMC free article] [PubMed] [Google Scholar]
- 3.Huber G, Spinnler C, Gambacorta A, Stetter KO. 1989. Metallosphaera sedula gen. and sp. nov. represents a new genus of aerobic, metal-mobilizing, thermoacidophilic archaebacteria. Syst Appl Microbiol 12:38–47. doi: 10.1016/S0723-2020(89)80038-4. [DOI] [Google Scholar]
- 4.Thurmer A, Voigt B, Angelov A, Albrecht D, Hecker M, Liebl W. 2011. Proteomic analysis of the extremely thermoacidophilic archaeon Picrophilus torridus at pH and temperature values close to its growth limit. Proteomics 11:4559–4568. doi: 10.1002/pmic.201000829. [DOI] [PubMed] [Google Scholar]
- 5.Moll R, Schafer G. 1988. Chemiosmotic H+ cycling across the plasma membrane of the thermoacidophilic archaebacterium Sulfolobus acidocaldarius. FEBS Lett 232:359–363. doi: 10.1016/0014-5793(88)80769-5. [DOI] [Google Scholar]
- 6.Hsung JC, Haug A. 1977. Membrane potential of Thermoplasma acidophila. FEBS Lett 73:47–50. doi: 10.1016/0014-5793(77)80012-4. [DOI] [PubMed] [Google Scholar]
- 7.Alexander B, Leach S, Ingledew WJ. 1987. The relationship between chemiosmotic parameters and sensitivity to anions and organic acids in the acidophile Thiobacillus ferrooxidans. J Gen Microbiol 133:1171–1179. [Google Scholar]
- 8.Baker-Austin C, Dopson M. 2007. Life in acid: pH homeostasis in acidophiles. Trends Microbiol 15:165–171. doi: 10.1016/j.tim.2007.02.005. [DOI] [PubMed] [Google Scholar]
- 9.Gulik A, Luzzati V, Rosa MD, Gambacorta A. 1985. Structure and polymorphism of bipolar isopranyl ether lipids from archaebacteria. J Mol Biol 182:131–149. doi: 10.1016/0022-2836(85)90032-4. [DOI] [PubMed] [Google Scholar]
- 10.Chong PL, Ayesa U, Daswani VP, Hur EC. 2012. On physical properties of tetraether lipid membranes: effects of cyclopentane rings. Archaea 2012:138439. doi: 10.1155/2012/138439. [DOI] [PMC free article] [PubMed] [Google Scholar]
- 11.Koga Y. 2012. Thermal adaptation of the archaeal and bacterial lipid membranes. Archaea 2012:789652. doi: 10.1155/2012/789652. [DOI] [PMC free article] [PubMed] [Google Scholar]
- 12.Komatsu H, Chong P. 1998. Low permeability of liposomal membranes composed of bipolar tetraether lipids from thermoacidiphilic archaeabacterium Sulfolobus acidocaldarius. Biochemistry 37:107–115. doi: 10.1021/bi972163e. [DOI] [PubMed] [Google Scholar]
- 13.Konings W, Albers SV, Koning S, Driessen AJM. 2002. The cell membrane plays a crucial role in survival of bacteria and archaea in extreme environments. Antonie Van Leeuwenhoek 81:61–72. doi: 10.1023/A:1020573408652. [DOI] [PubMed] [Google Scholar]
- 14.Shimada H, Nemoto N, Shida Y, Oshima T, Yamagishi A. 2002. Complete polar lipid composition of Thermoplasma acidophilum HO-62 determined by high-performance liquid chromatography with evaporative light-scattering detection. J Bacteriol 184:556–563. doi: 10.1128/JB.184.2.556-563.2002. [DOI] [PMC free article] [PubMed] [Google Scholar]
- 15.Gabriel JL, Chong PL. 2000. Molecular modeling of archaebacterial bipolar tetraether lipid membranes. Chem Phys Lipids 105:193–200. doi: 10.1016/S0009-3084(00)00126-2. [DOI] [PubMed] [Google Scholar]
- 16.Gorden J, Small PLC. 1993. Acid resistance in enteric bacteria. Infect Immun 61:364–367. [DOI] [PMC free article] [PubMed] [Google Scholar]
- 17.Hughes BS, Cullum AJ, Bennett AF. 2006. Evolutionary adaptation to environmental pH in experimental lineages of Escherichia coli. Evolution 61:1725–1734. [DOI] [PubMed] [Google Scholar]
- 18.Lin J, Smith MP, Chapin KC, Baik HS, Bennet GN, Foster JW. 1996. Mechanisms of acid resistance in enterohemorrhagic Escherichia coli. Appl Environ Microbiol 62:3094–3100. [DOI] [PMC free article] [PubMed] [Google Scholar]
- 19.Bodmer T, Miltner E, Bermudez LE. 1999. Mycobacterium avium resists exposure to the acidic conditions of the stomach. FEMS Microbiol Lett 18:45–49. [DOI] [PubMed] [Google Scholar]
- 20.Foster JW. 2004. Escherichia coli acid resistance: tales of an amateur acidophile. Nat Rev Microbiol 2:898–907. doi: 10.1038/nrmicro1021. [DOI] [PubMed] [Google Scholar]
- 21.Zhao B, Houry WA. 2010. Acid stress response in enteropathogenic gammaproteobacteria: an aptitude for survival. Biochem Cell Biol 88:301–314. doi: 10.1139/O09-182. [DOI] [PubMed] [Google Scholar]
- 22.Hersh BM, Farooq FT, Barstad DN, Blankenhorn DL, Slonczewski JL. 1996. A glutamate-dependent acid resistance gene in Escherichia coli. J Bacteriol 178:3978–3981. [DOI] [PMC free article] [PubMed] [Google Scholar]
- 23.Hindre T, Knibbe C, Beslon G, Schneider D. 2012. New insights into bacterial adaptation through in vivo and in silico experimental evolution. Nat Rev Microbiol 10:352–365. doi: 10.1038/nrmicro2750. [DOI] [PubMed] [Google Scholar]
- 24.Bennett AF, Hughes BS. 2009. Microbial experimental evolution. Am J Physiol Regul Integr Comp Physiol 297:R17–R25. doi: 10.1152/ajpregu.90562.2008. [DOI] [PubMed] [Google Scholar]
- 25.Dragosits M, Mattanovich D. 2013. Adaptive laboratory evolution—principles and applications for biotechnology. Microb Cell Fact 12:64. doi: 10.1186/1475-2859-12-64. [DOI] [PMC free article] [PubMed] [Google Scholar]
- 26.McCarthy S, Gradnigo J, Johnson T, Payne S, Lipzen A, Martin J, Schackwitz W, Moriyama E, Blum P. 2015. Complete genome sequence of Sulfolobus solfataricus strain 98/2 and evolved derivatives. Genome Announc 3(3):e00549-15. doi: 10.1128/genomeA.00549-15. [DOI] [PMC free article] [PubMed] [Google Scholar]
- 27.Rolfsmeier M, Blum P. 1995. Purification and characterization of a maltase from the extremely thermophilic crenarchaeote Sulfolobus solfataricus. J Bacteriol 177:482–485. [DOI] [PMC free article] [PubMed] [Google Scholar]
- 28.Schelert J, Dixit V, Hoang V, Simbahan J, Drozda M, Blum P. 2004. Occurrence and characterization of mercury resistance in the hyperthermophilic archaeon Sulfolobus solfataricus by use of gene disruption. J Bacteriol 186:427–437. doi: 10.1128/JB.186.2.427-437.2004. [DOI] [PMC free article] [PubMed] [Google Scholar]
- 29.Schelert J, Drozda M, Dixit V, Dillman A, Blum P. 2006. Regulation of mercury resistance in the crenarchaeote Sulfolobus solfataricus. J Bacteriol 188:7141–7150. doi: 10.1128/JB.00558-06. [DOI] [PMC free article] [PubMed] [Google Scholar]
- 30.Allen MB. 1959. Studies with Cyanidium caldarium, an anomalously pigmented chlorophyte. Arch Mikrobiol 32:270–277. doi: 10.1007/BF00409348. [DOI] [PubMed] [Google Scholar]
- 31.Brock TD, Brock KM, Belly RT, Weiss RL. 1972. Sulfolobus: a new genus of sulfur-oxidizing bacteria living at low pH and high temperature. Arch Mikrobiol 84:54–68. doi: 10.1007/BF00408082. [DOI] [PubMed] [Google Scholar]
- 32.Bini E, Dikshit V, Dirksen K, Drozda M, Blum P. 2002. Stability of mRNA in the hyperthermophilic archaeon Sulfolobus solfataricus. RNA 8:1129–1136. doi: 10.1017/S1355838202021052. [DOI] [PMC free article] [PubMed] [Google Scholar]
- 33.Worthington P, Blum P, Perez-Pomares F, Elthon T. 2003. Large-scale cultivation of acidophilic hyperthermophiles for recovery of secreted proteins. Appl Environ Microbiol 69:252–257. doi: 10.1128/AEM.69.1.252-257.2003. [DOI] [PMC free article] [PubMed] [Google Scholar]
- 34.Maezato Y, Dana K, Blum P. 2011. Engineering thermoacidophilic archaea using linear DNA recombination. Methods Mol Biol 765:435–445. doi: 10.1007/978-1-61779-197-0_26. [DOI] [PubMed] [Google Scholar]
- 35.Rosso L, Lobry J, Bajard J, Flandrois J. 1995. Convenient model to describe the combined effects of temperature and pH on microbial growth. Appl Environ Microbiol 61:610–616. [DOI] [PMC free article] [PubMed] [Google Scholar]
- 36.Presser K, Ratkowsky D, Ross T. 1997. Modelling the growth rate of Escherichia coli as function of pH and lactic acid concentration. Appl Environ Microbiol 63:2355–2360. [DOI] [PMC free article] [PubMed] [Google Scholar]
- 37.Tienungoon S, Ratkowsky D, McMeekin T, Ross T. 2000. Growth limits of Listeria monocytogenes as a function of temperature, pH, NaCl and lactic acid. Appl Environ Microbiol 66:4979–4987. doi: 10.1128/AEM.66.11.4979-4987.2000. [DOI] [PMC free article] [PubMed] [Google Scholar]
- 38.Zwietering MH, Wijtzes T, De Wit JC, Van't Riet K. 1992. A decision support system for prediction of microbial spoilage in foods. J Food Prot 55:973–979. [DOI] [PubMed] [Google Scholar]
- 39.Bligh EG, Dyer WJ. 1959. A rapid method of total lipid extraction and purification. Can J Biochem Physiol 37:911–917. doi: 10.1139/o59-099. [DOI] [PubMed] [Google Scholar]
- 40.Nishihara M, Koga Y. 1987. Extraction and composition of polar lipids from the archaebacterium, Methanobacterium thermoautotrophicum: effective extraction of tetraether lipids by an acidified solvent. J Biochem 101:997–1005. [DOI] [PubMed] [Google Scholar]
- 41.Paradiso AM, Tsien RY, Machen TE. 1984. Na+-H+ exchange in gastric glands as measured with a cytoplasmic-trapped, fluorescent pH indicator. Proc Natl Acad Sci U S A 81:7436–7440. doi: 10.1073/pnas.81.23.7436. [DOI] [PMC free article] [PubMed] [Google Scholar]
- 42.Auernik KS, Maezato Y, Blum PH, Kelly RM. 2008. The genome sequence of the metal-mobilizing, extremely thermoacidophilic archaeon Metallosphaera sedula provides insights into bioleaching-associated metabolism. Appl Environ Microbiol 74:682–692. doi: 10.1128/AEM.02019-07. [DOI] [PMC free article] [PubMed] [Google Scholar]
- 43.Mortazavi A, Williams BA, McCue K, Schaeffer L, Wold B. 2008. Mapping and quantifying mammalian transcriptomes by RNA-Seq. Nat Methods 5:621–628. doi: 10.1038/nmeth.1226. [DOI] [PubMed] [Google Scholar]
- 44.Babich H, Stotzky G. 1978. Influence of pH on inhibition of bacteria, fungi, and coliphages by bisulfite and sulfite. Environ Res 15:405–417. doi: 10.1016/0013-9351(78)90121-4. [DOI] [PubMed] [Google Scholar]
- 45.Ogasawara A, Iono Y, Sato K, Nakajima Y, Bessho S, Watanabe T, Mikami T, Matsumoto T. 2008. Anti-candida activity of sodium sulfite. Biol Pharm Bull 31:1101–1103. doi: 10.1248/bpb.31.1101. [DOI] [PubMed] [Google Scholar]
- 46.Lamas-Maceiras M, Vaca I, Rodriguez E, Casqueiro J, Martin JF. 2006. Amplification and disruption of the phenylacetyl-CoA ligase gene of Penicillium chrysogenum encoding an aryl-capping enzyme that supplies phenylacetic acid to the isopenicillin N-acyltransferase. Biochem J 395:147–155. doi: 10.1042/BJ20051599. [DOI] [PMC free article] [PubMed] [Google Scholar]
- 47.Ren G, Vajjhala P, Lee JS, Winsor B, Munn AL. 2006. The BAR domain proteins: molding membranes in fission, fusion, and phagy. Microbiol Mol Biol Rev 70:37–120. doi: 10.1128/MMBR.70.1.37-120.2006. [DOI] [PMC free article] [PubMed] [Google Scholar]
- 48.Jacobs KL, Grogan DW. 1997. Rates of spontaneous mutation in an archaeon from geothermal environments. J Bacteriol 179:3298–3303. [DOI] [PMC free article] [PubMed] [Google Scholar]
- 49.She Q, Singh RK, Confalonieri F, Zivanovic Y, Allard G, Awayez MJ, Chan-Weiher CC, Clausen IG, Curtis BA, De Moors A, Erauso G, Fletcher C, Gordon PM, Heikamp-de Jong I, Jeffries AC, Kozera CJ, Medina N, Peng X, Thi-Ngoc HP, Redder P, Schenk ME, Theriault C, Tolstrup N, Charlebois RL, Doolittle WF, Duguet M, Gaasterland T, Garrett RA, Ragan MA, Sensen CW, Van der Oost J. 2001. The complete genome of the crenarchaeon Sulfolobus solfataricus P2. Proc Natl Acad Sci U S A 98:7835–7840. doi: 10.1073/pnas.141222098. [DOI] [PMC free article] [PubMed] [Google Scholar]
- 50.Redder P, Garrett RA. 2006. Mutations and rearrangements in the genome of Sulfolobus solfataricus P2. J Bacteriol 188:4198–4206. doi: 10.1128/JB.00061-06. [DOI] [PMC free article] [PubMed] [Google Scholar]
- 51.Schleper C, Roder R, Singer T, Zillig W. 1994. An insertion element of the extremely thermophilic archaeon Sulfolobus solfataricus transposes into the endogenous beta-galactosidase gene. Mol Gen Genet 243:91–96. doi: 10.1007/BF00283880. [DOI] [PubMed] [Google Scholar]
- 52.Martusewitsch E, Sensen CW, Schleper C. 2000. High spontaneous mutation rate in the hyperthermophilic archaeon Sulfolobus solfataricus is mediated by transposable elements. J Bacteriol 182:2574–2581. doi: 10.1128/JB.182.9.2574-2581.2000. [DOI] [PMC free article] [PubMed] [Google Scholar]
- 53.Chalmers RM, Kleckner N. 1994. Tn10/IS10 transposase purification, activation, and in vitro reaction. J Biol Chem 269:8029–8035. [PubMed] [Google Scholar]
- 54.Katoh E, Hatta T, Shindo H, Ishii Y, Yamada H, Mizuno T, Yamazaki T. 2000. High precision NMR structure of YhhP, a novel Escherichia coli protein implicated in cell division. J Mol Biol 304:219–229. doi: 10.1006/jmbi.2000.4170. [DOI] [PubMed] [Google Scholar]
- 55.Biemans-Oldehinkel E, Mahmood NA, Poolman B. 2006. A sensor for intracellular ionic strength. Proc Natl Acad Sci U S A 103:10624–10629. doi: 10.1073/pnas.0603871103. [DOI] [PMC free article] [PubMed] [Google Scholar]
- 56.Baykov AA, Tuominen HK, Lahti R. 2011. The CBS domain: a protein module with an emerging prominent role in regulation. ACS Chem Biol 6:1156–1163. doi: 10.1021/cb200231c. [DOI] [PubMed] [Google Scholar]
- 57.Schelert J, Rudrappa D, Johnson T, Blum P. 2013. Role of MerH in mercury resistance in the archaeon Sulfolobus solfataricus. Microbiology 159:1198–1208. doi: 10.1099/mic.0.065854-0 [DOI] [PMC free article] [PubMed] [Google Scholar]
- 58.Rudrappa D, Yao AI, White D, Pavlik BJ, Singh R, Facciotti MT, Blum P. 25 September 2015. Identification of an archaeal mercury regulon by chromatin immunoprecipitation. Microbiology. doi: 10.1099/mic.0.000189. [DOI] [PubMed] [Google Scholar]
- 59.Robertson JB, Gocht M, Marahiel MA, Zuber P. 1989. AbrB, a regulator of gene expression in Bacillus, interacts with the transcription initiation regions of a sporulation gene and an antibiotic biosynthesis gene. Proc Natl Acad Sci U S A 86:8457–8461. doi: 10.1073/pnas.86.21.8457. [DOI] [PMC free article] [PubMed] [Google Scholar]
- 60.Strauch MA, Spiegelman GB, Perego M, Johnson WC, Burbulys D, Hoch JA. 1989. The transition state transcription regulator AbrB of Bacillus subtilis is a DNA binding protein. EMBO J 8:1615–1621. [DOI] [PMC free article] [PubMed] [Google Scholar]
- 61.Hsu CH, Wang AH. 2011. The DNA-recognition fold of Sso7c4 suggests a new member of SpoVT-AbrB superfamily from archaea. Nucleic Acids Res 39:6764–6774. doi: 10.1093/nar/gkr283. [DOI] [PMC free article] [PubMed] [Google Scholar]
- 62.Contursi P, D'Ambrosio K, Pirone L, Pedone E, Aucelli T, She Q, De Simone G, Bartolucci S. 2011. C68 from the Sulfolobus islandicus plasmid-virus pSSVx is a novel member of the AbrB-like transcription factor family. Biochem J 435:157–166. doi: 10.1042/BJ20101334. [DOI] [PubMed] [Google Scholar]
- 63.Friest JA, Maezato Y, Broussy S, Blum P, Berkowitz DB. 2010. Use of a robust dehydrogenase from an archael hyperthermophile in asymmetric catalysis—dynamic reductive kinetic resolution entry into (S)-profens. J Am Chem Soc 132:5930–5931. doi: 10.1021/ja910778p. [DOI] [PMC free article] [PubMed] [Google Scholar]
- 64.Sofia HJ, Chen G, Hetzler BG, Reyes-Spindola JF, Miller NE. 2001. Radical SAM, a novel protein superfamily linking unresolved steps in familiar biosynthetic pathways with radical mechanisms: functional characterization using new analysis and information visualization methods. Nucleic Acids Res 29:1097–1106. doi: 10.1093/nar/29.5.1097. [DOI] [PMC free article] [PubMed] [Google Scholar]
- 65.Zhang Q, van der Donk WA, Liu W. 2012. Radical-mediated enzymatic methylation: a tale of two SAMS. Acc Chem Res 45:555–564. doi: 10.1021/ar200202c. [DOI] [PMC free article] [PubMed] [Google Scholar]
- 66.Paulsen IT, Brown MH, Skurray RA. 1996. Proton-dependent multidrug efflux systems. Microbiol Rev 60:575–608. [DOI] [PMC free article] [PubMed] [Google Scholar]
- 67.Tirosh O, Sigal N, Gelman A, Sahar N, Fluman N, Siemion S, Bibi E. 2012. Manipulating the drug/proton antiport stoichiometry of the secondary multidrug transporter MdfA. Proc Natl Acad Sci U S A 109:12473–12478. doi: 10.1073/pnas.1203632109. [DOI] [PMC free article] [PubMed] [Google Scholar]
- 68.Giron-Calle J, Schmid PC, Schmid HH. 1997. Effects of oxidative stress on glycerolipid acyl turnover in rat hepatocytes. Lipids 32:917–923. doi: 10.1007/s11745-997-0118-9. [DOI] [PubMed] [Google Scholar]
- 69.Echave P, Tamarit J, Cabiscol E, Ros J. 2003. Novel antioxidant role of alcohol dehydrogenase E from Escherichia coli. J Biol Chem 278:30193–30198. doi: 10.1074/jbc.M304351200. [DOI] [PubMed] [Google Scholar]
- 70.Han CJ, Park SH, Kelly RM. 1997. Acquired thermotolerance and stressed-phase growth of the extremely thermoacidophilic archaeon Metallosphaera sedula in continuous culture. Appl Environ Microbiol 63:2391–2396. [DOI] [PMC free article] [PubMed] [Google Scholar]
- 71.Shockley KR, Ward DE, Chhabra SR, Conners SB, Montero CI, Kelly RM. 2003. Heat shock response by the hyperthermophilic archaeon Pyrococcus furiosus. Appl Environ Microbiol 69:2365–2371. doi: 10.1128/AEM.69.4.2365-2371.2003. [DOI] [PMC free article] [PubMed] [Google Scholar]
- 72.Boonyaratanakornkit BB, Simpson AJ, Whitehead TA, Fraser CM, El-Sayed NM, Clark DS. 2005. Transcriptional profiling of the hyperthermophilic methanarchaeon Methanococcus jannaschii in response to lethal heat and non-lethal cold shock. Environ Microbiol 7:789–797. doi: 10.1111/j.1462-2920.2005.00751.x. [DOI] [PubMed] [Google Scholar]
- 73.Tachdjian S, Kelly RM. 2006. Dynamic metabolic adjustments and genome plasticity are implicated in the heat shock response of the extremely thermoacidophilic archaeon Sulfolobus solfataricus. J Bacteriol 188:4553–4559. doi: 10.1128/JB.00080-06. [DOI] [PMC free article] [PubMed] [Google Scholar]
- 74.Ter Beek A, Keijser BJ, Boorsma A, Zakrzewska A, Orij R, Smits GJ, Brul S. 2008. Transcriptome analysis of sorbic acid-stressed Bacillus subtilis reveals a nutrient limitation response and indicates plasma membrane remodeling. J Bacteriol 190:1751–1761. doi: 10.1128/JB.01516-07. [DOI] [PMC free article] [PubMed] [Google Scholar]
- 75.Tessema GT, Moretro T, Snipen L, Heir E, Holck A, Naterstad K, Axelsson L. 2012. Microarray-based transcriptome of Listeria monocytogenes adapted to sublethal concentrations of acetic acid, lactic acid, and hydrochloric acid. Can J Microbiol 58:1112–1123. doi: 10.1139/w2012-091. [DOI] [PubMed] [Google Scholar]
- 76.LeMarc Y, Huchet V, Bourgeois C, Guyonnet J, Mafart P, Thuault D. 2002. Modelling the growth kinetics of Listeria as a function of temperature, pH and organic acid concentration. Int J Food Microbiol 73:219–237. doi: 10.1016/S0168-1605(01)00640-7. [DOI] [PubMed] [Google Scholar]
- 77.Lambert R. 2011. A new model for the effect of pH on microbial growth: an extension of the gamma hypothesis. J Appl Microbiol 110:61–68. doi: 10.1111/j.1365-2672.2010.04858.x. [DOI] [PubMed] [Google Scholar]
Associated Data
This section collects any data citations, data availability statements, or supplementary materials included in this article.