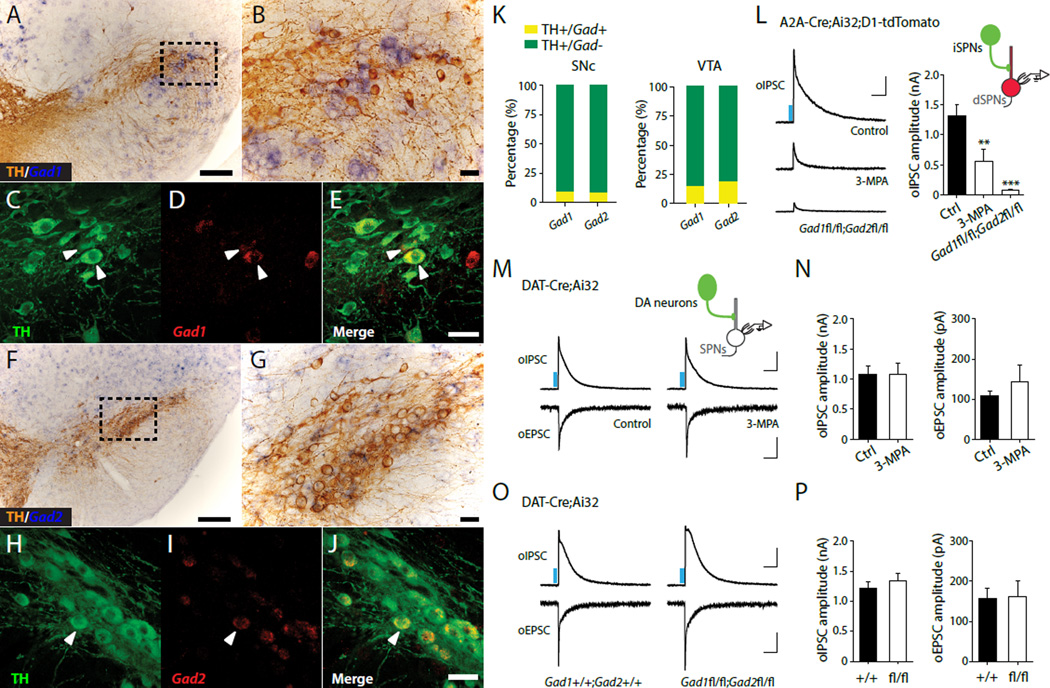
Fig. 1. GABA co-release by midbrain DA neurons does not require GAD.
(A to J) Expression of Gad1 and Gad2 mRNA in DA neurons of the SNc. Immunolabeled TH-positive dopaminergic neurons (brown) combined with chromogenic in situ hybridization (ISH) for Gad1 (A and B) and Gad2 (F and G) mRNA. Confocal fluorescence images of ISH for Gad1 (D) and Gad2 (I) mRNA (red) combined with TH immunostaining (green) (panels C-E and H-J) show limited expression of Gad in TH+ cells. (K) Quantification of TH/Gad co-localization in SNc (left) and VTA (right). (L) Left, Representative oIPSC traces in control (upper), 3-MPA-treated (500 μM, middle), and Gad1fl/fl;Gad2fl/fl (lower) A2A-Cre;Ai32;Drd1a-tdTomato mice. Right, summary statistics for oIPSC recordings. Representative traces (M) and summary statistics (N) for oIPSC and oEPSC recorded from DAT-Cre;Ai32 mice treated with ACSF (control) and 3- MPA, respectively. Representative traces (O) and summary statistics (P) for oIPSC and oEPSC recorded from DAT-Cre;Ai32;Gad1+/+;Gad2+/+ and DAT-Cre;Ai32;Gad1fl/fl;Gad2fl/fl mice. Blue bar indicates 450 nm light stimulation. Scale bars: 200 μm for A,F, 50 μm for B-E, G-J, 400 pA, 100 ms for oIPSC and 50 pA, 100 ms for oEPSC. Error bars indicate Mean ± SEM. **P < 0.01, ***P < 0.001.

