Significance
The transition from stick to slip is governed by rupture fronts propagating along a frictional interface. It has long been suggested that rapid acceleration of these ruptures generates a shear stress peak that propagates ahead of the front. These peaked waves are strong; they can reach amplitudes that are large enough to trigger secondary supershear ruptures. We provide the first extensive quantitative experimental study to our knowledge of these highly directed waves and their relation to the rupture fronts driving them. Combining our experiments with finite-element simulations, we observe how these waves scale. This study provides insight into how rupture fronts accelerate beyond the shear-wave speed and may offer a possibility to obtain illusive information about propagating earthquakes.
Keywords: nonsteady rupture dynamics, acoustic radiation, friction, earthquake dynamics, seismic radiation
Abstract
We study rapidly accelerating rupture fronts at the onset of frictional motion by performing high-temporal-resolution measurements of both the real contact area and the strain fields surrounding the propagating rupture tip. We observe large-amplitude and localized shear stress peaks that precede rupture fronts and propagate at the shear-wave speed. These localized stress waves, which retain a well-defined form, are initiated during the rapid rupture acceleration phase. They transport considerable energy and are capable of nucleating a secondary supershear rupture. The amplitude of these localized waves roughly scales with the dynamic stress drop and does not decrease as long as the rupture front driving it continues to propagate. Only upon rupture arrest does decay initiate, although the stress wave both continues to propagate and retains its characteristic form. These experimental results are qualitatively described by a self-similar model: a simplified analytical solution of a suddenly expanding shear crack. Quantitative agreement with experiment is provided by realistic finite-element simulations that demonstrate that the radiated stress waves are strongly focused in the direction of the rupture front propagation and describe both their amplitude growth and spatial scaling. Our results demonstrate the extensive applicability of brittle fracture theory to fundamental understanding of friction. Implications for earthquake dynamics are discussed.
The onset of motion along a frictional interface entails rupture-front propagation. These rupture fronts have long been considered to have much in common with propagating cracks (1–3). Recent friction experiments (4) have shown that the stresses and material motion surrounding the tip of a propagating rupture are indeed quantitatively described by singular linear elastic fracture mechanics (LEFM) solutions originally developed for brittle shear fracture. These singular fields are only regularized by dissipative and nonlinear processes in the vicinity of the rupture tip.
Nonsteady processes such as rapid rupture velocity variation during the nucleation or arrest phases result in the generation of stress-wave radiation (2, 5). In the study of earthquakes, understanding the source mechanism of those waves is of primary importance. Long-wavelength radiation is usually described by simple dislocation models (3, 6). High-frequency radiation, however, was proposed (2) to be controlled by the strong slip velocity concentrations at the rupture tip predicted by fracture mechanics. Descriptions that go beyond singular contributions to fracture involve significant analytical complications; full solutions of nonsteady dynamic crack problems are generally extremely difficult to obtain. Of the few full-field analytic solutions available, self-similar solutions of suddenly expanding shear cracks have provided much intuition (2, 5, 7, 8). These solutions, under shear loading (mode II), predict a localized shear stress peak that propagates ahead of the rupture tip at the shear-wave velocity. The results obtained in such solutions are generally considered as an upper bound for the realistic stress-wave radiation of smoothly accelerating ruptures. Radiated shear stress peaks have, for decades, drawn special attention, because they are thought to be an important vehicle for the nucleation of supershear ruptures, a class of ruptures that propagate beyond the shear-wave speed, . These ruptures surpass the Rayleigh wave speed, , the classic “speed limit” for rapid singular cracks. This idea was first postulated in ref. 1 and later numerically observed in ref. 9, who found that a sufficiently strong shear stress peak can overcome interfacial strength and nucleate a daughter crack that will propagate at supershear velocities (10–15). Such supershear ruptures have indeed been observed along natural fault planes (16, 17) and in laboratory experiments (18–21).
Despite their importance, experimental studies of radiated stress waves have been very limited. Here we present direct measurements of the stress fields surrounding the tips of rapidly propagating ruptures and show how a shear stress peak is formed. Supplementing experiments with finite-element calculations, we provide a detailed description of both the scaling and space–time structure of this phenomenon.
Experimental Observations
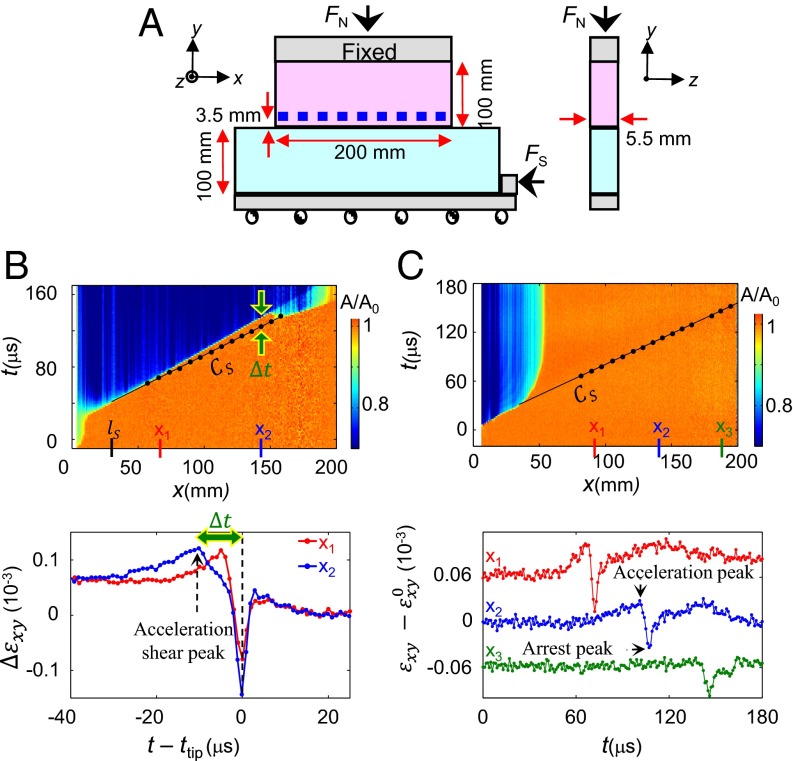
Our experimental system is schematically presented in Fig. 1A. Two poly(methylmethacrylate) blocks with ∼1-μm rough surfaces are pressed together by an external normal force, (2–6 MPa nominal pressure). Shear and longitudinal velocities are, respectively, m/s and m/s (plane stress). The complete 2D strain tensor, , is measured at 19 locations along and ∼3.5 mm above the frictional interface () separating the blocks. Each strain component is measured at rates of 1 million samples per second. All strain measurements are local (each three-component strain gauge is mm in size). Concurrent high-spatial-resolution measurements of the real area of contact, (x being the coordinate along the quasi-1D frictional interface), are obtained at 580,000 frames per second by means of direct optical imaging of along the entire 200 × 5.5-mm frictional interface (4). More details are given in Supporting Information. Once is fixed, the shear force, , is applied quasistatically by slowly incrementing until the transition from stick to slip occurs.
Fig. 1.
Prominent shear stress peaks due to accelerating or suddenly arrested frictional rupture fronts. (A) Nineteen rosette strain gauges (blue squares), mounted at mm measure the three 2D strain tensor components simultaneously every 1 μs. These are synchronized with real contact area, , measurements. (B, Top) evolution (normalized at nucleation time, ), along the quasi-1D interface due to a rupture front that nucleated at , rapidly accelerated to , and transitioned to supershear at mm. (Bottom) Shear strain variations, , relative to the rupture tip arrival time, , at the two locations, (red) and (blue) denoted above, show prominent amplitude shear strain peaks preceding the rupture tip arrival. For simplicity, we refer to these peaks as ‟shear stress peaks.” are residual values after the rupture front’s passage. Successive measurements (black points in upper panel) reveal that these peaks propagate at , and trigger supershear rupture. (C) Measurements of (Bottom) and the contact area (Top) reveal an inverted shear peak propagating at long after rupture arrest. Extrapolation (solid line) indicates that its origin coincides with rupture arrest. Arrest is due to decreasing values of with x (22, 24). (Bottom) measurements at three spatial points denoted above. The red (green) y axis is shifted by () relative to initial values, , for clarity. Black points in upper panels are measured peak locations.
The onset of frictional motion is marked by propagating crack-like rupture fronts that leave in their wake significantly reduced (4, 20). We define the location of the rupture tip as the point where a sharp reduction of occurs (orange to blue boundaries in Fig. 1). A typical example of a rupture front, asymptotically accelerating to rupture velocities, m/s), is presented in Fig. 1B, Top.
In what follows we consider the strain fields surrounding the propagating rupture. Owing to the linearity of the governing equations, constant values of the initial tensile strains , and the residual frictional level on the crack faces, , can be subtracted without loss of generality (3). We define strain variations, , with respect to these initial and residual strains. The corresponding stress variations, , can be calculated (under plane stress hypothesis). In what follows and are used interchangeably.
Fig. 1B, Bottom presents temporal measurements of shear strain variations, , at two spatially separated locations along the frictional interface. Both signals are presented relative to the rupture tip arrival time, . It is evident that prominent peaks in the shear strain component precede the rupture tip arrival. For simplicity, we will refer to these peaks as “shear stress peaks,” although they will, at times, be presented as peaks in the strain. Analysis of peak arrival times (e.g., Fig. 1B, Top) reveals that they propagate at as they progressively distance themselves from the rupture tips that created them. Extrapolating the space–time peak trajectories to the intersection point with the rupture trajectory implies that the initiation of this radiated stress wave does not coincide with the rupture nucleation point () but that it appears in the later stages of the accelerating phase. This is a general feature of all of the observed ruptures.
The measurements of presented in Fig. 1B reveal the sudden nucleation ( mm) of a secondary supershear rupture front (propagating at ). The synchronized measurements of and provide direct evidence that the supershear rupture was triggered by the arrival of the shear stress peak. This type of transition is not uncommon.
Overall relative motion of the two blocks occurs only after a rupture front has traversed the entire interface. Rupture fronts may arrest (Fig. 1C, Top), however, if they encounter either reduced shear stress regions or areas of increased interfacial strength (22–24). Measurements of (Fig. 1C, Bottom) indicate that the shear stress peak in Fig. 1B, in fact, persists, propagating far beyond the rupture arrest location while broadening and decaying in time. In addition, an inverted shear stress peak is generated that propagates at with its origin at the initial stages of the arrest phase (Fig. 1C, Top). This inverted shear stress peak is not to be confused with the violent oscillation at the rupture tip in Fig. 1B, Bottom. These experimental observations confirm predictions (2) that the nucleation and arrest stress-wave radiation are complementary phenomena, having the same form but with inverted signs.
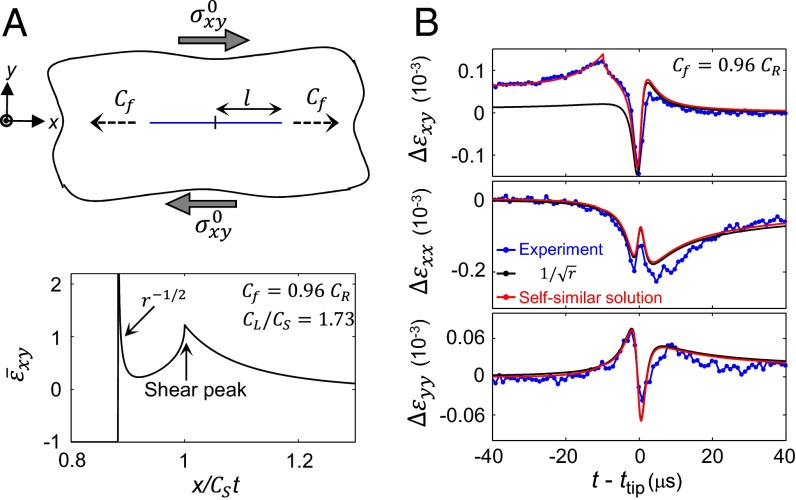
The examples above demonstrate the general notion that generation of stress-wave radiation requires nonsteady rupture processes. Let us now consider the explicit form of this radiation. In some simplified cases, analytical solutions are available (5) that describe radiation patterns generated by accelerating shear cracks. One such solution (7, 8) describes bilaterally expanding ruptures that initiate with zero initial length and propagate at a constant velocity () under uniform remote shear stress (Fig. 2A). In this problem, there is no characteristic time or length scale so self-similar propagating solutions can be found (Supporting Information). We will call this the “self-similar” solution, which was derived both for tension (25) and shear (1). The resulting normalized shear strain on the interface () is plotted in Fig. 2A, Bottom. This solution describes a singular propagating crack tip that is preceded by a sharp and relatively localized shear stress peak. In crack tip vicinities all stress components (and strains) have the universal singular form (7). This singular contribution dominates the near-tip stress fields in brittle fracture. The proportionality factor of the singularity (the stress intensity factor) depends on the fracture energy, (the energy dissipated per unit crack advance). Whereas generally depends on the material constitutive law, a consequence of the self-similar solution is that must linearly increase with the propagation distance, l (26).
Fig. 2.
Comparison of measured with the self-similar solution. (A, Top) We consider a self-similar bilaterally expanding rupture initiating at zero initial length and propagating at a constant rate under uniform remote shear stress, , and residual frictional shear stress, . The propagation length is given by . (Bottom) Close-up of the self-similar solution, , at shows a pronounced shear stress peak propagating ahead of the singular rupture tip. (B) Comparison of measured at mm, (blue) during a rupture event of Fig. 1B with both the singular LEFM predictions and the self-similar solution. Time is relative to the rupture tip arrival, . The singular term of the LEFM solution is plotted in black (, J/m2). Although it captures and well, the singular term fails to describe for . Shown in red, the corresponding self-similar solution [, mm result in J/m2] entirely captures all measured strain components including the initial shear strain, , and the shear stress peak far before the rupture tip arrival. The difference in in the two solutions highlights the importance of nonsingular contributions.
Experiments (4) have shown that under low shear stress loading, , the strain components surrounding the tip of slowly propagating frictional ruptures, are well-described by the universal singular form. , the sole free parameter in this description, was shown to be constant, roughly independent of both and the propagation distance. When , however, the singular form fails to describe measurements for (4), as demonstrated in Fig. 2B.
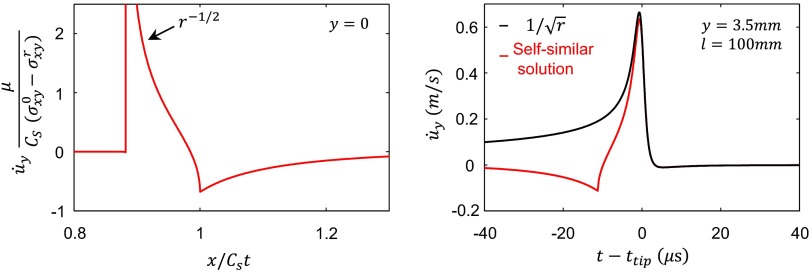
Fig. 2B also shows that the self-similar solution of an expanding shear rupture can describe all of the measured strain components rather well. In particular, this solution can capture both the initial shear loading, , as well as the propagating shear stress peak far before the rupture tip arrival. We expect (Fig. S1) significant contributions due to the shear stress peak in measurements of the interface normal component of the particle velocity. This demonstrates the importance of the nonsingular contributions to strains at finite distances from the rupture front tip (27). The solution highlights the underlying physical picture: Rapid rupture front acceleration (mimicked by infinite acceleration in the self-similar problem) results in radiation in the form of a localized shear stress peak propagating at .
Fig. S1.
Self-similar solution. (Left) Close-up of a normalized normal component of the particle velocity, , at shows a pronounced negative peak arriving with the shear-wave front () ahead of the square-root singular rupture tip ( and ). This negative peak in accompanies the shear stress peak in Fig. 2A. (Right) Shown in red is at mm as predicted by the self-similar solution for the model parameters describing the experimental measurements in Fig. 2B [, mm J/m2]. Time is shown relative to the arrival of the rupture tip, . predicted by the universal square-root singular from is plotted in black (, J/m2). The difference in for , analogous to the difference in presented in Fig. 2B, demonstrates the importance of considering transient contributions when experimental measurements are analyzed. No such difference appears in .
The fact that the form of the solution is so close to experiment suggests that the general form of the radiation pattern may be captured by this solution, but one should be careful not to take this comparison too far. The self-similar problem is, in many respects, unphysical; its core assumptions include a constant rupture front velocity propagating under constant background stress that yields a continually increasing with l. None of these is generally satisfied in the experiments. To perform the comparison in Fig. 2B we needed to choose both l and in the model to correspond to the measured and the instantaneous rupture velocity (Supporting Information). Although the self-similar problem might, consequently, be unrealistic (but see ref. 28), it nevertheless provides important physical intuition and has often been used to verify numerical methods (26).
Finite-Element Simulations
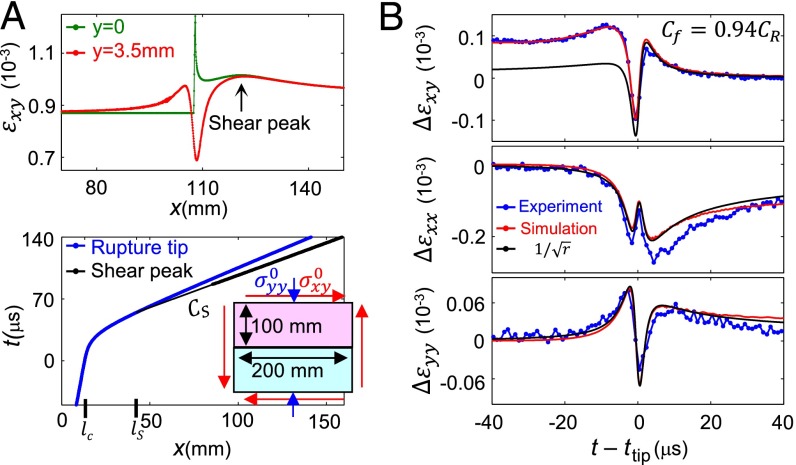
To make quantitative comparisons with the experiments, we performed 2D finite-element calculations in which the plane-stress hypothesis, block dimensions, and their elastic moduli correspond to the experimental system. The experimental loading configuration is mimicked by applying homogeneous shear and normal stresses (Fig. 3A, Inset). To close the system, we choose the widely used (9, 13, 14, 23) linear slip weakening friction law. This is the simplest cohesive zone model that captures both measurements (4) of and the dissipation zone size [where the singular fields are regularized (3)]. Element rupture occurs when the shear stress on the interface, , reaches an upper yield stress, MPa). Once local relative slip between the upper and bottom blocks is initiated, is reduced to the sliding friction level, MPa), over a slip distance dc (1.4 μm).
Fig. 3.
Finite-element calculations motivated by experiments. (A) We mimic the experimental setup by considering spatially homogeneous normal and shear loads (Bottom, Inset) under quasistatic initiation and loading. The singular rupture tip is regularized by a linear slip weakening cohesive zone model with all parameters experimentally estimated. (Top) Simultaneous “snapshots” of the calculated shear component profiles along the interface (green) and at the measurement location y = 3.5 mm (red). (Bottom) At a critical length, , rapid acceleration to approximately (blue curve) initiates (see text for nucleation procedure). Here, the shear stress peak is well-defined for mm (heavy black curve). Linear extrapolation can be traced back to its initiation point . (B) Measured (blue) as a function are compared with the corresponding simulation (red). Excellent agreement is observed. Shown in black is the singular term of the LEFM solution (, J/m2). Whereas is independently measured, is tuned to a value within the experimental error (). Note that the horizontal orientation of the front is reversed, relative to A, because the horizontal axis is t instead of x.
Spontaneous rupture nucleation in friction experiments and in natural faults has been the subject of extensive study (29–32). Previous numerical work has shown that different nucleation procedures can influence the propagating rupture fronts (12, 13, 33, 34). In particular, the more abrupt the initiation, the larger the amplitude of the radiated shear stress peak (13). Here we follow ref. 34 and induce a slowly propagating (∼0.1 CR) initial “seed” crack; starting from , we gradually reduce to over an increasing area. Once the seed crack has reached a critical distance (Griffith length), , rupture acceleration commences and asymptotically approaches as in the example presented in Fig. 3A, Bottom and Fig. S2.
Fig. S2.
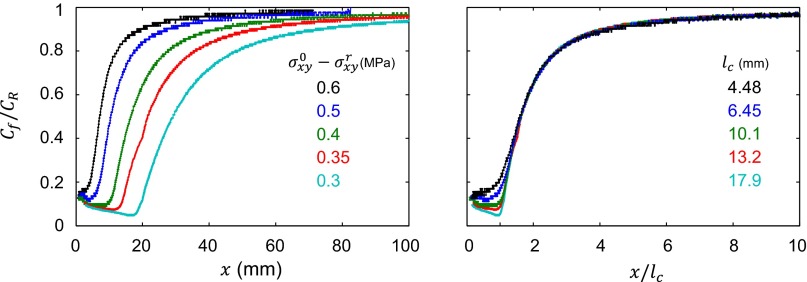
Simulation: rupture front velocity scaling. Different are considered. Lower values of result in larger critical crack lengths, . When x is normalized by all velocity curves collapse to single functional form; rupture fronts begin to accelerate at and asymptotically approach .
In Fig. 3A a snapshot of on the interface, , is compared with the simulated field at the height of the experimental measurements, mm. We use these calculations as a basis for quantitative comparison with the experiments. Excellent agreement between the measured and the corresponding numerical calculation (Fig. 3B) is obtained. In the numerical simulation, is directly prescribed by the experimental measurements and is not an adjustable parameter. The superimposed universal singular solution perfectly describes the calculated and with no additional free parameters, whereas it fails, as was previously discussed, for at . Fig. 3 establishes the reliability of our simulations.
We now use our numerical calculations to provide a detailed description of the shear stress peak structure. We concentrate, first, on the stress field on the interface (). Owing to the smooth acceleration of the simulated rupture, the shear stress peak is generally smeared relative to the analytical solution (Fig. 2A, Bottom) and the numerical calculation (26) of a suddenly expanding shear crack. The shear stress peak can, therefore, not be easily defined at the early stages of rupture propagation, whereas the peak location becomes clear at later stages of its evolution. We define the shear stress peak initiation point by using backward linear extrapolation of the time-position curve of the peak (Fig. 3A, Bottom). As in the experiments, the shear stress peak consistently initiates at a location, , that is located significantly after the rupture nucleation point, . At this location . These observations are in contrast to the self-similar solution where the shear stress peak initiation point coincides with the rupture nucleation point.
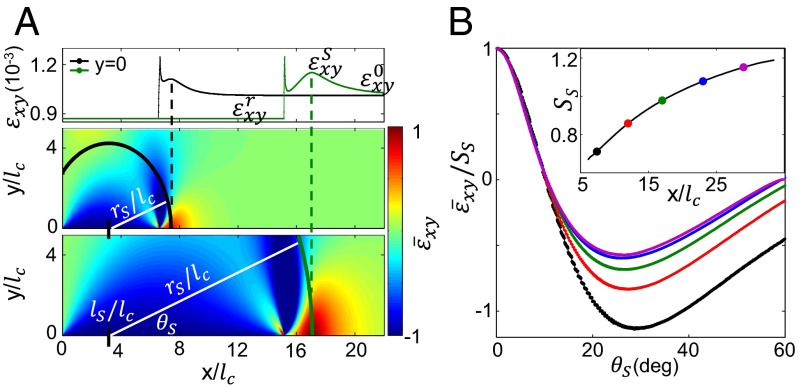
We are now in a position to consider the angular dependence of this propagating stress wave by using the full spatial form of the simulated fields. Two snapshots of the normalized shear strain are plotted in Fig. 4A. Because is symmetric with respect to , only the upper half-plane is shown. While the rupture front acceleration begins at , we define polar coordinates with respect to the initiation point of the stress peak, . At any moment, is equal to the distance between and the current location of the stress peak (). The overall maximum of the shear strain concentration ahead of the rupture front is always realized on the interface, (Fig. 4A, Top). Its normalized amplitude, , as originally noted in ref. 9, grows with the propagation distance (Fig. 4B, Inset). To account for this growth, to properly compare the angular form at successive time steps, we plot normalized by in Fig. 4B. For small forward angles (up to ), all curves collapse to a single functional form. This collapse suggests a well-defined angular dependence of the stress wave that forms the shear stress peak. We note that this collapse of the angular function is not observed if an origin different from is chosen. Within the amplitude is reduced by a factor of 2, implying a very sharp angular dependence. This strong focusing in the direction of the rupture propagation is characteristic of mode II ruptures (2). Such focusing is not present in mode I fracture (35). The difference between the curves for larger angles, we suspect, is due to strong interference with the fields associated with the rupture tip; as the shear stress peak distances itself from the rupture tip the collapse should include an increasingly larger range of angles, as suggested by the approximate approach to an asymptotic angular form in Fig. 4B.
Fig. 4.
The angular dependence of the radiated shear stress peak. (A) Two snapshots (at different times) of . x and y axes are normalized by the Griffith length, . Polar coordinates are defined with their origin at , the initiation point of the shear stress peak (Fig. 3A, Bottom). is with respect to the frictional interface. Dashed lines at denote the position of the shear strain peak, , that is always realized along () (Upper). (B) The angular dependence in five representative snapshots is compared for different . These strain values are normalized by (for colors see Inset). All curves collapse to a single functional form for small angles up to , suggesting a well-defined angular functional form for the radiated stress wave that is highly focused around the interface; within the amplitude is reduced by 2 (Inset). grows with . Black and green points correspond to the snapshots in A.
The observed increase of (in contrast to the amplitude decay that would be expected for simple cylindrical waves) must result from a continuous radiation by the accelerating rupture front. The observation of the shear stress peaks with a well-defined angular form and initiation point, , is not trivial. This suggests that these continuously generated waves must constructively interfere to both build and sustain this coherent structure. A qualitatively similar nondecaying shear stress peak with a well-defined angular form is also obtained from the self-similar solution presented in Fig. 2.
Stress-Wave Scaling
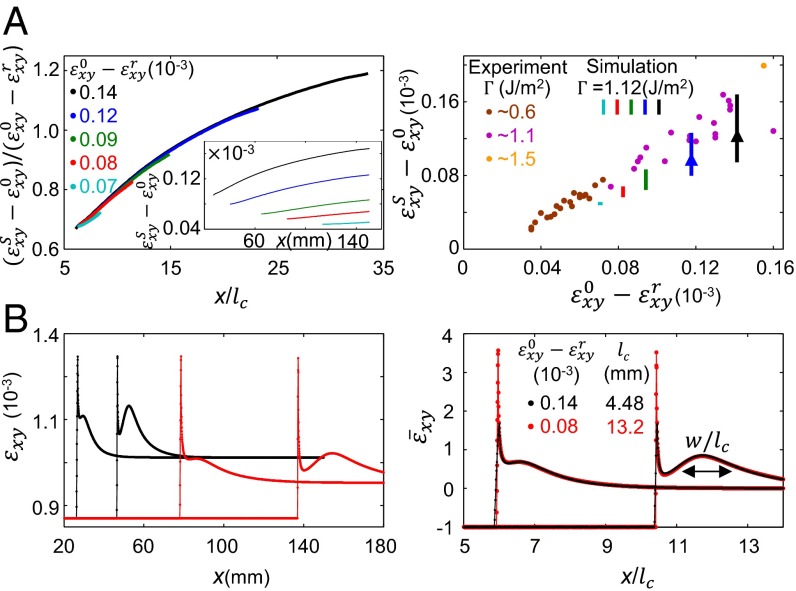
Let us now consider what determines the shear stress peak amplitude and scaling. We first consider the effect of preimposed shear stress. Fig. 5A, Left, Inset indicates that the dynamic strain drop, , significantly affects the overall amplitude of the shear peak, . The larger the values of the dynamic strain drop, the faster the increase in amplitude growth. This suggests that propagation distances should be scaled as well. is the sole length scale in the system; all numerical rupture velocity profiles collapse when plotted as a function of (Fig. S2) and . Fig. 5A, Left shows that the simulated stress peaks indeed collapse to a single function of the scaled propagation distance , .
Fig. 5.
Scaling of the propagating shear stress peak. (A, Left) Simulation: shear peak values, , increase in amplitude with both dynamic strain drop and x. When is scaled by and x by all of unscaled curves (Inset) collapse to single functional form. Plots are truncated at mm before reflected waves arrive. (Right) Experiments indicate that the shear peak amplitude, , roughly scales with . Each solid point corresponds to a single experimental event. varies (see legend) with . Lines corresponding to the numerical growth of shear stress peak amplitude in x are superimposed (colors as in left panel legend; arrows show growth direction). The spread of the measurements is wholly consistent with the growth exhibited in A. (B) Two examples from the numerical on-fault () waveforms analyzed in A (Left) demonstrate shear stress peak scaling; waveforms are identical when strain and distance are normalized as in A (Left). In particular, the width of the wave, w, linearly scales with . .
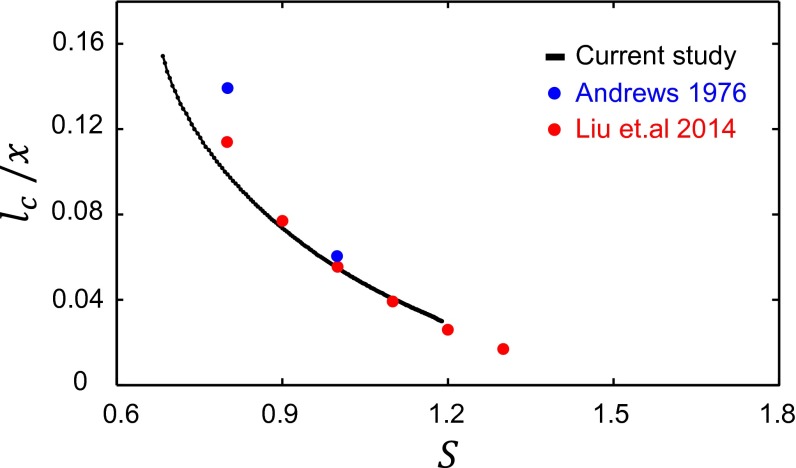
Previous studies had suggested that once the shear stress peak, , reaches the interfacial strength, , a supershear secondary crack is born that propagates above (9) whose transition length has been numerically studied (9, 12–14). In Fig. S3 we show that the observed transition length scaling in refs. 9 and 14 exactly coincides with the growth of as presented in Fig. 5A, Left. Although, here, we concentrate on the dynamics of the propagating shear stress peak, we expect that the scaling exhibited in Fig. 5A, Left is, therefore, directly relevant to the supershear transition.
Fig. S3.
Predicting the supershear transition. The normalized locations of the supershear transition onset obtained for various values of in refs. 9 and 14 (blue and red). We superimpose the growth of the shear stress peak, , as was presented in Fig. 5A, Right (black). The plot shows that the observed scaling of the shear stress peak growth is consistent with the scaling reported for the supershear transition.
How large can grow? The solutions to the self-similar problem yield values in the range (5). The maximal value, , corresponds to a sudden velocity jump to whereas is the limit when . The value of might be slightly lower, however, if an asymmetric bilateral crack propagation is considered (5). Our simulations for a smoothly accelerating rupture front show that, when the shear stress peak is first resolved, its minimal value is (Fig. 5A, Left). It is expected (9) that will provide an upper bound; as . Numerically, we are currently limited to an attainable value of ; is limited because of the need to sufficiently resolve both the system size and the continuously contracting dissipation region (3, 4) as .
Although the simulations provide us with access to the shear stress peak values at the interface, its sharp angular dependence (Fig. 4B) suggests that the experimental estimation of these values at should be performed with some caution. Only for () will the shear strain measurements performed at mm reliably reflect on the interface. To this end, we choose only measurements where to estimate the shear peak values, ( underestimates peak amplitudes by at most ). These values, presented in Fig. 5A, Right, are indeed consistent with the numerics (Fig. 5A, Left) because they convincingly show that the shear peak roughly scales with the dynamic strain drop, . It is, however, difficult to distinguish the numerically observed growth effect (scaling with x) from experimental uncertainties resulting from both spatial stress inhomogeneities and estimation of the measurements for . We note that all of the data points in Fig. 5A, Right fall below the slope and do not reach . The maximal measured values of may be limited by either the supershear transition or the finite length of the interface. Because this result is specific for the dimensions and applied normal stresses in our system, it may be possible to approach for a more extended interface.
We further illustrate the scaling of the shear stress peak by considering (Fig. 5B) two different simulated rupture events. In each event, two typical snapshots of on the interface have been chosen. When and x are properly scaled, the space-time dependence of the on-fault () shear peak waveform collapses to a single function of . In particular, its width, w, scales linearly with .
Discussion
We previously (4) demonstrated that the singular functions that were derived to describe shear fracture in the framework of fracture mechanics (7) provide an excellent description of near-tip stress field components—with the notable exception of the shear stress component at high rupture velocities. Here we have shown that this “discrepancy” with the singular solution is not a simple technical issue of accounting for nonsingular contributions to the singular description, but actually possesses a life (and extensive history) of its own.
In contrast to far-field acoustic data (6) that consider a rupture as a moving dipole source, we focused on the near-field radiation emitted by coherent accelerating ruptures. Transporting significant energy ahead of the rupture front, the stress radiation amplitudes can reach the strength of the frictional interface and trigger supershear (5, 9, 11–14). The radiated shear stress peaks have a characteristic near-field signature: high-amplitude radiation (comparable to the dynamic stress drop) that is both localized and strongly focused in the direction of rupture propagation. This signature is a general feature of nonsteady shear rupture (2, 5).
It is significant that both our experiments and simulations show that, during rupture propagation, the shear stress peak does not decrease in amplitude (cf. Fig. 1B). In contrast, upon rupture arrest we observe distinct shear stress peak decay (Fig. 1C). This decay is consistent with previous theoretical observations (2, 5, 35) of decaying radiation that was associated with abrupt changes of and can be expected from the conservation of radiated energy. A nondecaying stress peak amplitude may therefore be interpreted as due to continuous radiation and transfer of energy from the nonsteady rupture to the propagating shear stress peak. One such example is the self-similar problem, where the rupture does not reach steady-state propagation (27) (although it propagates at constant velocity), because continually increasing amounts of energy are needed to drive constant velocity cracks. On this note, we may attribute the growth presented in Fig. 5 to the asymptotic rupture acceleration to .
How general is the shear stress peak scaling described by Fig. 5? Our simulations considered a particular, although important and fundamental, class of systems: (Griffith-like) quasistatic loading into a uniform initial stress distribution. Many experimental features are well-captured by the simulations (e.g., Figs. 3 and 5), despite the uncontrolled nucleation and spatial variation of the stresses in the experiments. We, therefore, expect that the peak amplitude and spatial scaling exhibited in Fig. 5 are not critically dependent on small variations of the assumptions used in the simulations. These assumptions may, nevertheless, not hold for a natural fault. In particular, it is known that some nucleation procedures can significantly affect the shear stress peak growth (12, 13, 33, 34). The rupture front’s shape during an earthquake may be quite complicated and natural faults are known to be complex entities that include significant heterogeneity of fracture energy, friction laws, stresses, and fault geometry. Even with all of this complexity, however, in some cases (e.g., refs. 17, 36, and 37) qualitative and sometimes quantitative features of natural earthquakes can be both successfully compared with rather idealized models and reproduced in laboratory experiments. Of particular interest are successful comparisons of near-field measurements of quantities such as particle velocities (17, 37). It would be interesting, therefore, to compare near-field measurements of large earthquakes to our results to first determine whether the general features embodied in Fig. 2 are at all apparent. We would expect to see evidence of the shear stress peak followed by the characteristic signature of the singularity at the rupture tip (4), as the rupture passes by the measurement point. These features should be observable both in strain measurements or, as demonstrated in Fig. S1, in particle velocity measurements. If so, measurements at small angles relative to the fault could provide hitherto inaccessible information about both propagating earthquakes and their acceleration phase. For example, the dynamic stress drop, can be roughly approximated by the shear stress peak amplitude—even if one ignores the stress peak amplitude variation with propagation distance. Comparison of this quantity to seismic measurements of the earthquake’s overall stress drop would yield information about the contribution to the stress drop by other processes.
Experiment
The experimental loading system, strain, and contact area measurements are described in detail in ref. 4. We specify here the main differences in the current study.
System and Material Properties.
Our experiments were conducted using poly(methyl methacrylate) (PMMA) blocks of dimensions 200 × 100 × 5.5 mm (top block) and 250 × 100 × 5.5 mm (bottom block) in the x, y, and z direction, respectively (Fig. 1A). This is in contrast to ref. 4, where a 30-mm-wide bottom block was used. The contact faces of the blocks were diamond-machined to optical flatness. Material shear, , and longitudinal, , wave speeds were obtained by measuring the time of flight of ultrasonic pulses, yielding and . Due to the high frequency (5 MHz) of the ultrasonic pulses used, the measured corresponds to plane strain hypothesis . Using these measured values, for plane stress was then calculated to be . The wave speeds and the mass density, ρ = 1,170 kg/m3, yield dynamic values for the Poisson ratio of and Young’s modulus of . Note that the value of E is significantly different from the static value of . This difference is due to the viscoelastic behavior of PMMA (38).
Strain Measurements.
We use miniature Vishay 015RJ rosette strain gauges for local strain measurements. Each rosette strain gauge is composed of three independent active regions (each 0.34 × 0.38 mm size) which are separated in the x direction by ≈0.39 mm (for details see ref. 4). During rapid rupture propagation, this distance induces a small (≈0.31 μs) time delay between the components that are taken into account for proper calculation of and .
In these experiments we find that the measured strain fields are better described by the analytical solutions calculated for plane stress hypothesis . This is in contrast to ref. 4, where the plane strain hypothesis was shown to be more appropriate. We attribute this difference to the smaller thickness of the bottom plate in the current study.
Self-Similar Solution of an Expanding Shear Crack
The bilateral expansion of a crack from zero initial length under homogeneous shear loading at constant velocity is discussed in refs. 7 and 8. The solution to this problem is given by the self-similar stress fields , and particle velocities . Normalized forms of and on the interface () for a crack propagating at are plotted in Fig. 2A and Fig. S1, Left, respectively. Both fields show a pronounced peak arriving with the shear-wave front () ahead of the square-root singular rupture tip. This feature is absent at in other components of stress (Fig. 2B) and particle velocities and should be considered when experimental measurements are compared with LEFM solutions.
The comparison with experimentally measured strain components (Fig. 2B) was performed by specifying values of , and the crack propagation distance, l, all within experimental error, to correspond to a snapshot of the self-similar solution. These parameters determine the local value of . The solution’s assumed conditions of constant with the resulting linear increase of with l are not, generally, satisfied in experiments, where a rupture will generally accelerate toward the Rayleigh wave speed. The solution is artificial in the sense that once and are chosen to correspond to experimental measurements at some distance l, forward propagation of the solution will no longer fit experiments, resulting in increasing deviations with time.
Finite-Element Simulation
The elastic moduli, plane stress hypothesis, and plate dimensions that were used corresponded to the experimental system. The viscoelastic behavior of PMMA is not taken into account because we believe it has only a minor effect on the dynamics of propagating rupture fronts (the dynamic values of E were used). In addition, no attempt was made to exactly reproduce the experimental loading configuration; we applied a homogeneous stress configuration (where in the experiments, at times, significant stress gradients existed). We, instead, concentrated on the general features of mode II ruptures.
Numerical Methods.
The finite-element simulations are based on an explicit Newmark-β integration scheme with a lumped mass matrix. The solids are discretized by regular quadrilateral elements with first-order interpolation and four Gaussian quadrature points. Each solid is discretized by elements, which results in an interface discretization of 3,200 surface elements and an element size of 0.06 mm. The interactions at the interface are modeled using a traction-at-split-node method (39, 40) with a forward Lagrange multiplier method (41). A small-strain elastic approach was used for all simulations and no bulk or interface dumping was applied.
Nucleation Procedure.
In the numerical work presented here we follow ref. 34 and induce a slowly propagating seed crack. Starting from , the nucleation zone expands at velocities of approximately 0.1 Cr. In the nucleation zone the value of is gradually reduced to (over a length of 4 mm). Once the seed crack has reached a critical distance (Griffith length), , rupture acceleration commences and asymptotically approaches (Fig. S2, Left). When the system size is much larger and the dissipation zone is much smaller than the crack length, under homogeneous loading is the sole length scale of the problem. We indeed observe that, under these conditions, numerically calculated rupture velocity profiles collapse to single functional form, (Fig. S2, Right). This result is a general consequence of fracture mechanics (7).
What defines ? The half-length of the critical central shear crack in plane stress [the geometry considered in the self-similar problem (Fig. 2A)] is given by . In our simulations, an edge crack rather than a central crack is considered. For the edge crack configuration . This result is due to the larger stress intensity factor of an edge crack, (equations 5.1 and 8.1 in ref. 42).
Shear Stress Peak Growth.
The supershear transition has been the subject of extensive studies. Let us relate the scaled growth of the shear stress peak in Fig. 5A, Left to estimates of the supershear transition. It was shown ref. 9 that if (the shear stress peak) reaches (the interfacial upper yield stress) a secondary supershear rupture front forms. The transition distance scales with and increases for increasing values of . These results, acquired from refs. 9 and 14, are shown in Fig. S3. We denote as the sliding friction level and as the remote shear stress.
In Fig. 5A, Left the normalized shear stress peak, , which grows with the normalized propagation distance, , is presented. The observed scaling indicates that the functional form of is independent of S. Consequently, the supershear transition criterion (=) can be formulated as ; this equation, solved for x, provides a prediction for the location of the supershear transition. is expected to be bounded by (discussed in the main text); therefore, no transition will occur for . , obtained from a single simulation run, superimposed in Fig. S3, indeed reproduces the transition distances obtained in refs. 9 and 14. We note that understanding the growth of the shear stress peak under general loading configurations (e.g., inhomogeneous loading) might provide a more complete understanding of the supershear transition.
Acknowledgments
We thank G. Cohen for fruitful discussions. This work was supported by James S. McDonnell Fund Grant 220020221, European Research Council Grant 267256, and Israel Science Foundation Grants 76/11 and 1523/15 (all to I.S. and J.F.); European Research Council Grant ERCstg UFO-240332 (to J.-F.M., D.S.K., and D.P.M.); and Swiss National Science Foundation Grant PMPDP2-145448 (to M.R.). This work was also supported by Cornell University (D.S.K.).
Footnotes
The authors declare no conflict of interest.
This article is a PNAS Direct Submission.
This article contains supporting information online at www.pnas.org/lookup/suppl/doi:10.1073/pnas.1517545113/-/DCSupplemental.
References
- 1.Burridge R. Admissible speeds for plane-strain self-similar shear cracks with friction but lacking cohesion. Geophys J R Astron Soc. 1973;35(4):439–455. [Google Scholar]
- 2.Madariaga R. High-frequency radiation from crack (stress drop) models of earthquake faulting. Geophys J Int. 1977;51(3):625–651. [Google Scholar]
- 3.Rice JR. 1980. The mechanics of earthquake rupture. Physics of the Earth’s Interior. Proceedings of the International School of Physics “Enrico Fermi”, eds Dziewonski AM, Boschi E (North-Holland, Amsterdam), pp 555–649.
- 4.Svetlizky I, Fineberg J. Classical shear cracks drive the onset of dry frictional motion. Nature. 2014;509(7499):205–208. doi: 10.1038/nature13202. [DOI] [PubMed] [Google Scholar]
- 5.Dunham EM. Conditions governing the occurrence of supershear ruptures under slip-weakening friction. J Geophys Res. 2007;112(B7):B07302. [Google Scholar]
- 6.McLaskey GC, Glaser SD. Micromechanics of asperity rupture during laboratory stick slip experiments. Geophys Res Lett. 2011;38(12):L12302. [Google Scholar]
- 7.Freund LB. Dynamic Fracture Mechanics. Cambridge Univ Press; New York: 1990. [Google Scholar]
- 8.Broberg KB. Cracks and Fracture. Academic; San Diego: 1999. [Google Scholar]
- 9.Andrews DJ. Rupture velocity of plane strain shear cracks. J Geophys Res. 1976;81(32):5679–5687. [Google Scholar]
- 10.Abraham FF, Gao H. How fast can cracks propagate? Phys Rev Lett. 2000;84(14):3113–3116. doi: 10.1103/PhysRevLett.84.3113. [DOI] [PubMed] [Google Scholar]
- 11.Geubelle PH, Kubair DV. Intersonic crack propagation in homogeneous media under shear-dominated loading: Numerical analysis. J Mech Phys Solids. 2001;49(3):571–587. [Google Scholar]
- 12.Festa G, Vilotte J-P. Influence of the rupture initiation on the intersonic transition: Crack-like versus pulse-like modes. Geophys Res Lett. 2006;33(15):L15320. [Google Scholar]
- 13.Liu Y, Lapusta N. Transition of mode ii cracks from sub-Rayleigh to intersonic speeds in the presence of favorable heterogeneity. J Mech Phys Solids. 2008;56(2):25–50. [Google Scholar]
- 14.Liu C, Bizzarri A, Das S. Progression of spontaneous in-plane shear faults from sub-Rayleigh to compressional wave rupture speeds. J Geophys Res. 2014;119(11):8331–8345. [Google Scholar]
- 15.Psakhie SG, Shilko EV, Popov MV, Popov VL. Key role of elastic vortices in the initiation of intersonic shear cracks. Phys Rev E Stat Nonlin Soft Matter Phys. 2015;91(6):063302. doi: 10.1103/PhysRevE.91.063302. [DOI] [PubMed] [Google Scholar]
- 16.Bouchon M, Vallée M. Observation of long supershear rupture during the magnitude 8.1 Kunlunshan earthquake. Science. 2003;301(5634):824–826. doi: 10.1126/science.1086832. [DOI] [PubMed] [Google Scholar]
- 17.Dunham EM, Archuleta RJ. Evidence for a supershear transient during the 2002 denali fault earthquake. Bull Seismol Soc Am. 2004;94(6):S256–S268. [Google Scholar]
- 18.Rosakis AJ, Samudrala O, Coker D. Cracks faster than the shear wave speed. Science. 1999;284(5418):1337–1340. doi: 10.1126/science.284.5418.1337. [DOI] [PubMed] [Google Scholar]
- 19.Xia K, Rosakis AJ, Kanamori H. Laboratory earthquakes: The sub-Rayleigh-to-supershear rupture transition. Science. 2004;303(5665):1859–1861. doi: 10.1126/science.1094022. [DOI] [PubMed] [Google Scholar]
- 20.Ben-David O, Cohen G, Fineberg J. The dynamics of the onset of frictional slip. Science. 2010;330(6001):211–214. doi: 10.1126/science.1194777. [DOI] [PubMed] [Google Scholar]
- 21.Passelègue FX, Schubnel A, Nielsen S, Bhat HS, Madariaga R. From sub-Rayleigh to supershear ruptures during stick-slip experiments on crustal rocks. Science. 2013;340(6137):1208–1211. doi: 10.1126/science.1235637. [DOI] [PubMed] [Google Scholar]
- 22.Rubinstein SM, Cohen G, Fineberg J. Dynamics of precursors to frictional sliding. Phys Rev Lett. 2007;98(22):226103. doi: 10.1103/PhysRevLett.98.226103. [DOI] [PubMed] [Google Scholar]
- 23.Radiguet M, Kammer DS, Gillet P, Molinari JF. Survival of heterogeneous stress distributions created by precursory slip at frictional interfaces. Phys Rev Lett. 2013;111(16):164302. doi: 10.1103/PhysRevLett.111.164302. [DOI] [PubMed] [Google Scholar]
- 24.Kammer DS, Radiguet M, Ampuero JP, Molinari JF. Linear elastic fracture mechanics predicts the propagation distance of frictional slip. Tribol Lett. 2015;57(3):1–10. [Google Scholar]
- 25.Broberg KB. The propagation of a brittle crack. Ark Fys. 1960;18(2):159–192. [Google Scholar]
- 26.Andrews DJ. Dynamic plane-strain shear rupture with a slip-weakening friction law calculated by a boundary integral method. Bull Seismol Soc Am. 1985;75(1):1–21. [Google Scholar]
- 27.Freund LB, Rosakis AJ. The structure of the near-tip field during transient elastodynamic crack growth. J Mech Phys Solids. 1992;40(3):699–719. [Google Scholar]
- 28.Xia K, Chalivendra VB, Rosakis AJ. Observing ideal self-similar crack growth in experiments. Eng Fract Mech. 2006;73(18):2748–2755. [Google Scholar]
- 29.Uenishi K, Rice JR. Universal nucleation length for slip-weakening rupture instability under nonuniform fault loading. J Geophys Res. 2003;108(B1):2042. [Google Scholar]
- 30.Rubin AM, Ampuero J. Earthquake nucleation on (aging) rate and state faults. J Geophys Res. 2005;110(B11):B11312. [Google Scholar]
- 31.Bar-Sinai Y, Spatschek R, Brener EA, Bouchbinder E. Instabilities at frictional interfaces: Creep patches, nucleation, and rupture fronts. Phys Rev E Stat Nonlin Soft Matter Phys. 2013;88(6):060403. doi: 10.1103/PhysRevE.88.060403. [DOI] [PubMed] [Google Scholar]
- 32.Latour S, Schubnel A, Nielsen S, Madariaga R, Vinciguerra S. Characterization of nucleation during laboratory earthquakes. Geophys Res Lett. 2013;40(19):5064–5069. [Google Scholar]
- 33.Lu X, Lapusta N, Rosakis AJ. Analysis of supershear transition regimes in rupture experiments: The effect of nucleation conditions and friction parameters. Geophys J Int. 2009;177(2):717–732. [Google Scholar]
- 34.Gabriel A-A, Ampuero J-P, Dalguer LA, Mai PM. The transition of dynamic rupture styles in elastic media under velocity-weakening friction. J Geophys Res. 2012;117(B9):B09311. [Google Scholar]
- 35.Rose LRF. The stress-wave radiation from growing cracks. Int J Fract. 1981;17(1):45–60. [Google Scholar]
- 36.Walter JI, et al. Rupture speed dependence on initial stress profiles: Insights from glacier and laboratory stick-slip. Earth Planet Sci Lett. 2015;411:112–120. [Google Scholar]
- 37.Mello M, Bhat HS, Rosakis AJ, Kanamori H. Reproducing the supershear portion of the 2002 Denali earthquake rupture in laboratory. Earth Planet Sci Lett. 2014;387:89–96. [Google Scholar]
- 38.Read BE, Duncan JC. Measurement of dynamic properties of polymeric glasses for different modes of deformation. Polym Test. 1981;2(2):135–150. [Google Scholar]
- 39.Andrews DJ. A numerical study of tectonic stress release by underground explosions. Bull Seismol Soc Am. 1973;63(4):1375–1391. [Google Scholar]
- 40.Andrews DJ. Test of two methods for faulting in finite-difference calculations. Bull Seismol Soc Am. 1999;89(4):931–937. [Google Scholar]
- 41.Carpenter NJ, Taylor RL, Katona MG. Lagrange constraints for transient finite element surface contact. Int J Num Met Eng. 1991;32(1):103–128. [Google Scholar]
- 42.Tada H, Paris PC, Irwin GR. The Stress Analysis of Cracks Handbook. 3rd Ed Am Soc Mechanical Engineers; New York: 2000. [Google Scholar]


