Significance
Developmental synchrony, resulting from reduced fluctuation in individual development rate, is critical for swarming, migration, and social relationships of colonial animals. However, the molecular regulators of synchronous development are poorly understood. The migratory locust transits between high-density gregarious and low-density solitarious phases, with the former displaying more synchronous sexual maturation. Here, we identify a microRNA (miRNA), miR-276, expressed in the ovaries of female locusts mediating progeny egg-hatching synchrony by up-regulating its target brahma (brm), a transcription coactivator gene. Moreover, this up-regulation was dependent on the secondary structure of brm RNA. Our study demonstrates a noncanonical mechanism of miRNA-mediated gene regulation and provides important traits of locust phase transition for clues of possible prediction of pest plague outbreaks.
Keywords: canalization, maternal-effect, stem-loop, transcription coactivator, heterochronic hatching
Abstract
Developmental synchrony, the basis of uniform swarming, migration, and sexual maturation, is an important strategy for social animals to adapt to variable environments. However, the molecular mechanisms underlying developmental synchrony are largely unexplored. The migratory locust exhibits polyphenism between gregarious and solitarious individuals, with the former displaying more synchronous sexual maturation and migration than the latter. Here, we found that the egg-hatching time of gregarious locusts was more uniform compared with solitarious locusts and that microRNA-276 (miR-276) was expressed significantly higher in both ovaries and eggs of gregarious locusts than in solitarious locusts. Interestingly, inhibiting miR-276 in gregarious females and overexpressing it in solitarious females, respectively, caused more heterochronic and synchronous hatching of progeny eggs. Moreover, miR-276 directly targeted a transcription coactivator gene, brahma (brm), resulting in its up-regulation. Knockdown of brm not only resulted in asynchronous egg hatching in gregarious locusts but also impaired the miR-276–induced synchronous egg hatching in solitarious locusts. Mechanistically, miR-276 mediated brm activation in a manner that depended on the secondary structure of brm, namely, a stem-loop around the binding site of miR-276. Collectively, our results unravel a mechanism by which miR-276 enhances brm expression to promote developmental synchrony and provide insight into regulation of developmental homeostasis and population sustaining that are closely related to biological synchrony.
Biological synchrony is a ubiquitous yet highly diverse phenomenon, with examples as wide-ranging as applause among humans, migration of fish and birds, aggregation of insects (1), and mass flowering of bamboos (2). Synchrony in behavior, physiology, and development can increase cooperation by strengthening social attachment among group members. Synchronous development is particularly significant to group-living animals. For example, synchronized estrous cycles in certain mammals are beneficial to secure male investment (3) and increase birth rates (4). The emergence of beetles at the same time is essential for successfully attacking trees and laying eggs (5). Reproductive synchrony in colonial swallows is beneficial for maximizing reproductive success (6). Birth synchrony is critical for group migration to avoid predators in turtles (7) and for the provision of allomaternal care in some social groups of mammals (8).
Growing numbers of studies have focused on the underlying mechanisms of synchrony to understand the rhythm of living organisms. For example, chemical pheromones are the main regulatory factors of menstrual synchrony in humans (9). Physiological clocks control the mass flowering of bamboo (10). The physiological parameters of bird eggs (11), mothers' pheromones, and the mechanical movements in the crab (12) affect egg-hatching synchrony. However, the molecular regulators of synchrony are currently poorly understood. Conceptually, synchronous development is caused by a reduced variation in individual developmental rate, which is called “canalization” and can be mediated by Hsp90, microRNAs (miRNAs), and cross-regulation of gap genes (13, 14). miRNAs serve particularly important functions in canalizing developmental process by fine-tuning gene expression and interacting with transcription factors (TFs) (15, 16), implying that miRNAs may modulate group synchronous development.
The migratory locust (Locusta migratoria) exhibits extreme phase polyphenism, whereby the same genotype can reversibly transit between solitarious and gregarious phases in response to various population densities (17). Numerous phenotypic traits differ between solitarious and gregarious locusts. Notably, gregarious locusts present more synchronous sexual maturation than solitarious locusts in both the migratory locust and the desert locust (Schistocerca gregaria) (18). The synchronous development of eggs from gregarious locusts would serve an important basis for the synchrony of hopper development, swarming, migration, and sexual maturation. This study investigates whether the egg hatching of gregarious locusts is more synchronous compared with solitarious locusts and what molecular mechanism is underlying synchrony of egg development in the migratory locust.
A number of genes and small RNAs are differentially expressed between solitarious and gregarious locusts (19–23), indicating that transcriptome reprogramming occurs in response to population density, where miRNAs are required for the fine-tuning of gene expression. miR-133 has been demonstrated to mediate phase transition of the migratory locust (24). In addition, maternal and paternal genes are involved in phase-related regulation of egg size in the migratory locust (25, 26). Maternal miRNAs often affect the early development of offspring in numerous species (27–29). However, the roles of maternal miRNAs in phase-related egg-hatching traits remain unclear.
In this study, we demonstrate that eggs from gregarious locusts developed more synchronously than those from solitarious locusts, resulting from elevated expression of microRNA-276 (miR-276) in the ovaries of gregarious locusts. Surprisingly, miR-276 promotes the expression of its target gene brahma (brm) depending on the secondary structure of brm, mediating the effect of miR-276 on egg developmental synchrony in response to crowded stimuli.
Results
Synchrony of Egg Hatching and Development.
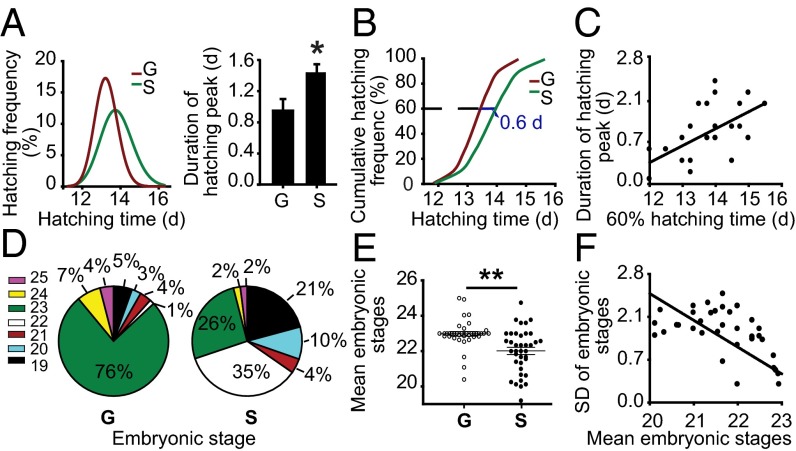
To compare the differences in egg-hatching time between gregarious and solitarious locusts, we compared best-fit normal curve hatching data for each phase. The gregarious egg-hatching time curve was narrower relative to the solitarious egg, with a 34% decrease in the SD of egg-hatching time (Fig. 1A). The duration of the hatching peak (10–90% hatching) was 51% longer in solitarious locusts than gregarious locusts (Fig. 1A). These results indicate that egg hatching of solitarious locusts is more heterochronic relative to gregarious locusts.
Fig. 1.
Gregarious (G) eggs develop more synchronously and faster than solitarious (S) eggs. (A) Gregarious eggs hatched more synchronously than solitarious eggs. (Left) Normal curve fitting of egg-hatching time. SD of the egg-hatching time was significantly larger in the solitarious locusts than that of the gregarious locusts (n = 1,850; Levene’s test, P < 0.001). (Right) Egg-hatching peak (10–90% hatching) duration was shorter in gregarious locusts than in solitarious locusts (n = 39). (B) Probit regression between hatching time and cumulative hatching frequency. (C) The 60% hatching time was positively correlated with the duration of the hatching peak (n = 40, Pearson correlation, r = 0.55, P < 0.01). (D) Distribution of developmental stages of gregarious embryos on the seventh day was more concentrated than those of solitarious embryos. (E) Embryonic stages of the gregarious locusts were more uniform (SD comparison, n = 38, Levene’s test, P < 0.01), and more advanced (the mean developmental stage comparison, n = 38, Mann–Whitney U test, P < 0.01) than solitarious locusts. (F) The mean developmental stages were negatively correlated with the SD of developmental stages (n = 76, Pearson correlation, r = –0.77, P < 0.01). The data are shown as mean ± SEM, *P < 0.05, **P < 0.01.
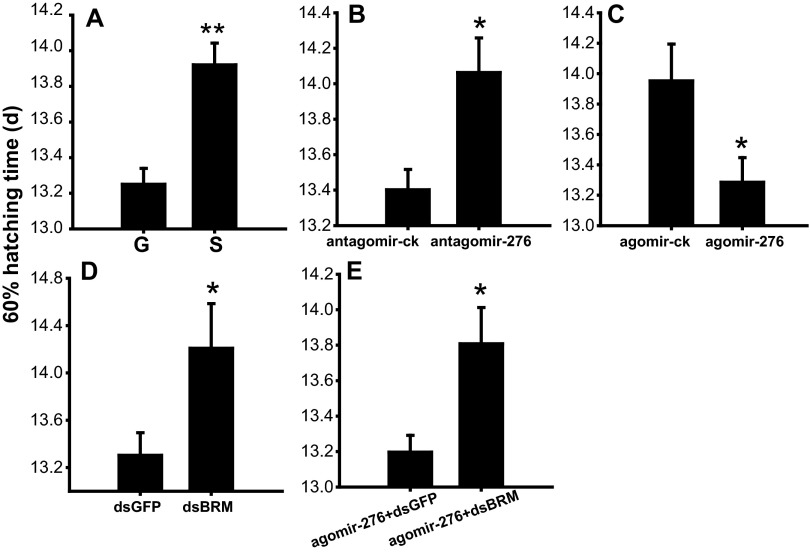
To compare the hatching speeds of gregarious and solitarious eggs, we applied probit regression analysis between hatching time and cumulative hatching frequency. Evidently, gregarious eggs hatched faster than solitarious eggs because 60% hatching time of the former was ∼0.60 d shorter than the latter (Fig. 1B and Fig. S1A). In addition, the duration of hatching peak was positively correlated with 60% hatching time (r = 0.5) (Fig. 1C).
Fig. S1.
Sixty percent hatching time analysis. (A) Hatching time for 60% eggs from gregarious locusts (G) was significantly shorter than that from solitarious locusts (S) (n = 40). (B–E) Hatching time for 60% eggs was extended by miR-276 inhibition in the gregarious females (B), shortened by miR-276 overexpression in the solitarious females (C), extended by brm knockdown in the gregarious females (D), and delayed by brm knockdown in the solitarious females pretreated with agomir-276 (E) (n = 25). The data are shown as mean ± SEM, *P < 0.05, **P < 0.01.
Given that the egg-hatching time is closely related to embryonic development rate, we recorded the embryonic development stages. On the seventh day of egg development, most gregarious embryos were concentrated at the 23rd stage whereas those of solitarious embryos ranged from the 19th to 23rd stages (Fig. 1D). The SD of embryonic stages in the gregarious locusts was 56% lower than that in solitarious locusts, and the mean developmental stages of the gregarious embryos were one stage advanced (Fig. 1E). Additionally, the mean embryonic developmental stages were negatively correlated with the SD of developmental stages (r = –0.77) (Fig. 1F).
Phase-Related Expression Patterns of miR-276 in Ovaries and Progeny Eggs.
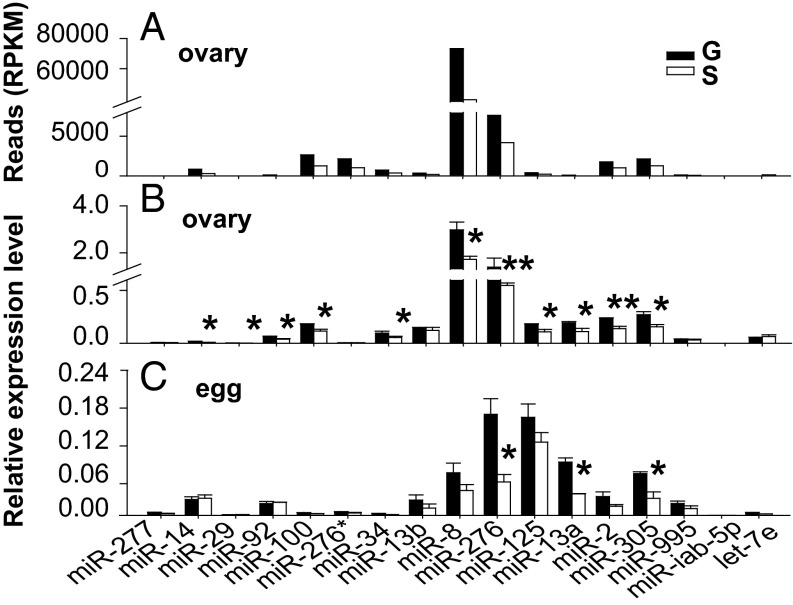
To identify maternal miRNAs putatively involved in the regulation of phase-related developmental synchrony of locust eggs, we performed high-throughput sequencing of small RNAs in the ovaries of female locusts. The expression patterns of the 17 miRNAs showing the largest fold changes between gregarious and solitarious locusts were validated by quantitative PCR (qPCR) (Fig. 2 A and B and Table S1). We found that miR-276 was one of the most prominent miRNAs up-regulated in the ovaries of gregarious locusts (Fig. 2B and Table S1) and that its expression was threefold higher in eggs from gregarious locusts than those from solitarious locusts (Fig. 2C and Table S1). This expression pattern suggests a potential role of maternal miR-276 in regulating phase-related developmental characteristics of progeny eggs.
Fig. 2.
miRNA expressions in ovaries and eggs from gregarious (G) and solitarious (S) locusts. (A and B) Comparison of miRNAs in ovaries between gregarious and solitarious locusts by high-throughput sequencing (A) and qPCR (B). RPKM, reads per kilobase per million mapped reads. (C) Expression levels of differentially expressed miRNAs in ovaries were determined in eggs from gregarious and solitarious locusts by qPCR. The data are shown as mean ± SEM, *P < 0.05, **P < 0.01, n = 6.
Table S1.
The comparison of miRNA expression levels between gregarious and solitarious ovaries/eggs by high-throughput sequencing and qPCR
| miRNA name | Sequence (5′–3′) | RNA-seq | qPCR | ||||
| Ovary | Ovary | Egg | |||||
| Fold change (G/S) | P value | Fold change (G/S) | P value | Fold change (G/S) | P value | ||
| miR-277 | UAAAUGCACUAUCUGGUACGACA | 3.07 | 0.00E+00 | 1.35 | 0.06 | 1.65 | 0.30 |
| miR-14 | UCAGUCUUUUUCUCUCUCCUAU | 2.78 | 2.02E−25 | 1.71 | 0.04 | 0.93 | 0.78 |
| miR-29b | UAGCACCAUUUGAAAUCAGU | 2.37 | 0.00E+00 | 2.29 | 0.04 | 1.15 | 0.85 |
| miR-92 | UAUUGCACUUGUCCCGGCCUAU | 2.11 | 1.16E−32 | 1.58 | 0.04 | 0.90 | 0.60 |
| miR-100 | AACCCGUAGAUCCGAACUUGUGA | 2.05 | 9.24E−71 | 1.51 | 0.02 | 1.52 | 0.29 |
| miR-276* | AGCGAGGUAUAGAGUUCCUACG | 2.04 | 0.00E+00 | 1.00 | 0.90 | 1.26 | 0.59 |
| miR-34 | UGGCAGUGUGGUUAGCUGGUUG | 1.96 | 0.00E+00 | 1.77 | 0.05 | 3.53 | 0.07 |
| miR-13b | UAUCACAGCCAUUUUUGACGAGUU | 1.92 | 0.00E+00 | 1.16 | 0.46 | 2.08 | 0.06 |
| miR-8 | UAAUACUGUCAGGUAACGAUGUC | 1.80 | 0.00E+00 | 1.52 | 0.03 | 1.72 | 0.14 |
| miR-276 | UAGGAACUUCAUACCGUGCUCU | 1.77 | 0.00E+00 | 2.54 | 0.01 | 3.02 | 0.03 |
| miR-125 | UCCCUGAGACCCUAACUUGUGA | 1.75 | 0.00E+00 | 1.62 | 0.03 | 1.34 | 0.10 |
| miR-13a | UAUCACAGCCACUUUGAUGAGC | 1.70 | 0.00E+00 | 1.74 | 0.04 | 2.47 | 0.02 |
| miR-2a | UAUCACAGCCAGCUUUGAUGA | 1.68 | 6.67E−63 | 1.69 | 0.01 | 2.06 | 0.08 |
| miR-305 | AUUGUACUUCAUCAGGUG | 1.63 | 0.00E+00 | 1.73 | 0.02 | 2.45 | 0.03 |
| miR-995 | UAGCACCACAUGAUUCAGCUUA | 1.62 | 0.00E+00 | 1.09 | 0.80 | 1.75 | 0.26 |
| let-7e | UGAGGUAGUAGGUUGUUUAGUU | 0.66 | 4.81E−76 | 0.82 | 0.54 | 1.70 | 0.17 |
| miR-iab-4–5p | ACGUAUACUGAAUGUAUCCU | 0.36 | 1.46E−38 | 0.81 | 0.64 | 1.14 | 0.70 |
miR-276 Mediates Hatching Synchrony and Development Rate of Eggs.
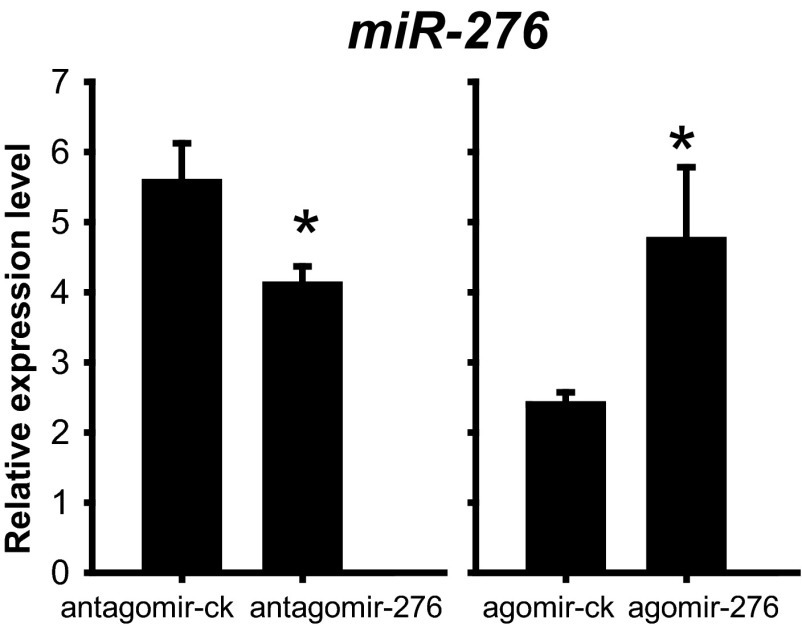
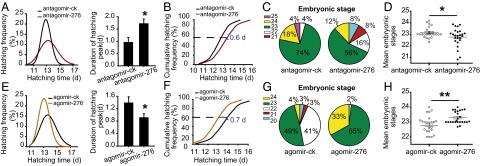
To decipher the role of miR-276 in differential development traits of eggs between gregarious and solitarious locusts, we inhibited miR-276 in gregarious females by injecting antagomir-276 and overexpressed it in solitarious females by injecting agomir-276. With a 26% decrease in the expression of miR-276 in the ovaries (Fig. S2), treatment with antagomir-276 resulted in a 17% increase in the SD of progeny egg-hatching time, an 80% increase in the duration of hatching peak (Fig. 3A), and a 0.60-d delay of the hatching time for 60% of eggs (Fig. 3B and Fig. S1B). Correspondingly, eggs on the seventh day from the antagomir-276–injection females ranged from the 20th to the 24th embryonic stage whereas eggs from the antagomir-ck (antagomir-control)-injected females were mainly at the 23rd embryonic stage (Fig. 3C). A 75% increase in the variation and half a stage delay of the embryonic developmental stages were presented after miR-276 inhibition (Fig. 3D). Conversely, agomir-276 injection doubled the miR-276 expression in the ovaries (Fig. S2) and led to more synchronous and faster egg hatching relative to agomir-ck (agomir-control): the hatching time curve was narrowed and the SD of hatching time decreased by 21% (Fig. 3E); the duration of hatching peak shortened by 34% (Fig. 3E); and the hatching time for 60% of progeny eggs was 0.70 d ahead (Fig. 3F and Fig. S1C). Additionally, the embryonic developmental stages of the seventh-day eggs from agomir-276–injection females were less variable (Fig. 3G). Agomir-276 injection resulted in a 40% decrease in the SD and half a stage advance of the embryonic stages (Fig. 3H). Thus, miR-276 promotes the synchrony of egg development, while shifting egg-hatching traits toward those characteristics of gregarious locusts.
Fig. S2.
The relative expression level of miR-276 was significantly decreased or increased by antagomir-276 or agomir-276 injection (n = 5). The data are shown as mean ± SEM, *P < 0.05.
Fig. 3.
miR-276 promotes synchrony of egg development in the locusts. (A–D) The effects of miR-276 antagomir in gregarious females on the progeny egg-hatching time (A) (in the normal curve, n = 1,320; comparison of SD of hatching time, Levene’s test, P < 0.01; comparison of duration of hatching peak, n = 24), hatching speed (B), and distribution of embryonic stages (C and D) (n = 25, SD comparison, Levene’s test, P = 0.05; the mean developmental stages comparison, Mann–Whitney U test, P = 0.05). (E–H) The effects of miR-276 overexpression in solitarious females on the progeny egg-hatching synchrony (E) (in the normal curve, n = 978; SD comparison, Levene’s test, P < 0.01; duration of hatching peak comparison, n = 21), hatching speed (F), and the embryonic development (G and H) (n = 24, SD comparison, Levene’s test, P = 0.05; the mean developmental stages comparison, Mann–Whitney U test, P < 0.01) in solitarious females. The data are shown as mean ± SEM, *P < 0.05, **P < 0.01.
Target Identification of miR-276.
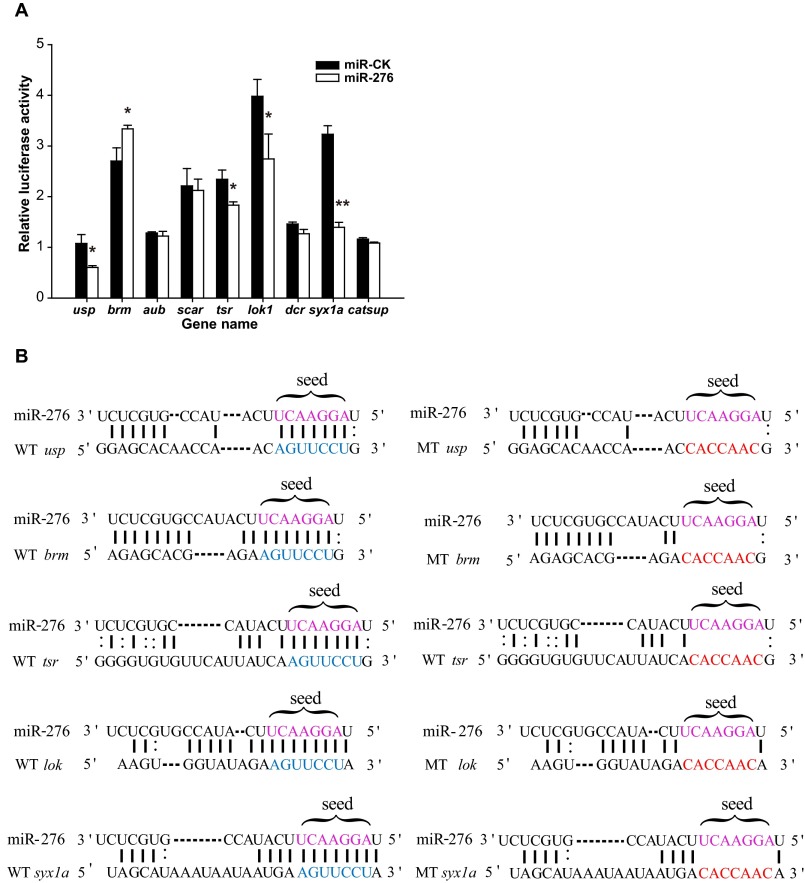
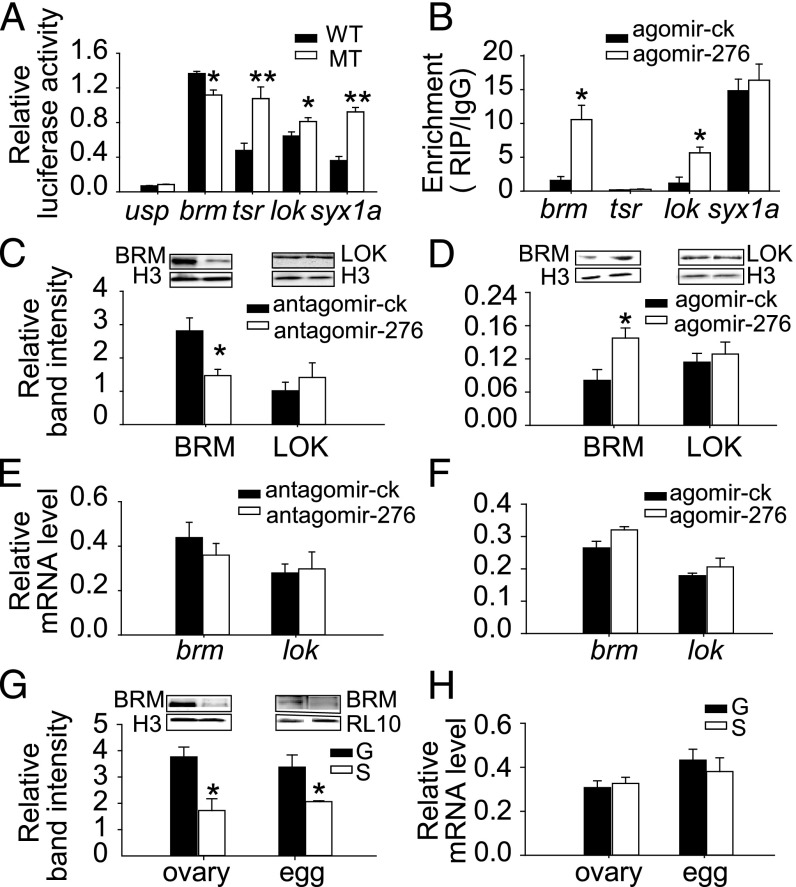
To explore the molecular mechanism by which maternal miR-276 regulates egg-hatching synchrony, we predicted its targets using the algorithms miRanda (30) and RNAhybrid (31). Several genes enriched in pathways related to gamete generation (including usp, brm, aub, scar, tsr, lok, dcr, syx1a, and catsup) were predicted as miR-276 targets by both algorithms (Table S2). The direct interactions between miR-276 and putative target genes were verified by luciferase assays in Drosophila S2 cells. Luciferase activities from constructs containing the usp, tsr, lok, and syx1a target sites were decreased significantly by miR-276 whereas that of the construct with brm target sites was up-regulated 1.23-fold by miR-276 (Fig. S3A). Furthermore, mutations in the binding site of the miR-276 seed sequence (Fig. S3B) abolished the suppression or up-regulation effect of miR-276 on the reporters with target sites from tsr, lok, and syx1a or brm (Fig. 4A).
Table S2.
Candidate target genes of miR-276
| Gene symbol | Location of target sites | Gene function |
| usp | 3′ UTR | Ecdysteroid hormone receptor activity, juvenile hormone binding |
| brm | CDS | Oogenesis, chromatin-mediated maintenance of transcription, cell cycle regulation |
| aub | 3′ UTR | Oogenesis, oocyte maturation, piRNA binding |
| scar | 3′ UTR | Epithelial fusions in the embryo |
| tsr | 3′ UTR | Mitotic cytokinesis, female gonad development |
| dcr | 3′ UTR | Pre-miRNA processing |
| lok | 3′ UTR | Germ cell development, apoptotic process, DNA damage checkpoint |
| Syx1A | 3′ UTR | Mitotic cytokinesis, a regulation of pole, plasm oskar mRNA localization, synaptic transmission |
| catsup | 3′ UTR | Ovarian nurse cell to oocyte transport |
piRNA, Piwi-interacting RNA.
Fig. S3.
Interaction between miR-276 and its putative targets. (A) Results of luciferase vectors carrying target site cotransfection with miR-276 overexpression vector compared with miRNA control (miR-ck) overexpression vector in S2 cells (n = 6). The data are shown as mean ± SEM, *P < 0.05, **P < 0.01. (B) Sequence alignment of miR-276 with the predicted target sites in the 3′ UTR of usp, tsr, lok, and syx1a and the coding region of brm. The point mutations (red) in the putative target sites were engineered in the region complementary to the miR-276 seed sequence (purple). The WT sequences of those point mutations are indicated in blue.
Fig. 4.
miR-276 up-regulates brm expression by direct targeting. (A) Luciferase reporter assays in S2 cells cotransfected with miR-276 overexpression vectors and psi-CHECK2 vectors containing wild (WT) or mutant (MT) sequences of target genes (n = 6). (B) Target verification by RIP analysis using the anti-Ago1 antibody in the ovaries of locusts injected with agomir-276 or agomir-ck (n = 4). (C–F) The protein (C and D) and mRNA (E and F) expression changes of brm and lok after miR-276 inhibition in gregarious or overexpression in solitarious ovaries (n = 5). (G and H) The protein (G) and mRNA (H) levels of brm in ovaries and eggs of gregarious (G) and solitarious (S) locusts (n = 5). The data are shown as mean ± SEM, *P < 0.05, **P < 0.01.
To exert the regulation role posttranscriptionally, miRNAs recruit RNA-induced silencing complexes (RISCs) to the target RNAs through RNA-binding proteins, like Argonaute (Ago) proteins. Thus, we assessed the interaction between Ago and each of the four genes in vivo by RNA immunoprecipitation (RIP) assays using ovaries from locusts injected with agomir-276 or agomir-ck. Only brm and lok were enriched in Ago1-immunoprecipitated compounds from agomir-276–treated ovaries compared with agomir-ck–treated ovaries (Fig. 4B). Moreover, the level of BRM reduced by 48% after miR-276 inhibition and increased twofold by miR-276 overexpression whereas the level of LOK was not altered (Fig. 4 C and D). However, neither the mRNA expression of brm nor that of lok was changed significantly by miR-276 (Fig. 4 E and F). Therefore, these results suggest that brm, but not lok, is regulated by miR-276 in the ovaries of locusts. Correspondingly, the level of BRM was 2.18-fold and 1.20-fold higher in gregarious ovaries and eggs than in solitarious ovaries and eggs, respectively (Fig. 4G), whereas the mRNA expression of brm did not show significant differences (Fig. 4H). The same pattern of BRM as miR-276 (Fig. 2 B and C) suggests positive regulation of BRM by miR-276 in vivo.
brm Mediates miR-276–Regulated Synchronous Egg Hatching.
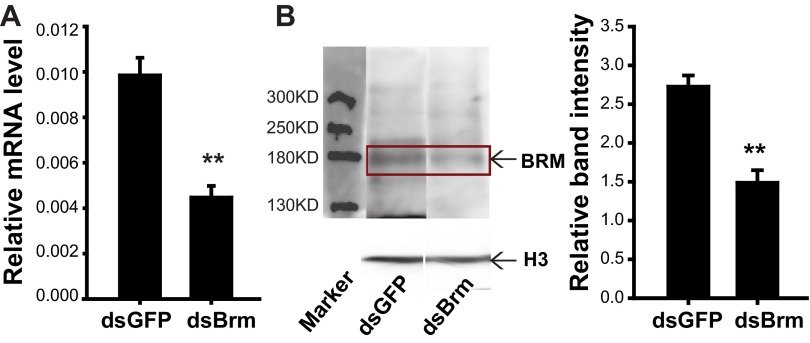
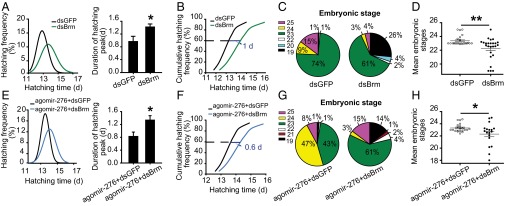
To demonstrate the role of brm in egg developmental traits, we knocked it down by injecting double-strand RNAs (dsRNAs) in gregarious females due to higher BRM level in gregarious locusts than the solitarious locusts (Fig. 4G). The mRNA and protein levels of brm decreased by 55% and 45%, respectively, by dsBrm injection in the ovaries (Fig. S4). With a 40% increase in the SD of egg-hatching time, a 47% extension in the time length of hatching peak (Fig. 5A), and a 1-d delay in the time for 60% egg hatching (Fig. 5B and Fig. S1D), dsBrm injection induced comparatively heterochronic and slow hatching of progeny eggs relative to dsGFP injection. Consistently, the embryonic development of seventh-day eggs from dsBrm-injected females was more variable (Fig. 5 C and D) and was delayed by one stage (Fig. 5D).
Fig. S4.
Examination of brm RNAi efficiency and validation of antibody against BRM protein. Relative mRNA(A) and protein (B) level of brm in gregarious ovaries were significantly reduced after injection with dsRNA. The arrow indicates the expected size (about 180 kDa) band (n = 6). The data are shown as mean ± SEM, *P < 0.05.
Fig. 5.
brm is required for the miR-276–mediated synchrony of egg development. (A–D) The effects of brm knockdown on progeny egg-hatching time (A) (in the normal curve, n = 1,018; SD comparison, Levene’s test, P < 0.01; comparison of the duration of hatching peak, n = 20), hatching speed (B), embryonic development (C and D) (n = 25, SD comparison, Levene’s test, P < 0.01; the mean developmental stage comparison, Mann–Whitney U test, P < 0.01) in gregarious locusts. (E–H) The effects of miR-276 overexpression on progeny egg-hatching time (E) (in the normal curve, n = 840; SD comparison, Levene’s test, P < 0.01; comparison of the duration of hatching peak, n = 18), hatching speed (F), and embryonic development (G and H) (n = 20; SD comparison, Levene’s test, P < 0.01; comparison of the mean developmental stages, Mann–Whitney U test, P = 0.04) were blocked by dsBrm injection in solitarious locusts. The data are shown as mean ± SEM, *P < 0.05, **P < 0.01.
To determine whether miR-276–mediated brm up-regulation was responsible for synchronous and advanced egg development, we knocked down brm after agomir-276 injection in solitarious females. The results showed that dsBrm injection caused the SD of hatching time of eggs laid by females pretreated with agomir-276 to increase by 19% (Fig. 5E), the duration of hatching peak to increase by 60% (Fig. 5E), and the time for 60% egg hatching to delay by 0.60 d compared with dsGFP injection (Fig. 5F and Fig. S1E). Correspondingly, the phenotype of embryonic developmental stages induced by agomir-276 was rescued by dsBrm injection (Fig. 5 G and H). Therefore, brm was required for miR-276 controlled synchronized and accelerated development of locust eggs.
The Mechanism Underlying miR-276–Mediated Up-Regulation of brm.
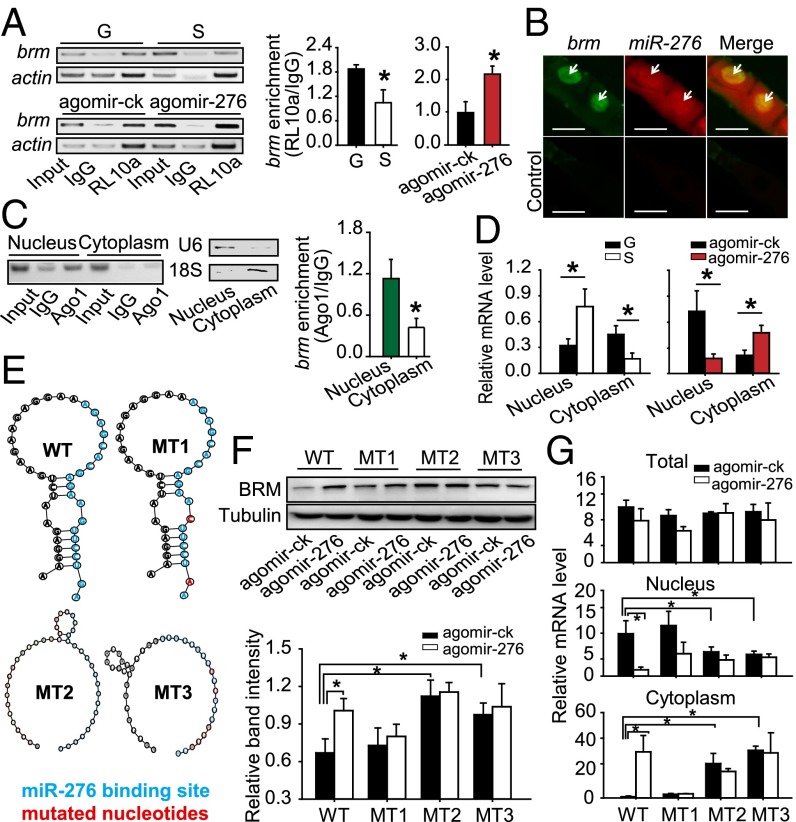
The results above raised the question of how miR-276 up-regulates, rather than down-regulates, BRM levels without changing its mRNA expression. To test whether miR-276 enhanced the translation efficiency of brm, we measured the binding level of brm mRNA with ribosomal protein L10a (RL10a) (a component of the 60S subunit of the ribosomes). The enrichment of brm mRNA in RL10a was 1.79-fold higher in the gregarious ovaries than that in the solitarious ovaries and was increased 1.19-fold in solitarious ovaries by miR-276 overexpression (Fig. 6A), indicating that miR-276 boosted the loading of brm to the ribosomes. Incorporation of mRNAs into ribosomes necessitates efficient nuclear exportation of mRNAs. Double fluorescence in situ hybridization (FISH) of ovary showed that miR-276 and brm colocalized in the nuclei of oocytes (Fig. 6B). In addition, enrichment of brm in immunoprecipitated Ago1 complexes occurred mainly in the nucleus rather than in the cytoplasm (Fig. 6C). Nuclear brm RNA was lower, but cytoplasmic brm RNA was higher in gregarious ovaries compared with solitarious ovaries, and nuclear brm RNA was decreased whereas cytoplasmic brm RNA was increased significantly in solitarious ovaries by miR-276 overexpression (Fig. 6D). Collectively, these results supported the view that binding of miR-276 to brm in Ago1-containing complexes facilitated the transportation of brm from nucleus to cytoplasm, thus promoting the translation of brm.
Fig. 6.
Up-regulation of brm by miR-276 is dependent on the stem-loop structure of brm RNA. (A) RIP assay for the binding of brm to RL10a (n = 5). (B) Double FISH for miR-276 and brm in locust ovaries. Green, brm; red, miR-276; yellow, colocalization of miR-276 and brm. Arrows indicate the locations of miR-276 or brm. (Scale bars: 50 µm.) (C) RIP assays of the nuclear and cytoplasmic fractions of gregarious ovaries with antibody to Ago1. The enrichment of brm mRNA was quantified by semi-RT-PCR (Left) or qPCR (Right) (n = 6). U6 was used as a nuclear marker and 18S rRNA as a cytoplasmic marker. (D) The nuclear or cytoplasmic brm RNA level in gregarious (G) and solitarious (S) ovaries (Left) or solitarious ovaries injected with agomir-276 and agomir-ck (Right) (n = 5). (E) The predicted secondary structures of WT and mutated (MT) brm RNAs: MT1, the stem-loop is intact but the miR-276 binding site is mutated; MT2, the stem-loop is impaired but the binding site is intact; MT3, both the binding site and stem-loop are mutated. (F) The effects of miR-276 on BRM levels in S2 cells. Anti-V5 antibody was used to detect to BRM level, and antibody for β-tubulin was used as endogenous control (n = 5). (G) The nuclear, cytoplasmic, and total mRNA expressions of brm in S2 cells cotransfected with agomir-276 and the constructs containing WT/MT brm sequence (n = 4). The data are shown as mean ± SEM, *P < 0.05.
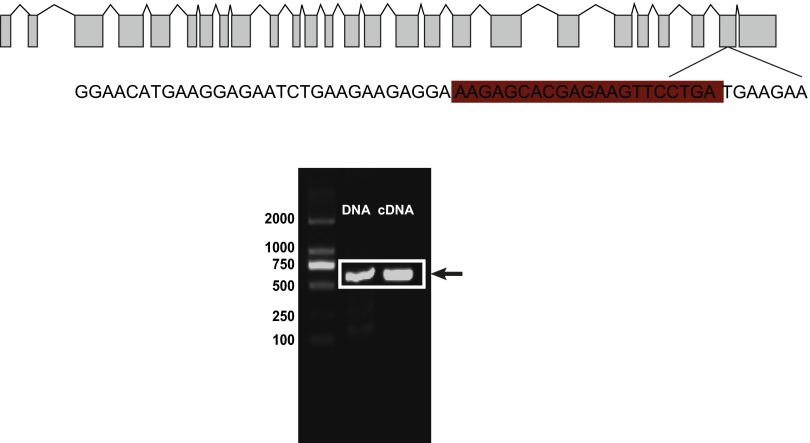
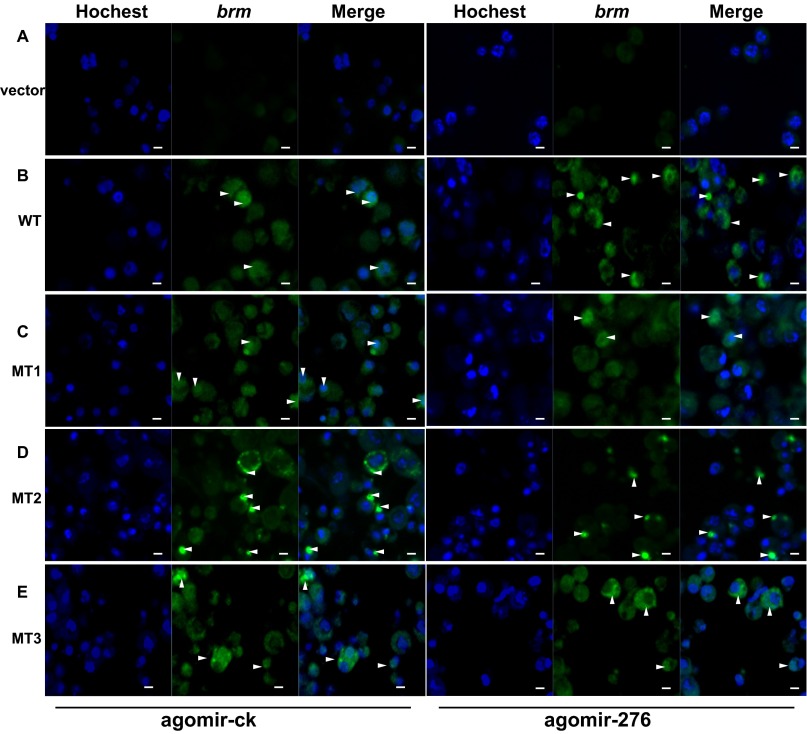
Several factors, in addition to the subcellular transportation, could also affect the translation efficiency of mRNAs, including 5′ cap addition, splicing, and polyadenylation (32), codon use, and mRNA folding structure (33). Because the miR-276 target site was located at a nonsplice site in the coding region of brm (Table S2 and Fig. S5), miR-276 should not affect 5′ and 3′ end modification or splicing of pre-mRNA. We noticed that the sequence around the miR-276 target site of brm was predicted to harbor a stem-loop structure (Fig. 6E). To determine the effects of miR-276 on the stem-loop, V5-tagged constructs fused with various RNA structural forms (Fig. 6E) of full-length brm sequences, were transfected into S2 cells. Compared with the WT, the BRM level was up-regulated significantly by abolishing the stem-loop (MT2 and MT3) rather than mutating the binding site of miR-276 (MT1) (Fig. 6F), indicating that the stem-loop hindered the translation of brm. In the presence of miR-276, brm was activated only when both the stem-loop and the binding site were intact (WT) (Fig. 6F). Moreover, compared with WT, the nuclear and cytoplasmic brm mRNA was reduced and increased, respectively, by impairing the stem-loop (Fig. 6G). miR-276 decreased nuclear brm but elevated cytoplasmic brm only in the cells transfected with the WT plasmid without altering the total brm level (Fig. 6G and Fig. S6). Thereafter, we deduced that miR-276 diminished the stem-loop structure of brm RNA, thereby enhancing the nuclear exportation and translation of brm RNA.
Fig. S5.
The miR-276 target site was located within a nonsplice site in the coding region of brm. The PCR products from the cDNA and DNA were the same length, thus, the site was not located at the splicing site of pre-mRNA. The binding site of miR-276 is highlighted.
Fig. S6.
The FISH experiment for brm location in the S2 cell. (A) Control cells mock transfected with empty vectors. (B) In cells transfected with WT, most brm transported to the cytoplasm in the presence of agomir-276, compared with the results of agomir-ck. (C) For cells transfected with MT1, a substantial portion of brm accumulated in the nucleus either in the presence of agomir-276 or not. (D and E) For cells transfected with MT2 (D) or MT3 (E), most of the brm RNAs transported to the cytoplasm either in the presence of agomir-276 or not. The arrow indicates the location of brm. (Scale bars: 5 μm.)
Discussion
The current study shows that the time distributions of progeny egg hatching varies in response to the population density encountered by parent locusts and that this change in synchrony is regulated by differentially expressed miRNAs between gregarious and solitarious ovaries. Probably, crowding stimuli including the stress of high population density and emission of aggregative pheromone may induce signal transduction from neural system to reproductive system. Moreover, the crowding stimuli may increase maternal miR-276 expression in the ovaries to promote developmental synchrony of the embryos by up-regulating transcriptional coactivator BRM through alteration of the stem-loop structure of brm mRNA. Our studies discover a previously unidentified mechanism by which miRNA promotes the expression of its target and provide an important cue for the regulation of egg-hatching synchrony by noncoding RNAs in locusts as an adaptive response to population density changes.
Developmental synchrony is a strategy for gregarious locusts to adapt to variable environments. The egg-hatching synchrony in the gregarious phase of the migratory locust is consistent with the desert locust, whose synchronous egg laying and hatching can be induced by rain in the field (34). Additionally, it has been proposed that synchronous male sexual maturation in both species (18) may ensure concurrent mating, migration, and oviposition, and possibly further synchrony in progeny development (35). Hatching synchrony, as an adaptive strategy of animals, often induces similar behavior (36) and promotes emergence synchrony of juvenile and group migration to reduce the risk of predation (7).
The molecular mechanisms of synchronous development in gregarious locusts had been largely unexplored before this study, even if the hormones may control the synchronous male sexual maturation of locusts (18, 35). We have demonstrated that miR-276 in ovaries exerts a crucial role in mediating hatching synchrony of progeny eggs by up-regulating brm. Maternal miRNAs have an impact on germ cells and early embryo development in many organisms (27–29), and miRNAs often stabilize development processes against environmental perturbations by switching and tuning the target genes (15) or by forming networks with key transcription factors (TFs) (16). Meanwhile, TFs themselves are important mediators of development robustness (37). As an important transcription coactivator that cooperates with TFs (38), BRM is essential for the activation of homeotic genes to control early embryonic morphogenesis in Drosophila (39). Lack of brm results in nucleosome disorganization and subsequent transcription perturbations (40). Logically, miR-276 may maintain the early embryonic developmental homeostasis via modulating a suite of downstream genes of brm.
As important posttranscriptional regulators, miRNAs usually suppress the target genes by triggering mRNA degradation or translational repression (41, 42). Occasionally, miRNAs can up-regulate gene expression. For example, miR-369-3 activates the sequence elements rich in adenosine and uridine (AU-rich elements) by removing them from the GW182/P body and recruiting the translation activator protein (43). miR-328 up-regulates CEBPA by releasing it from heterogeneous ribonucleoprotein-meditated translation inhibition (44). miR-373 induces the transcription of E-cadherin by targeting the promoter sequences (45). The nuclear entry of miRNA is necessary for the up-regulation of genes in some cases (46), probably because nuclear events such as pre-mRNA processing and nuclear exportation of mRNA conduce to gene translation (32). Our results show that miR-276 colocalizes with brm RNA in the nucleus of the oocyte and promotes nuclear exportation of brm. The promoting effects may be caused by miR-276–mediated unwinding of the stem-loop in brm RNA. In concert with this deduction, the involvement of helicases in the nuclear export-competent RNA ribonucleoprotein (47) hints at the need of unwinding the stem-loop for the nuclear exportation of mRNAs. Moreover, impairment of the stem-loop may eliminate the inhibitory effect of the mRNA secondary structure on the translation elongation (48, 49). Collectively, our results point to a previously unidentified mechanism by which miRNA up-regulates gene expression depending on the stem-loop structure of the target mRNA.
Materials and Methods
Detailed methods are in SI Materials and Methods.
Recording Insect Rearing and Hatching.
Gregarious (400 insects per case) and solitarious (individual) locusts were reared under a 14:10 light:dark cycle at 30 ± 2 °C (19). Egg pods were collected three times a day and incubated at 30 °C. The hatching larvae numbers were recorded three times a day. The embryonic stages were divided as previously suggested (50).
High-Throughput Sequencing of Small RNA.
The abdomens of the sexually mature females were vertically opened, and the ovaries were separated from other tissues. Small RNAs (18–35 nt) of ovaries were sequenced at the BGI–Shenzhen as described previously (21). The small RNA libraries were deposited in the Sequence Read Archive database (accession no. SRP056610).
qPCR of miRNA and mRNA.
Total RNA was isolated from the ovaries or eggs by TRIzol (Invitrogen). The relative expression of miRNAs and mRNAs was, respectively, quantified by an miRcute miRNA qPCR Detection Kit (Tiangen) and a Real Master Mix Kit (Tiangen) with a LightCycler 480 instrument (Roche). Six biological replicates were used for statistical analysis. U6 snRNA and beta-actin were used as endogenous controls for miRNAs and mRNAs, respectively. The qPCR primers are listed in Table S3.
Table S3.
Primers used in the study
| Primer name | Sequence (5′ to 3′) |
| Primers used for qPCR | |
| U6-F | ACACTCCAGCTGGGTCAAAATCGTGAAGCG |
| U6-R (for nuclear marker) | CTCAAGTGTCGTGGAGTCGGCAA |
| miR-277-F | ACACTCCAGCTGGGTAAATGCACTATCTGG |
| miR-14-F | ACACTCCAGCTGGGTCAGTCTTTTTCTCTC |
| miR-29-F | ACACTCCAGCTGGGTAGCACCATTTGAAAT |
| miR-92-F | ACACTCCAGCTGGGTATTGCACTTGTCCCG |
| miR-100-F | ACACTCCAGCTGGGAACCCGTAGATCCGAA |
| miR-276*-F | ACACTCCAGCTGGGAGCGAGGTATAGAGTT |
| miR-34-F | ACACTCCAGCTGGGTGGCAGTGTGGTTAGC |
| miR-13b-F | ACACTCCAGCTGGGTATCACAGCCATTTTT |
| miR-8-F | ACACTCCAGCTGGGTTAATACTGTCAGGTA |
| miR-276-F | ACACTCCAGCTGGGTAGGAACTTCATACCG |
| miR-125-F | ACACTCCAGCTGGGTCCCTGAGACCCTAAC |
| miR-13a-F | ACACTCCAGCTGGGTATCACAGCCACTTTGA |
| miR-2-F | ACACTCCAGCTGGGTATCACAGCCAGCTTTG |
| miR-305-F | ACACTCCAGCTGGGATTGTACTTCATCAGGT |
| miR-995-F | ACACTCCAGCTGGGTAGCACCACATGATTCA |
| miR-iab-4–5p-F | ACGTATACTGAATGTATCCT |
| let-7e-F | TGAGGTAGTAGGTTGTTTAGTTAA |
| brm-F | AGCGTCTTTGATTCACGAGGA |
| brm-R | ACTTCTCGTGCTCTTTCCTCT |
| tsr-F | AAACTGCTTTGCCCGTGATG |
| tsr-R | AGTTTAATAACGCCAACAGGC |
| lok-F | CAAGTTGATGTTTGGAGCCT |
| lok-R | GTACCGTGTTGGGAAGGAG |
| syx1a-F | CCAGGGAGAAATGATAGACC |
| syx1a1-R | GATGACTACTACGAGGCAGA |
| beta-actin-F | AATTACCATTGGTAACGAGCGATT |
| beta-actin-R | TGCTTCCATACCCAGGAATGA |
| 18S-F | ATGCAAACAGAGTCCCGACCAGA |
| 18S-R | GCGCAGAACCTACCATCGACAG |
| brm-S2-F | ACTGAAGAATACTACTCGCAA |
| brm-S2-R | AGAATCGAGACCGAGGAGA |
| rp49-S2-F | CCATAGTTGCCTGACTCCC |
| rp49-S2-R | GATGGAGGCGGATAAAGTTG |
| Primers used for RNA interference | |
| RNAi-GFP-F | CACAAGTTCAGCGTGTCCG |
| RNAi-GFP-R | GTTCACCTTGATGCCGTTC |
| RNAi-Brm-F | CACCACTCCCATAGTCCAAC |
| RNAi-Brm-R | TGCTGAGATGCCGAAGGACA |
| Primers used for probe synthesis of brm | |
| SP6-brm-F | GAATTGATTTAGGTGACACTATAGCTAGGTCCAAACCGCAAAT |
| T7-brm-R | GAATTGTAATACGACTCACTATAGGGGGTGACATTCCTGCCATAT |
F, forward primers; R, reverse primers.
miRNA Inhibition or Overexpression in Vivo.
Antagomir-276/ck or agomir-276/ck (RiboBio) was injected at the dorsal site near the locust ovary by using a nanoliter injector 2000 (World Precision Instruments).
Luciferase Reporter Gene Assays.
Luciferase assays were performed by using the Dual-Glo Luciferase Assay System (Promega) with a luminometer (Promega).
RNA Immunoprecipitation.
Monoclonal antibodies against locust Ago1 protein (24) or anti-RL10a (Santa Cruz) or the IgG control (Millipore) was applied for the RIP assay.
Western Blot.
Validation of antibody against BRM was analyzed (Fig. S4). Anti-Histone H3 (Sigma) and anti-RL10a were, respectively, used as endogenous control for protein samples of locust ovaries and eggs.
RNA Interference.
To knock down brm, each female was injected with 5 μg of dsRNAs every 5 d. After 24 h of injection with 0.1 nmol agomir-276, the females were injected with dsRNAs in the rescue experiments.
In Situ Fluorescence Hybridization.
Whole-mount double FISH in locust ovaries was performed by using a locked antisense nucleic acid (LNA) modified probe for miRNA labeled with double digoxigenin (Exiqon) and a brm RNA probe labeled with biotin.
Plasmid Construction and Transfection.
The secondary structures of WT and mutated full-length brm RNAs were predicted by RNAstructure software (51). The wild or mutated sequences were cloned into the PAC-5.1/V5-HisB (Invitrogen) and transfected into S2 cells along with agomir-276 or agomir-ck.
Statistical Analysis.
Levene’s test was used for SD comparison. A Student’s t test and Mann–Whitney U test were used for two-group comparisons. All statistical analyses were performed by SPSS 17.0 software. If P < 0.05, the differences were considered statistically significant.
SI Materials and Methods
Insect Rearing and Embryonic Stage Statistics.
All insects used in experiments were reared in the same locust colonies at the Institute of Zoology, Chinese Academy of Sciences, Beijing. Gregarious locusts were reared at a density of about 400 insects per case. Solitarious locusts were cultured alone in small metal cages. Egg pods were collected three times a day, and each egg pod was put in one cup. The eggs were taken out of the sand after they had been incubated for 7 d at 30 °C and then washed in 0.08% sodium hypochlorite solution; next, they were detected under a microscope (Leica DFC490). The developmental stages were identified according to the criteria reported previously (50). Eggs in one cup were regarded as one biological repeat for the statistics of 60% hatching day, hatching peak duration, and embryonic stages.
High-Throughput Sequencing of Small RNA.
Ovary samples were from sexually mature female locusts. The abdomens of the females were vertically opened, and the ovaries were carefully separated from other tissues. Then the ovaries were washed in cold locust saline and quickly put into liquid nitrogen. Four ovaries were pooled together as one biological replicate for RNA extraction. Small RNA libraries from gregarious and solitarious locusts contained one biological replicate, respectively. Small RNAs (18–35 nt) were sequenced by an Illumina Genome Analyzer IIx sequencing system at the BGI–Shenzhen as described previously (21). The P values were calculated by using Bayesian algorithms (52).
Antagomir, Agomir, and dsRNA Injection.
Antagomir-276 is a chemically modified single-strand stable miR-276 inhibitor whose sequence is reverse complementary to mature miR-276. Agomir-276 is a chemically modified double-strand stable miR-276 mimic. The sequence of a Caenorhabditis elegans miRNA, cel-miR-67-3p (5′ to 3′: UCACAACCUCCUAGAAAGAGUAGA), was used as the negative control of antagomir or agomir (antagomir-ck or agomir-ck). Double-strand RNA of brm (dsBrm) was used to knock down brm expression, and double-strand RNA of green fluorescent protein (dsGFP) was used as the negative control. dsRNAs were synthesized by using the T7 RiboMAX Express RNAi system (Promega). Female locusts were subjected to the first injection at the end of the fifth instar and then were injected every 5 d (0.1 nmol per injection for miRNA antagomir or agomir and 5 μg per injection for dsRNAs). After the third injection, the female locusts were either killed for RNA isolation or mated with male locusts. All injections were performed by using a nanoliter injector 2000 (World Precision Instruments) at the dorsal site near the locust ovary. The primers for dsRNA synthesis are presented in Table S3.
In Vitro Luciferase Reporter Gene Assays.
The sequences around miR-276 binding sites (about 160 bp upstream and downstream flanks) of the putative target genes were inserted into the luciferase reporter vector psiCHECK-2 plasmid (Promega). An ∼400-bp pre–miR-276 centered on the genome sequence was cloned into the pAc5.1/V5-HisA vector (Invitrogen) as the overexpression vector. Site mutation (Fig. S4) in the binding site of the miR-276 seed sequence in brm complementary sequences to the “seed” sites was performed by the Fast Mutagenesis System (TransGen). A 20-ng portion of the luciferase reporter vector (WT or MT) was cotransfected with 80 ng of the miRNA expression vector into Drosophila S2 cells by Lipofect (Tiangen). The luciferase activities were detected at 45 h after transfection by using the Dual-Glo Luciferase Assay System (Promega) with a luminometer (Promega).
RIP Experiments.
The experiments were performed using a Magna RIP Quad Kit (Millipore). One biological duplication contained three to four ovaries. The ovaries were homogenized in ice-cold RIP lysis buffer and stored at −80 °C overnight for thorough tissue lysis. A 5-µg portion of Ago1/RL10a antibody or normal mouse IgG was incubated with magnetic beads for 30 min. Then, the lysate was thawed and centrifuged, and the supernatant was coincubated with the beads–antibody complex at 4 °C overnight. Meanwhile, 1/3 of the lysate was stored as “input” samples. Next, RNAs in the immunoprecipitates and input were extracted by TRIzol reagent (Invitrogen). A High Capacity RNA-to-cDNA Kit (ABI) was used for reverse-transcription. Then, qPCR was performed to analyze the expression levels of target genes. Input samples were used for normalization of the relative expression of mRNA and IgG controls were used for subtraction of the nonspecific interactions of RNA-Ago1 or RNA-RL10a.
Enrichment of brm RNA in Ago1 complex in nuclear and cytoplasmic fractions was tested by RIP assay of nuclear and cytoplasmic fractions separately as described (53), with slight modifications. The ovaries were homogenized in cold PBS containing 0.2% Nonidet P-40. The lysate was centrifuged at 30 × g for 2 min at 4 °C to remove the insoluble fragment of tissue. Then, the supernatant was centrifuged at 425 × g for 15 min at 4 °C. The nuclei were in the pellet whereas the cytoplasm remained in the supernatant. The cytoplasmic fraction was centrifuged at 2,000 × g for 10 min at 4 °C to remove the residual nuclei. The pellet was washed with buffer B [20 mM Tris⋅HCl, pH 8.0, 1.5 mM MgCl2, 0.2 mM EDTA, pH 8.0, 20 mM KCl, 25% (vol/vol) glycerol] several times and then was resuspended in five times the pellet volume of buffer B and 10 times the volume of buffer C [20 mM Tris⋅HCl, pH 8.0, 1.5 mM MgCl2, 0.2 mM EDTA, pH 8.0, 1.2 M KCl, 25% (vol/vol) glycerol]. The mixture was incubated for 45 min at 4 °C. Afterward, 10 times the volume of lysis buffer [150 mM NaCl, 6 mM MgCl2, 40 mM Hepes, pH 7.0, 2 mM DTT, 1 mM PMSF, 0.025% Nonidet P-40, 10% (vol/vol) glycerol] was added into the nuclear or cytoplasmic fraction. Subsequently, the two fractions were incubated with Ago1 antibody or IgG antibody overnight at 4 °C. RNA extraction and qPCR were performed as described.
Western Blot.
The sequences of BRM antibody epitopes are as follows: GVVTGPDLYRASGKFELLDRILPKLKATNHRVLLFCQMTQLMTIMEDYLSWRGFTYLRLDGTTKAEDRGDLLRKFNSPDSEFFLFLLSTRAGGLGLNLQAADTVIIFDSDWNPHQDLQAQDRAHRIGQQNEVRVLRLMTVNSVEERILVAARYKLNMDEKVIQAGMFDQKSTGSERQQFLQSILHQDEAEEEEENEVPDDDSVNHMIARNADELALFHRMDLERRREEAKLGPNRKSRLVEEAELPDWLVKDDDEVERWTFEEEEEDRYLGRGSRQRKEVDYSDSLTEKEWLKAIDEGGEEFEEEEEEEEEKLKKRTRKRRRKVEEEEEEESIPIQPKKRKSSSMSCTVDPQLKRRMRKLMNIVIKYTDSDGRVLSDPFMKLPSRRELPDYYEIIKKPLDIKKILQRIDENKFSDFDELEKEFMTLCKNAQTY. Polyclonal antibody for BRM was produced from mouse. Total proteins were extracted by TRIzol reagent (Invitrogen). The proteins were subjected to polyacrylamide gel (8%) electrophoresis and then transferred to polyvinylidene difluoride (PVDF) membranes (Millipore). Blocking was performed in 5% (wt/vol) skimmed milk at room temperature for 1 h. The membranes were incubated with primary antibody (anti-BRM, 1:500; anti-LOK, OriGene, 1:500; anti-Histone H3, Sigma, 1:2,000; anti-RL10a, Santa Cruz, 1:500; anti-V5, Invitrogen, 1:5,000) in 5% (wt/vol) skimmed milk at 4 °C overnight. Secondary antibody (1:5,000) (CoWin) was incubated at room temperature for 1 h. Detection for the immunological blot was carried out by an eECL Western Blot Kit (CoWin). Densitometric analysis of the band was performed by Quantity One software.
In Situ Fluorescence Hybridization.
A double FISH experiment was performed according to a method that was described previously (54). The RNA probe for brm was synthetized by a T7/SP6 RNA Transcription Kit (Roche) and was subsequently fragmented to about 250 bp by carbonate buffer. The primers used for probe synthesis of brm are in Table S3. Ovarioles were separated from ovaries in locust saline and fixed in 4% (wt/vol) paraformaldehyde overnight. After digestion with proteinase K (20 μg/mL; Tiangen) at 37 °C for 15 min, these ovaries were hybridized with miRNA probe (2 pmol/mL) and brm probe (5 ng/μL) at 37 °C overnight. Then, the ovarioles were successively washed in 2× SSC, 1× SSC, and 0.2× SSC at 37 °C. Anti-DIG alkaline phosphatase-conjugated antibody (1:500) and anti-biotin antibody (1:100) were used for probe detection. Then, the fluorescent signal of digoxigenin (DIG) or biotin was obtained by HNPP/Fast Red or Fluorescein-Tyramide (Perkin-Elmer). Images were captured on an LSM 710 confocal fluorescence microscope (Zeiss) at a magnification of 20×. For detection of brm RNA distribution in the S2 cells, the cells were cultured on coverslips (Citoglas) and then transfected as described above. After 45 h, FISH experiments were carried out as previously described (55), with slight modifications. The images of S2 cells were captured at a magnification of 63×.
Assays for the in Vitro Protein Expression.
Full-length WT or mutated sequences were cloned into the PAC-5.1/V5-HisB plasmid (Invitrogen) using the KpnΙ and XhoΙ sites as protein expression plasmids. Site mutations were gained by using a Phusion Site-Directed Mutagenesis Kit (ThermoFisher Scientific). The plasmid was cotransfected with agomir-276/agomir-ck into the S2 cells at 1:400 by Lipofectamine 3000 reagent (ThermoFisher Scientific). The cells were sampled 45 h after transfection. Protein was extracted by PIRA (CoWin), and 80 μg of total protein was used to perform Western blot. Anti-V5 antibody (MBL) was used to detect to BRM level. β-Tubulin antibody (1:5,000; EASYBIO) was used as an internal control. Total mRNAs and nuclear and cytoplasmic RNAs were extracted as described and reverse transcribed using a FastQuant RT Kit (with gDNase) (Tiangen). The qPCR primers for S2 cells are included in Table S3.
Acknowledgments
We thank Dr. Yundan Wang for advice on antibody preparation and Western blotting. This research was supported by Strategic Priority Research Program of the Chinese Academy of Sciences Grant XDB11010000 and National Science Foundation of China Grants 31430023 and 31472048.
Footnotes
The authors declare no conflict of interest.
This article is a PNAS Direct Submission.
Data deposition: The small RNA libraries have been deposited in the Sequence Read Archive database of National Center for Biotechnology Information (NCBI) (accession no. SRP056610).
This article contains supporting information online at www.pnas.org/lookup/suppl/doi:10.1073/pnas.1521098113/-/DCSupplemental.
References
- 1.Sumpter DJ. The principles of collective animal behaviour. Philos Trans R Soc Lond B Biol Sci. 2006;361(1465):5–22. doi: 10.1098/rstb.2005.1733. [DOI] [PMC free article] [PubMed] [Google Scholar]
- 2.Janzen DH. Why bamboos wait so long to flower. Annu Rev Ecol Syst. 1976;7:347–391. [Google Scholar]
- 3.Knowlton N. Reproductive synchrony, parental investment, and the evolutionary dynamics of sexual selection. Anim Behav. 1979;27:1022–1033. [Google Scholar]
- 4.Matsumoto-Oda A, Ihara Y. Estrous asynchrony causes low birth rates in wild female chimpanzees. Am J Primatol. 2011;73(2):180–188. doi: 10.1002/ajp.20885. [DOI] [PubMed] [Google Scholar]
- 5.Jenkins JL, Powell JA, Logan JA, Bentz BJ. Low seasonal temperatures promote life cycle synchronization. Bull Math Biol. 2001;63(3):573–595. doi: 10.1006/bulm.2001.0237. [DOI] [PubMed] [Google Scholar]
- 6.Emlen ST, Demong NJ. Adaptive significance of synchronized breeding in a colonial bird: A new hypothesis. Science. 1975;188(4192):1029–1031. doi: 10.1126/science.1145188. [DOI] [PubMed] [Google Scholar]
- 7.Spencer RJ, Thompson MB, Banks PB. Hatch or wait? A dilemma in reptilian incubation. Oikos. 2001;93(3):401–406. [Google Scholar]
- 8.Porter TA, Wilkinson GS. Birth synchrony in greater spear-nosed bats (Phyllostomus hastatus) J Zool (Lond) 2001;253(3):383–390. [Google Scholar]
- 9.McClintock MK. Menstrual synchorony and suppression. Nature. 1971;229(5282):244–245. doi: 10.1038/229244a0. [DOI] [PubMed] [Google Scholar]
- 10.Franklin DC. Synchrony and asynchrony: Observations and hypotheses for the flowering wave in a long-lived semelparous bamboo. J Biogeogr. 2004;31(5):773–786. [Google Scholar]
- 11.Nicolai CA, Sedinger JS, Wege ML. Regulation of development time and hatch synchronization in Black Brant (Branta bernicla nigricans) Funct Ecol. 2004;18(3):475–482. [Google Scholar]
- 12.Tankersley RA, Bullock TM, Forward RB, Rittschof D. Larval release behaviors in the blue crab Callinectes sapidus: Role of chemical cues. J Exp Mar Biol Ecol. 2002;273(1):1–14. [Google Scholar]
- 13.Gursky VV, Surkova SY, Samsonova MG. Mechanisms of developmental robustness. Biosystems. 2012;109(3):329–335. doi: 10.1016/j.biosystems.2012.05.013. [DOI] [PubMed] [Google Scholar]
- 14.Waddington CH. Canalization of development and the inheritance of acquired characters. Nature. 1942;150:563–565. doi: 10.1038/1831654a0. [DOI] [PubMed] [Google Scholar]
- 15.Bartel DP, Chen CZ. Micromanagers of gene expression: The potentially widespread influence of metazoan microRNAs. Nat Rev Genet. 2004;5(5):396–400. doi: 10.1038/nrg1328. [DOI] [PubMed] [Google Scholar]
- 16.Herranz H, Cohen SM. MicroRNAs and gene regulatory networks: Managing the impact of noise in biological systems. Genes Dev. 2010;24(13):1339–1344. doi: 10.1101/gad.1937010. [DOI] [PMC free article] [PubMed] [Google Scholar]
- 17.Wang X, Kang L. Molecular mechanisms of phase change in locusts. Annu Rev Entomol. 2014;59:225–244. doi: 10.1146/annurev-ento-011613-162019. [DOI] [PubMed] [Google Scholar]
- 18.Norris MJ. Accelerating and inhibiting effects of crowding on sexual maturation in two species of locusts. Nature. 1964;203(494):784–785. [Google Scholar]
- 19.Kang L, et al. The analysis of large-scale gene expression correlated to the phase changes of the migratory locust. Proc Natl Acad Sci USA. 2004;101(51):17611–17615. doi: 10.1073/pnas.0407753101. [DOI] [PMC free article] [PubMed] [Google Scholar]
- 20.Chen S, et al. De novo analysis of transcriptome dynamics in the migratory locust during the development of phase traits. PLoS One. 2010;5(12):e15633. doi: 10.1371/journal.pone.0015633. [DOI] [PMC free article] [PubMed] [Google Scholar]
- 21.Wei Y, Chen S, Yang P, Ma Z, Kang L. Characterization and comparative profiling of the small RNA transcriptomes in two phases of locust. Genome Biol. 2009;10(1):R6. doi: 10.1186/gb-2009-10-1-r6. [DOI] [PMC free article] [PubMed] [Google Scholar]
- 22.Ma Z, Guo W, Guo X, Wang X, Kang L. Modulation of behavioral phase changes of the migratory locust by the catecholamine metabolic pathway. Proc Natl Acad Sci USA. 2011;108(10):3882–3887. doi: 10.1073/pnas.1015098108. [DOI] [PMC free article] [PubMed] [Google Scholar]
- 23.Wu R, et al. Metabolomic analysis reveals that carnitines are key regulatory metabolites in phase transition of the locusts. Proc Natl Acad Sci USA. 2012;109(9):3259–3263. doi: 10.1073/pnas.1119155109. [DOI] [PMC free article] [PubMed] [Google Scholar]
- 24.Yang M, et al. MicroRNA-133 inhibits behavioral aggregation by controlling dopamine synthesis in locusts. PLoS Genet. 2014;10(2):e1004206. doi: 10.1371/journal.pgen.1004206. [DOI] [PMC free article] [PubMed] [Google Scholar]
- 25.Chen Q, He J, Ma C, Yu D, Kang L. Syntaxin 1A modulates the sexual maturity rate and progeny egg size related to phase changes in locusts. Insect Biochem Mol Biol. 2015;56:1–8. doi: 10.1016/j.ibmb.2014.11.001. [DOI] [PubMed] [Google Scholar]
- 26.Chen B, et al. Paternal epigenetic effects of population density on locust phase-related characteristics associated with heat-shock protein expression. Mol Ecol. 2015;24(4):851–862. doi: 10.1111/mec.13072. [DOI] [PubMed] [Google Scholar]
- 27.Iovino N, Pane A, Gaul U. miR-184 has multiple roles in Drosophila female germline development. Dev Cell. 2009;17(1):123–133. doi: 10.1016/j.devcel.2009.06.008. [DOI] [PubMed] [Google Scholar]
- 28.Soni K, et al. miR-34 is maternally inherited in Drosophila melanogaster and Danio rerio. Nucleic Acids Res. 2013;41(8):4470–4480. doi: 10.1093/nar/gkt139. [DOI] [PMC free article] [PubMed] [Google Scholar]
- 29.Labialle S, et al. The miR-379/miR-410 cluster at the imprinted Dlk1-Dio3 domain controls neonatal metabolic adaptation. EMBO J. 2014;33(19):2216–2230. doi: 10.15252/embj.201387038. [DOI] [PMC free article] [PubMed] [Google Scholar]
- 30.Enright AJ, et al. MicroRNA targets in Drosophila. Genome Biol. 2003;5(1):R1. doi: 10.1186/gb-2003-5-1-r1. [DOI] [PMC free article] [PubMed] [Google Scholar]
- 31.Rehmsmeier M, Steffen P, Hochsmann M, Giegerich R. Fast and effective prediction of microRNA/target duplexes. RNA. 2004;10(10):1507–1517. doi: 10.1261/rna.5248604. [DOI] [PMC free article] [PubMed] [Google Scholar]
- 32.Moore MJ, Proudfoot NJ. Pre-mRNA processing reaches back to transcription and ahead to translation. Cell. 2009;136(4):688–700. doi: 10.1016/j.cell.2009.02.001. [DOI] [PubMed] [Google Scholar]
- 33.Tuller T, Waldman YY, Kupiec M, Ruppin E. Translation efficiency is determined by both codon bias and folding energy. Proc Natl Acad Sci USA. 2010;107(8):3645–3650. doi: 10.1073/pnas.0909910107. [DOI] [PMC free article] [PubMed] [Google Scholar]
- 34.Uvarov BP. Grasshoppers and Locusts. Vol 2 Centre for Overseas Pest Research; London, UK: 1977. [Google Scholar]
- 35.Hassanali A, Njagi PGN, Bashir MO. Chemical ecology of locusts and related acridids. Annu Rev Entomol. 2005;50:223–245. doi: 10.1146/annurev.ento.50.071803.130345. [DOI] [PubMed] [Google Scholar]
- 36.Forward RB, Lohmann KJ. Control of egg hatching in the crab Rhithropanopeus harrisii (Gould) Biol Bull. 1983;165(1):154–166. [Google Scholar]
- 37.Hobert O. Gene regulation by transcription factors and microRNAs. Science. 2008;319(5871):1785–1786. doi: 10.1126/science.1151651. [DOI] [PubMed] [Google Scholar]
- 38.Côté J, Peterson CL, Workman JL. Perturbation of nucleosome core structure by the SWI/SNF complex persists after its detachment, enhancing subsequent transcription factor binding. Proc Natl Acad Sci USA. 1998;95(9):4947–4952. doi: 10.1073/pnas.95.9.4947. [DOI] [PMC free article] [PubMed] [Google Scholar]
- 39.Tamkun JW, et al. Brahma: A regulator of Drosophila homeotic genes structurally related to the yeast transcriptional activator SNF2/SWI2. Cell. 1992;68(3):561–572. doi: 10.1016/0092-8674(92)90191-e. [DOI] [PubMed] [Google Scholar]
- 40.Shi J, et al. Drosophila Brahma complex remodels nucleosome organizations in multiple aspects. Nucleic Acids Res. 2014;42(15):9730–9739. doi: 10.1093/nar/gku717. [DOI] [PMC free article] [PubMed] [Google Scholar]
- 41.Axtell MJ, Westholm JO, Lai EC. Vive la différence: Biogenesis and evolution of microRNAs in plants and animals. Genome Biol. 2011;12(4):221. doi: 10.1186/gb-2011-12-4-221. [DOI] [PMC free article] [PubMed] [Google Scholar]
- 42.Lai EC. microRNAs: Runts of the genome assert themselves. Curr Biol. 2003;13(23):R925–R936. doi: 10.1016/j.cub.2003.11.017. [DOI] [PubMed] [Google Scholar]
- 43.Vasudevan S, Tong Y, Steitz JA. Switching from repression to activation: MicroRNAs can up-regulate translation. Science. 2007;318(5858):1931–1934. doi: 10.1126/science.1149460. [DOI] [PubMed] [Google Scholar]
- 44.Eiring AM, et al. miR-328 functions as an RNA decoy to modulate hnRNP E2 regulation of mRNA translation in leukemic blasts. Cell. 2010;140(5):652–665. doi: 10.1016/j.cell.2010.01.007. [DOI] [PMC free article] [PubMed] [Google Scholar]
- 45.Place RF, Li L-C, Pookot D, Noonan EJ, Dahiya R. MicroRNA-373 induces expression of genes with complementary promoter sequences. Proc Natl Acad Sci USA. 2008;105(5):1608–1613. doi: 10.1073/pnas.0707594105. [DOI] [PMC free article] [PubMed] [Google Scholar]
- 46.Mortensen RD, Serra M, Steitz JA, Vasudevan S. Posttranscriptional activation of gene expression in Xenopus laevis oocytes by microRNA-protein complexes (microRNPs) Proc Natl Acad Sci USA. 2011;108(20):8281–8286. doi: 10.1073/pnas.1105401108. [DOI] [PMC free article] [PubMed] [Google Scholar]
- 47.Tseng SSL, et al. Dbp5p, a cytosolic RNA helicase, is required for poly(A)+ RNA export. EMBO J. 1998;17(9):2651–2662. doi: 10.1093/emboj/17.9.2651. [DOI] [PMC free article] [PubMed] [Google Scholar]
- 48.Mortimer SA, Kidwell MA, Doudna JA. Insights into RNA structure and function from genome-wide studies. Nat Rev Genet. 2014;15(7):469–479. doi: 10.1038/nrg3681. [DOI] [PubMed] [Google Scholar]
- 49.Klionsky DJ, Skalnik DG, Simoni RD. Differential translation of the genes encoding the proton-translocating ATPase of Escherichia coli. J Biol Chem. 1986;261(18):8096–8099. [PubMed] [Google Scholar]
- 50.Van Horn SN. Studies on the embryogenesis of Aulocara elliotti (Thomas) (Orthoptera, Acrididae). I. External morphogenesis. J Morphol. 1966;120(1):83–114. doi: 10.1002/jmor.1051200105. [DOI] [PubMed] [Google Scholar]
- 51.Reuter JS, Mathews DH. RNAstructure: Software for RNA secondary structure prediction and analysis. BMC Bioinformatics. 2010;11(1):129. doi: 10.1186/1471-2105-11-129. [DOI] [PMC free article] [PubMed] [Google Scholar]
- 52.Audic S, Claverie JM. The significance of digital gene expression profiles. Genome Res. 1997;7(10):986–995. doi: 10.1101/gr.7.10.986. [DOI] [PubMed] [Google Scholar]
- 53.Truesdell SS, et al. MicroRNA-mediated mRNA translation activation in quiescent cells and oocytes involves recruitment of a nuclear microRNP. Sci Rep. 2012;2:842. doi: 10.1038/srep00842. [DOI] [PMC free article] [PubMed] [Google Scholar]
- 54.Xu H, Guo M, Yang Y, You Y, Zhang L. Differential expression of two novel odorant receptors in the locust (Locusta migratoria) BMC Neurosci. 2013;14:50. doi: 10.1186/1471-2202-14-50. [DOI] [PMC free article] [PubMed] [Google Scholar]
- 55.Erkmann JA, Sànchez R, Treichel N, Marzluff WF, Kutay U. Nuclear export of metazoan replication-dependent histone mRNAs is dependent on RNA length and is mediated by TAP. RNA. 2005;11(1):45–58. doi: 10.1261/rna.7189205. [DOI] [PMC free article] [PubMed] [Google Scholar]


