Abstract
Smoking cigarettes is a major risk factor in the development and progression of cardiovascular disease (CVD) and chronic obstructive pulmonary disease (COPD). Modified risk tobacco products (MRTPs) are being developed to reduce smoking-related health risks. The goal of this study was to investigate hallmarks of COPD and CVD over an 8-month period in apolipoprotein E-deficient mice exposed to conventional cigarette smoke (CS) or to the aerosol of a candidate MRTP, tobacco heating system (THS) 2.2. In addition to chronic exposure, cessation or switching to THS2.2 after 2 months of CS exposure was assessed. Engaging a systems toxicology approach, exposure effects were investigated using physiology and histology combined with transcriptomics, lipidomics, and proteomics. CS induced nasal epithelial hyperplasia and metaplasia, lung inflammation, and emphysematous changes (impaired pulmonary function and alveolar damage). Atherogenic effects of CS exposure included altered lipid profiles and aortic plaque formation. Exposure to THS2.2 aerosol (nicotine concentration matched to CS, 29.9 mg/m3) neither induced lung inflammation or emphysema nor did it consistently change the lipid profile or enhance the plaque area. Cessation or switching to THS2.2 reversed the inflammatory responses and halted progression of initial emphysematous changes and the aortic plaque area. Biological processes, including senescence, inflammation, and proliferation, were significantly impacted by CS but not by THS2.2 aerosol. Both, cessation and switching to THS2.2 reduced these perturbations to almost sham exposure levels. In conclusion, in this mouse model cessation or switching to THS2.2 retarded the progression of CS-induced atherosclerotic and emphysematous changes, while THS2.2 aerosol alone had minimal adverse effects.
Keywords: atherosclerosis, emphysema, tobacco-heating, LC-MS based proteomics, lipidomics
Smoking cigarettes strongly contributes to the development and progression of a number of serious diseases, including cardiovascular disease (CVD) (Office of the Surgeon General et al., 2010; Price et al., 1999; Siasos et al., 2014) and chronic obstructive pulmonary disease (COPD) (GOLD, 2014; Office of the Surgeon General et al., 2010; Pauwels and Rabe, 2004; Postma et al., 2015). Important health benefits have been associated with smoking cessation (Bakhru and Erlinger, 2005; Dhariwal et al., 2014; Gepner et al., 2011). Although quitting is preferable to reduce smoking-related health risks, modified risk tobacco products (MRTPs) are being developed to provide alternatives for smokers who do not quit. It is therefore important to assess to what extent the benefits of smoking cessation are transferrable to the switching to MRTPs, comparing the impact of cessation and switching on physiological, histological, and molecular measurements associated with biological mechanisms implicated in disease progression.
The U.S. Family Smoking Prevention and Tobacco Control Act of 2009 defines an MRTP as “any tobacco product that is sold or distributed for use to reduce harm or the risk of tobacco-related disease associated with commercially marketed tobacco products” (Food and Drug Administration, 2009). The U.S. Food and Drug Administration published draft guidance on “MRTP Applications” (Food and Drug Administration, 2012) stating that applications must provide scientific evidence to demonstrate that the product will “significantly reduce harm and the risk of tobacco-related diseases to individual tobacco users, and benefit the health of the population as a whole, taking into account both users of tobacco products and persons who do not currently use tobacco products.” In this context, nonclinical studies play an integral role in the evaluation of MRTPs (Food and Drug Administration, 2012).
In this article, the toxicological mechanisms of a candidate MRTP, the tobacco heating system (THS) 2.2, have been investigated. THS2.2 electrically heats tobacco without combustion. THS2.2 is functionally different from a recently tested prototypic candidate MRTP that uses a carbon tip as a heat source (Kogel et al., 2014; Phillips et al., 2015) and utilizes a different design from the electrically heated smoking systems described previously (Moennikes et al., 2008; Schorp et al., 2012; Terpstra et al., 2003; Werley et al., 2008). However, like the carbon tip candidate MRTP, THS2.2 generates an aerosol that mainly contains water, glycerin, nicotine, and tobacco flavors. The electronically controlled heating technology is designed to avoid tobacco combustion, and in turn, reduce the formation of harmful and potentially harmful constituents (HPHCs).
Our study objectives were: (1) to assess reduced exposure effects, compared with conventional cigarette smoke (CS), for THS2.2 aerosol in a chronic inhalation toxicity study; (2) to investigate the effects of cessation or switching to THS2.2 aerosol; and (3) to investigate disease endpoints related to both CVD and COPD in one mouse model, leveraging state-of-the-art systems toxicology approaches.
Apolipoprotein E-deficient (Apoe−/−) transgenic mice are commonly used as a model for atherogenesis (Veniant et al., 2001), particularly to investigate smoking-related atherosclerosis (Boue et al., 2012; Chan et al., 2012; Lietz et al., 2013; von Holt et al., 2009), as well as CS-induced lung inflammation and emphysema (Arunachalam et al., 2010; Boue et al., 2013; Han et al., 2012). They were therefore chosen in this study to investigate indicators of both COPD and CVD in the same animals exposed to either mainstream CS or to the mainstream aerosol from THS2.2 (nicotine concentration matched to CS: 29.9 mg/m3) over an 8-month period, using physiological, histological, and molecular evaluations. The effects of cessation or switching to THS2.2 aerosol after 2 months of CS exposure were also investigated (Figure 1).
FIG. 1.
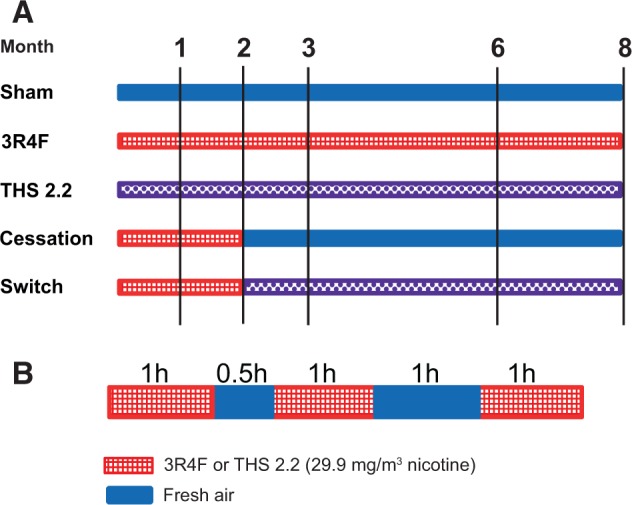
Study design. A, Groups and exposures. B, Daily exposure schedule. For animal numbers and allocations to endpoints, see Table 1. 3R4F, standard reference cigarette 3R4F; THS2.2, tobacco heating system 2.2.
The applied CS exposure regimen resulted in larger atherosclerotic plaques and increased pulmonary inflammation and emphysematous changes in Apoe−/− mice compared with controls. Exposure to the THS2.2 aerosol neither induced lung inflammation and emphysema nor did it consistently change the lipid profile or enhance the plaque area. Cessation and switching caused a reversal of the inflammatory responses and halted progression of initial emphysematous changes and the aortic plaque area. Our results confirm that Apoe−/−mice are an excellent model to evaluate both COPD and CVD disease biomarkers (Boue et al., 2012, 2013), thereby serving the “Reduce” goal of the 3Rs in animal research. The “Refine” goal was also considered by our systems toxicology approach, which combined the functional, physiological, and morphological toxicity endpoints with high-density molecular investigations and computational modeling (Hoeng et al., 2013; Sturla et al., 2014).
MATERIALS AND METHODS
General Study Design
Female Apoe−/− mice (38 mice per group and time-point) were randomized into 5 groups (Figure 1A): (1) sham (exposed to air); (2) 3R4F (exposed to CS from the reference cigarette 3R4F); (3) THS2.2 (exposed to mainstream aerosol from THS2.2 at nicotine levels matched to those of 3R4F CS); (4) smoking cessation; and (5) switching to THS2.2 aerosol. At scheduled time-points, 6 additional mice were allocated for micro computed tomography (micro-CT) of vascular changes (for details, see Table 1). Group sizes were based on a previously proven statistical design (Phillips et al., 2015) to ensure that results could be properly interpreted while keeping the animal numbers low. Mice from the sham, 3R4F, and THS2.2 groups were exposed to fresh air, CS from 3R4F, or THS2.2 aerosol, respectively, for up to 8 months. To model the effects of smoking cessation and switching to THS2.2 aerosol, mice from the cessation and switch groups were first exposed to 3R4F for 2 months and then switched to air or THS2.2 aerosol, respectively, for up to 6 additional months (Figure 1A). Female mice were chosen because of their possible higher susceptibility to develop emphysema (Bartalesi et al., 2005). For details on the rationale for the combined cardiovascular and respiratory, animal-saving study design, see Supplementary Methods.
TABLE 1.
Allocation of Mice to Groups and Endpoints
| Mice Dissection Group |
|||||||
|---|---|---|---|---|---|---|---|
| Treatment Group | Month | BALF | Histopa-thology | Lung Function | Omics | Micro-CTa | Total No. of Mice |
| Sham | 1 | 10 | 10 | 10 | 8 | 38 | |
| 2 | 10 | 10 | 10 | 8 | 38 | ||
| 3 | 10 | 10 | 10 | 8 | 38 | ||
| 6 | 10 | 10 | 10 | 8 | 38 | ||
| 8 | 10 | 10 | 10 | 8 | 6 | 44 | |
| 3R4F | 1 | 10 | 10 | 10 | 8 | 38 | |
| 2 | 10 | 10 | 10 | 8 | 38 | ||
| 3 | 10 | 10 | 10 | 8 | 38 | ||
| 6 | 10 | 10 | 10 | 8 | 38 | ||
| 8 | 10 | 10 | 10 | 8 | 6 | 44 | |
| THS2.2 | 1 | 10 | 10 | 10 | 8 | 38 | |
| 2 | 10 | 10 | 10 | 8 | 38 | ||
| 3 | 10 | 10 | 10 | 8 | 38 | ||
| 6 | 10 | 10 | 10 | 8 | 38 | ||
| 8 | 10 | 10 | 10 | 8 | 6 | 44 | |
| Cessation | 3 | 10 | 10 | 10 | 8 | 38 | |
| 6 | 10 | 10 | 10 | 8 | 38 | ||
| 8 | 10 | 10 | 10 | 8 | 6 | 44 | |
| Switching | 3 | 10 | 10 | 10 | 8 | 38 | |
| 6 | 10 | 10 | 10 | 8 | 38 | ||
| 8 | 10 | 10 | 10 | 8 | 6 | 44 | |
| Sum | 828 | ||||||
aInvestigations were actually made at month 7.
Reference Cigarettes, Candidate MRTPs, and Test Atmosphere Generation
3R4F reference cigarettes were purchased from the University of Kentucky (http://www.ca.uky.edu/refcig). The candidate MRTP, THS2.2, consisted of a stick containing a tobacco plug inserted into a holder that heats the tobacco in a controlled way to ensure combustion temperatures are not reached. The controlled heating of the tobacco generates an aerosol containing mainly water, glycerin, nicotine, and tobacco flavors.
Comparative analytical specifications of the THS2.2 aerosol and 3R4F CS yields are given in Supplementary Table 1A, which shows the quantification of 56 HPHCs plus water and glycerol (as a humectant) from 3R4F CS and THS2.2 aerosol. Of these 58 analytes, 29 were reduced on a per mg nicotine basis by more than 90% or to undetectable amounts in the THS2.2 aerosol compared with 3R4F CS, N-nitrosamines were reduced by 88%–96%, polycyclic aromatic hydrocarbons by 84%–88%, whereas total particulate matter (TPM) increased to 156%, water to 391%, and glycerol to 275%. Supplementary Table 1B indicates the overall yield reduction on the level of chemical classes and on a per stick basis.
THS2.2 sticks were produced at Philip Morris International (PMI; Neuchâtel, Switzerland). As part of the smoking system, the stick was inserted into a holder that heats the tobacco plug (Supplementary Figure 1). The holder included a battery, electronics for temperature control, a heating element, and the stick extractor. Holders were provided by PMI.
Mainstream CS from 3R4F cigarettes was generated on 30-port rotary smoking machines as previously described (Phillips et al., 2015), while aerosol from THS2.2 sticks was generated on modified 30-port rotary smoking machines equipped with the respective stick holders (Supplementary Figure 1). Two modified smoking machines per chamber were required to achieve the target THS2.2 aerosol concentration. The puff count for THS2.2 sticks was set to 12 puffs as part of the smoking machine configurations. The 3R4F sticks were smoked to a butt length of 34.1 ± 0.7 mm to 35.4 ± 1.2 mm, with the resulting puff count averaging 10.5 puffs per stick. In both cases, the smoking machines were set for a 55-ml puff volume.
3R4F cigarettes were smoked and aerosol from THS2.2 sticks was generated according to the Health Canada Intensive Smoking Protocol based on ISO standard 3308 (revised in 2000), with the exception of the puff volume (55 ml) and puff frequency (1 puff every 30 s) (Phillips et al., 2015). Several additional minor deviations from ISO standard 3308 were necessary for technical reasons (Supplementary Table 2).
Mice and Inhalation Exposure
All procedures involving animals were performed in an Association for Assessment and Accreditation of Laboratory Animal Care International (AAALAC)-accredited, Agri-Food & Veterinary Authority of Singapore-licensed facility with approval from an Institutional Animal Care and Use Committee (IACUC protocol 15015), in compliance with the National Advisory Committee for Laboratory Animal Research Guidelines on the Care and Use of Animals for Scientific Purposes (NACLAR, 2004).
Female B6.129P2-Apoetm1UncN11 (Apoe−/−) mice bred under specific pathogen-free conditions were obtained from Taconic Biosciences (Germantown, New York). The mice were approximately 6–8 weeks old on arrival (8–10 weeks old at the start of the exposure) and their health status on arrival was verified using the health check certificate provided by the breeder. Additional health checks on tissue samples collected at the test facility were performed at Harlan Laboratories (Derby, UK).
Mice were kept and exposed under specific hygienic conditions with filtered, conditioned fresh air, at 22°C ± 2°C and 55% ± 10% humidity (for details, see Supplementary Methods). The light/dark cycle was 12/12 h. A maximum of 8 mice were housed per cage. During nonexposure periods, each cage of animals was provided with a gnawing bone (Nylabone, Neptune city, New Jersey), and an Igloo (Biosys Corp PTE LTD, Singapore) as cage enrichment. The bedding material (Lignocel BK 8-15, J. Rettenmaier & Soehne, GmbH & Co KG., Rosenberg, Germany) was composed of autoclaved softwood (fir and spruce) granulate. A gamma-irradiated pellet diet (T2914C rodent diet, Harlan Laboratories) was provided. For additional details of animal housing, randomization, and acclimatization, see previous studies (Boue et al., 2013; Phillips et al., 2015).
The mice were whole body-exposed to diluted mainstream smoke from 3R4F cigarettes (600 mg TPM/m3, equivalent to 29.9 mg nicotine/m3), THS2.2 aerosol (nicotine-matched to 3R4F, 29.9 mg/ m3), or filtered air for 3 h per day, 5 days per week, for up to 8 months. Intermittent daily exposure to fresh filtered air for 30 min after the first hour of smoke exposure and for 60 min after the second hour of exposure (Figure 1B) was provided to avoid a buildup of excessive carboxyhemoglobin (COHb) concentrations in the 3R4F group. For the sham group, mice were exposed to air.
The atmosphere in the aerosol exposure chambers was monitored (Supplementary Methods) for flow rate, temperature, relative humidity, concentration and particle size of TPM, and the concentrations of carbon monoxide (CO), formaldehyde, acetaldehyde, and acrolein as previously described (Phillips et al., 2015). Particle size distribution was measured per chamber on a monthly basis during the study using a cascade impactor (PIXE International Corporation, Florida) with a volumetric flow rate of 1 l/min. Animals were observed on a daily basis, body weight progression was monitored weekly, and exposure parameters (COHb in blood and nicotine metabolites in urine) were measured 3 times during the study. For a detailed description of the procedures, see Phillips et al. (2015).
Biological Endpoints
Exposure biomarkers in blood and urine
Blood COHb and urinary nicotine metabolites were determined as previously described (Phillips et al., 2015). Urine was collected during the 18-h period following the exposure to avoid sample contamination with nicotine from the exposure atmosphere. Plasma levels of nicotine and cotinine and the following nonnicotine urinary biomarkers of CS exposure, oxidative stress, and inflammation were also measured: hydroxypropylmercuric acid (HPMA), S-phenylmercapturic acid, 2-cyanoethylmercapturic acid (CEMA), 4-(methylnitrosamino)-1-(3-pyridyl)-1-butanol (NNAL), 4-hydroxynonenal (4-HNE), malondialdehyde (MDA), tetranor PGE-M, 2,3-dinor-8-iso-PGF2α, 8-iso-PGF2α, 2,3-dinor-TBX2, 11-dehydro-TBX2, and 12-hydroxyeicosatetraenoic acid were determined externally (ABF GmbH, Munich, Germany); for details, see Supplementary Methods.
Lung function measurements and lung volume determination
Lung function measurements were made in anaesthetized, tracheotomized, and cannulated mice using the Flexi Vent rodent ventilator system for measurement of respiratory mechanics (Scireq, Montreal, Canada), as previously described (Phillips et al., 2015).
Lung volume of the lungs that were scheduled for histopathology was determined by displacement of fixative under hydrostatic pressure (15 cm H2O) (Scherle, 1970).
In-life observations, body weight, dissection, and gross pathology
Dissections were performed after 1, 2, 3, 6, and 8 months of exposure. At each dissection time-point, animals were allocated to the following endpoints: bronchoalveolar lavage fluid (BALF), including analysis of infiltrated inflammatory cells in lungs, and multianalyte (cytokines/chemokines) profiling of BALF and plasma; histopathological evaluation and morphometry of lungs; lung function; plaque surface determination (aortic arch); and an extensive molecular analysis (transcriptomics, proteomics); at 8 months, lipidomics of plasma and aortic arch samples was also included (Table 1).
Hematology and clinical chemistry
Hematology included 10 parameters (Supplementary Table 3). Blood samples were taken from mice under terminal pentobarbital anesthesia from the retro-orbital venous plexus and analyzed using the Sysmex XT-2000i system (Sysmex Corp, Kobe, Japan).
For the assessment of 19 clinical chemistry parameters in serum (for details, see Supplementary Table 4), blood samples were taken from mice under terminal pentobarbital anesthesia by exsanguination via the abdominal aorta and analyzed using the UniCel DxC 600i system (Beckman-Coulter, Indianapolis, Indiana), as previously described (Phillips et al., 2015).
Bronchoalveolar lavage analysis
BALF was obtained from 10 mice per group, and the number of free lung cells (FLCs) (flow cytometry), the concentrations of inflammatory mediators (multianalyte profiling using Rodent Map 3.0 [performed externally at Rules Based Medicine, Austin, Texas]), and proteolytic activity (EnzChek Gelatinase/Collagenase Assay Kit; Life Technologies [Invitrogen], Singapore) were determined as previously described (Phillips et al., 2015).
Histopathology
Lungs were fixed by instillation with EGAFS fixative (pH 7.4) at a fixed pressure (15 cm H2O) and processed as described previously (Boue et al., 2013). The left lung lobe was serially sectioned (4 -µm thick) in 20 step-sections (150-µm apart) for an overall assessment of the entire lung lobe. Representative paraffin- and/or cryosections were also obtained from the nose, kidney, and left liver lobes. The sections were stained with hematoxylin-eosin (H&E), and additional histochemical staining included alcian blue and periodic acid-Schiff (PAS) for the left lung and nose (polysaccharides and glycoproteins, including mucus); resorcin fuchsin for the lung (elastic fibers); PAS and PAS diastase for the liver (glycogen); and Oil Red O for cryosections of the liver (lipids). Histopathological evaluation of the left lung (serial sections), nose (3 representative levels, L1, L2, and L4), and liver was performed in a blinded fashion by a board-certified veterinary pathologist as previously described (Boue et al., 2013; Kogel et al., 2014; Phillips et al., 2015; Stinn et al., 2010). Grading of the severity score ranged from 0 (finding not present) to 5 (severe alteration).
Digitalized (Aperio digital imaging), 4 -µm serial sections of the lung were also evaluated for pulmonary emphysema (semiquantitative scoring and quantitative morphometry). Morphometry was performed using a design-based stereological approach to obtain quantitative data (newCAST, VisioPharm, Horsholm, Denmark) describing the morphometry of the lungs (for details, see Phillips et al., 2015). Morphometric parameters investigated were mean chord length (MCL), bronchiolar attachments (BAs), and destructive index (DI). To account for volume impacts (dilatation upon extrathoracal instillation fixation, shrinking upon histoprocessing) on some morphometric endpoints, such as MCL (Knudsen et al., 2010), additional evaluation using less volume-dependent morphometric endpoints, such as alveolar density and alveolar air density (Ochs, 2014), was also conducted. Semiquantitative histopathological evaluation and quantitative lung morphometry were carried out by a board-certified veterinary pathologist in a blinded fashion (Histovia GmbH, Overath, Germany).
Plaque size measurements
After removal of the aortic arch, the aortic wall was opened longitudinally, stained with Oil Red O, and the intimal area covered by plaques normalized to the whole area was determined from digital images. For details, see Boue et al. (2012) and Lietz et al. (2013). For an independent, complementary plaque measurement of the whole aorta including the root, thoracic, and abdominal region, micro-CT imaging was applied to a separate cohort of mice. At month 7, 6 mice per group were grossly dissected (removal of rib cage and liver) and placed into neutral buffered formalin (10% vol/vol) fixative for at least 7 days and sent to Numira, Inc (Salt Lake City, Utah) for micro-CT imaging and measurement of plaque volume, plaque surface, and aortic arch occlusion in the aorta in situ (Vasquez et al., 2011). For details, see Supplementary Methods.
Tissue processing for transcriptomics, proteomics, and lipidomics
Tissues for “omics” analysis were obtained 16–24 h postexposure (separate samples from the same tissues/organs for transcriptomics, proteomics, and lipidomics) from 8 mice per group. For details, see Supplementary Methods.
Transcriptomics procedures
Total RNA was isolated from tissues using the miRNeasy Mini Kit (Qiagen) and quality checked using the Agilent 2100 Bioanalyzer (Agilent Technologies). Total RNA (100 ng) was reverse-transcribed, amplified, purified, and hybridized on MG430 2.0 GeneChips (Affymetrix) and evaluated using standard procedures (for details, see Supplementary Methods).
Data were deposited in the ArrayExpress database under accession number E-MTAB-3681. Raw data files were processed with custom computable document format files from BrainArray and normalized using frozen robust multiarray analysis (fRMA). Following quality control procedures, raw P-values were generated for the control-treatment contrasts with the limma package and adjusted using the Benjamini-Hochberg false discovery rate (FDR) multiple test correction.
Proteomics procedures
Our general quantitative proteomics approach has previously been reported (Phillips et al., 2015), and specific details are given in Supplementary Methods. Briefly, the samples were homogenized in tissue lysis buffer, proteins were precipitated using acetone, and 50-µg protein of each sample was processed for TMT 6-plex labeling according to the manufacturer’s instructions (Thermo Scientific, Waltham, Massachusetts). Samples were analyzed by liquid chromatography coupled with tandem mass spectrometry using an Easy-nanoLC 1000 instrument connected online to a Q-Exactive MS mass-analyzer (Thermo Scientific). The mass spectrometry proteomics data have been deposited to the ProteomeXchange Consortium (Vizcaino et al., 2014) via the PRIDE partner repository with the dataset identifier PXD002530. The data were normalized, quantified, and used to identify differentially abundant proteins in the R environment. The Benjamini-Hochberg FDR multiple test correction was employed and proteins with an adjusted P-value < .05 were considered to be differentially expressed.
For functional interpretation, a functional association clustering approach based on protein associations from the STRING database (v9.1) was employed (Franceschini et al., 2013). Briefly, association subnetworks enriched for differentially expressed proteins were identified for the 5 3R4F CS exposure time-points. The identified subnetworks were combined, edges identified for at least 2 exposure time-points were retained, and network clusters were identified and functionally annotated.
Lipidomics procedures
Molecular lipids from plasma and homogenized aortic arches were extracted and quantified by Zora Biosciences (Espoo, Finland) using synthetic nonendogenous standards as described previously (Boue et al., 2012). Lipids were normalized to their respective internal standard and the sample volume or tissue weight. The concentrations of molecular lipids are presented as mM for plasma and nmol/mg wet tissue for aortic samples.
Network perturbation amplitude and biological impact factor calculations
Transcriptomic data were analyzed in the context of hierarchically structured network models describing the molecular mechanisms underlying essential biological processes in nondiseased lung cells (Boue et al., 2015; Hoeng et al., 2012). Leveraging the “cause-and-effect” network models together with network perturbation amplitude (NPA) algorithms (Martin et al., 2012, 2014), the gene expression fold-changes were translated into differential values for each network node. These were in turn summarized into a quantitative measure of NPA (Kogel et al., 2014; Phillips et al., 2015). Supplementary Table 5 lists all network models and their subnetworks that were applied for the analysis. These models, labeled as “COPD models, postcrowd verification version 1.2” (Boue et al., 2015) were qualitatively different from the previously applied “nondisease models: version 1.0” (Kogel et al., 2014; Phillips et al., 2015), hence the quantitative outcomes could not be directly compared.
To objectively evaluate the overall biological impact relative to a reference within the experiment (typically a standardized CS exposure), the sum of the significant network perturbations for a given contrast was normalized with respect to the corresponding sum for the reference. The procedure for calculating the biological impact factor (BIF) is similar to the NPA calculation except that absolute values are used during the aggregation of the contributing networks to constantly yield positive values that represent the accumulation of various effects (Thomson et al., 2013). For details of the BIF calculation, see Kogel et al. (2014) and Phillips et al. (2015).
Statistical Evaluation
Unless otherwise indicated, data are expressed as means ± SEM. Exploratory pairwise comparisons between groups were performed and unadjusted P-values are stated. For continuous variables, if the data of the 2 groups being compared did not exhibit strong deviation from the normal distribution (as assessed by performing a Shapiro-Wilk test at the 5%-level on the standardized residuals of both groups), a 2-sample t test accounting for variance heterogeneity was performed. Otherwise, an exact Mann-Whitney-Wilcoxon 2-sample test was used (to save computing time, Monte Carlo estimates of the exact P-values were used). For body weight comparisons and because the sample size per group was > 30, only the t test was performed. For score variables, the Cochran-Mantel-Haenszel test was used and the Fisher exact test was used for incidence variables. All analyses were performed with the SAS system 9.2. Results were considered to be significantly different in a specific comparison if P < .05.
RESULTS
Test Atmospheres
CS was reproducibly generated, diluted, and delivered to the exposure chambers with relative SDs (RSDs) of < 11% for TPM, CO, and nicotine in the test atmospheres throughout the study (Table 2). The concentrations of additional smoke constituents determined in the diluted CS were similarly reproducible (within 4%–8% RSD for the analytes in the 3R4F atmosphere, except formaldehyde (17% RSD), and 0%–15% RSD in the THS2.2 atmosphere (Table 2). The target nicotine concentration (29.9 mg/m3, equivalent to approximately 600 mg/m3 TPM in CS, as per historical data) was met within the 5% range for the 3R4F and candidate MRTP groups, with actual achieved averages ranging from 28.6 to 29.4 mg/m3. All test atmospheres were respirable with a particle size smaller than 1 μm. The particle size for the THS2.2 test atmosphere (mass median aerodynamic diameter [MMAD]: 0.58–0.82 μm, geometric SD [GSD] 1.33–1.65) was very similar to that for the 3R4F test atmosphere (MMAD 0.65–0.93 μm, GSD 1.18–1.53). The TPM concentration in the THS2.2 test atmosphere was 38% lower than in the corresponding 3R4F group, and the levels of the HPHCs, CO, formaldehyde, acrolein, and acetaldehyde were approximately 98%, 83%, 90%, and 77% lower (Table 2), respectively, than in the 3R4F CS test atmosphere as their yields were strongly reduced due to the avoidance of tobacco combustion in the MRTP design (Supplementary Table 1). In addition, within a nontargeted GCxGC-TOF profiling, the formaldehyde/glycerol hemiacetal, 3-(hydroxymethoxy)propane-1,2-diol, which was reported to account for “hidden formaldehyde” in e-cigarette aerosols (Jensen et al., 2015), could not be detected in either THS2.2 aerosol or 3R4F CS. The same was the case for another potential formaldehyde/glycerol reaction product, the cyclic acetal, 1,3-dioxolan-4-ylmethanol (CAS 5464-28-8) (data not shown).
TABLE 2.
Analysis of Test Atmospheres
| Test Atmosphere | Sham | 3R4F | THS2.2 |
|---|---|---|---|
| TPM (mg/m3) | 0 (250) | 598.5 ± 27.1 (256) | 368.9 ± 54.4 (250) |
| Nicotine (mg/m3) | 0 (63) | 29.4 ± 2.2 (256) | 28.6 ± 3.2 (250) |
| CO (ppm) | 0.1 ± 0.1 (250) | 650.9 ± 34.2 (256) | 14.5 ± 2.2 (250) |
| Acetaldehyde (mg/m3) | n.d. | 32.9 ± 2.3 (50) | 7.5 ± 0.7 (49) |
| Acrolein (mg/m3) | n.d. | 3.1 ± 0.2 (50) | 0.3 ± 0.0 (49) |
| Formaldehyde (mg/m3/l) | n.d. | 0.6 ± 0.1 (50) | 0.1 ± 0.0 (49) |
Data are shown as mean ± SD, number in brackets represents sample number (n). Values exclude the first 7 days (dose adaptation). n.d., not done.
In-Life Observations and Biomarkers of Exposure
Both 3R4F CS and THS2.2 aerosols were well tolerated by the mice. The overall mortality rate was 3.5% and was not exposure-related (dead/moribund mice spread across all groups). Body weight increased throughout the study in all groups. However, weight gain was lower in 3R4F CS-exposed mice, while THS2.2 aerosol-exposed mice had no significant difference compared with sham mice (Supplementary Figure 2). The reductions in body weight gain observed exclusively in the 3R4F-exposed mice were in the expected range of previously published studies (Lietz et al., 2013). Cessation or switching after 2 months led to an almost complete recovery of body weight development to the sham/THS2.2 group level, which compares with the previous exposure protocol of cessation after 3 months leading to an intermediate body weight development (Lietz et al., 2013).
Biomonitoring demonstrated that the respective aerosols were inhaled. COHb levels in 3R4F-exposed mice ranged from 28% to 37% (Supplementary Figure 3). In line with reduced CO concentrations in the THS2.2 aerosol (Table 2), COHb levels in THS2.2 aerosol-exposed mice were in the 5% range at all time-points and did not differ from sham levels. Cessation and switch mice also had the same COHb levels as sham at months 4 and 7. The analysis of nicotine metabolites in urine indicated similar amounts of nicotine uptake from 3R4F CS or THS2.2 aerosol exposure atmospheres, and there was no difference in the relative amounts of 5 representative nicotine metabolites, despite limiting the urine collection to an 18-h period following the last exposure, and variations in the amount of urine recovered (Supplementary Figure 4). Moreover, at month 8, mice in the 3R4F and THS2.2 groups had similar nicotine and cotinine values, and mice in the sham and cessation groups had plasma nicotine and cotinine values below the low limit of quantification (Supplementary Figure 5).
Additional urinary biomarkers of exposure to nonnicotinic HPHCs and markers of oxidative stress, including 4-hydroxynonenal (4-HNE), malondialdehyde (MDA) and a number of eicosanoids/prostanoids confirmed the reduced exposure to these compounds in the THS2.2 and switching groups (for details, see Supplementary Figs. 6 and 7 and Results file 1). It should be noted that in absolute terms, the peak concentrations of short-lived metabolites, such as 2-HPMA, may have been underestimated in these 18-h samples because their peak values were missed, and the applied method did not distinguish endogenous 3-HPMA (the level of which is represented by the approximately 1800 ng/mouse in the sham group) from 2-HPMA which is formed from exogenous acrolein.
Hematology
Following 3R4F exposure, hematological parameters showed increases in hematocrit and red blood cell counts, while no significant changes were observed in the other exposure groups compared with sham (Supplementary Results file 2). These effects, also observed in our previous inhalation study on C57BL/6 wt mice (Phillips et al., 2015), are common in CS-exposed rodents and are likely to be a consequence of the formation of COHb. This has a diminished oxygen carrying capacity, thus triggering compensatory erythrocytosis, which results in increased hematocrit and hemoglobin (Rampling, 1993). Exposure of the mice to the THS2.2 aerosol resulted in red blood cell parameters similar to those of sham-exposed animals. This is likely to reflect the lower CO levels emitted by THS2.2 sticks compared with 3R4F cigarettes. Both cessation and switching resulted in a rapid reversion back to sham levels within 1 month of cessation/switching, although a lag was seen for the mean erythrocyte volume parameter, which returned to sham levels only 3 months after switching/cessation.
White blood cell parameters showed no obvious trends or differences in any exposure group (Supplementary Results file 2), which is also in concordance with our previous study on C57BL/6 wt mice (Phillips et al., 2015).
Clinical Chemistry
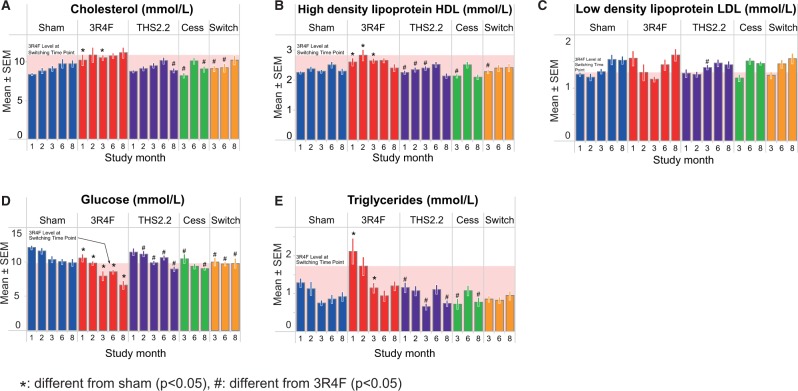
Nonfasted plasma samples were evaluated using a panel of clinical chemistry metabolic parameters, revealing a statistically significant increase in cholesterol in the CS-exposed group at months 1 and 3, with a decrease to sham levels after 1 month of either cessation or switching (Figure 2A). Accompanying the increase in total cholesterol (TC), a similar increase in high-density lipoprotein (HDL) cholesterol was observed (3R4F group increased from months 1–3, though merging to the sham level by month 8; Figure 2B). There were no obvious differences to the sham controls in low density lipoprotein (LDL) levels among any of the groups at any dissection time-point (Figure 2C). Although triglycerides were higher in 3R4F CS-exposed mice during the first 3 months of the study (P < .05 at months 1 and 3), by months 6 and 8 there were no differences among any of the groups (Figure 2E).
FIG. 2.
Clinical chemistry. Measurements by autoanalyzer. A, Total cholesterol (enzymatic/biochemical detection). B, High-density lipoprotein (enzymatic/biochemical detection). C, Low density lipoprotein (calculated according to the Friedewald formula). D, Glucose (enzymatic/biochemical detection). E, Triglycerides (enzymatic/biochemical detection). Data are means ± SEM, n = 8–10. Statistics describe comparison with sham-exposed animals. *P < .05 or with 3R4F-exposed animals #P<.05. The shaded area indicates the 3R4F value at the switching/cessation time-point (month 2).
An independent evaluation of lipoproteins using samples from a different cohort of mice and the vertical auto profile (VAP) ultracentrifugation method (Supplementary Figure 8) confirmed the trends seen in the autoanalyzer-derived results for TC (marginally elevated for 3R4F from month 1 to 6), HDL (inconsistently elevated for 3R4F at months 1–3), LDL (inconsistently elevated for 3R4F at months 1 and 6), and triglycerides (inconsistently elevated for 3R4F at months 1 and 3) (Supplementary Figs. 8A–D) and provided in addition the concentrations of very LDL (VLDL) (Supplementary Figure 8E), which was significantly increased in 3R4F CS-exposed mice at months 1, 2, and 6, with the greatest difference to sham seen at month 1. Values for THS2.2 aerosol-exposed, cessation, and switch mice did not significantly differ from sham at any time-point. Even if there were a few apparently time-related trends (eg, triglycerides in the THS2.2 group in Supplementary Figure 8D), they were inconsistent (here: compared with the switch group that received the same THS2.2 exposure at months 3–8, and with the decreasing trend in the autoanalyzer results, Figure 2E) and did not reach statistical significance, given the high variability (for both methods) in all groups including the sham. Because of an age-related increase of VLDL levels in all groups, the levels were similar at month 8, which neutralized the 3R4F effect. A more detailed summary of all lipoprotein results, including lipoprotein subfractions, is provided in Supplementary Results file 2.
Plasma glucose levels were decreased with age in all groups including sham-exposed mice (Figure 2D). Significantly lower plasma glucose concentrations compared with sham were observed in 3R4F-exposed mice across all time-points, corresponding with the body weight reduction seen in CS-exposed mice that may have potentially affected these metabolic parameters, an observation that is common to CS-exposed mice (Chen et al., 2007; Lietz et al., 2013; Phillips et al., 2015; Stinn et al., 2010; von Holt et al., 2009). Cessation and switching resulted in the return of glucose concentrations to sham levels within 1 month, again recapitulating the increased body weight gain.
Aortic Arch Plaque Formation
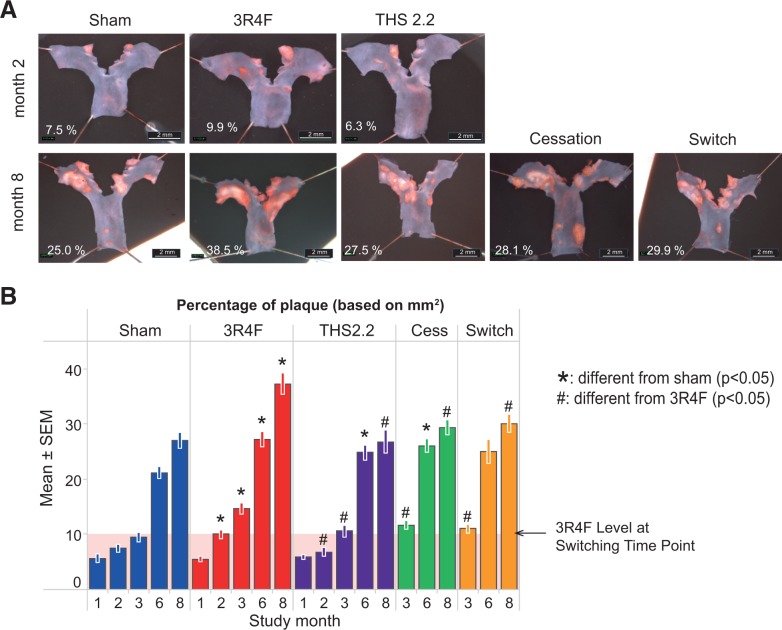
Aortic arch morphometry was performed at all time-points. Image analysis measurements of the plaque area revealed an expected and progressive increase in plaque burden in all groups over the 8-month experimental time frame. From month 2 onwards, a significantly increased aortic plaque area was observed in mice exposed to 3R4F CS compared with either sham or THS2.2 aerosol-exposed animals (Figure 3). Exposure to THS2.2 aerosols resulted in plaque area measurements that did not significantly differ from values for sham-exposed mice (P > .05 across all time-points, except month 6 where the plaque area was increased [P < .05] relative to sham, though less than in CS-exposed mice). Following either cessation or switching to THS2.2 aerosol, the plaque area was significantly smaller than in the 3R4F CS exposure group at the months 3 and 8 time-points, though the plaques remained slightly, but not significantly, larger than those of sham or chronic THS2.2 aerosol-exposed mice.
FIG. 3.
Aortic arch plaque area measurements. Aortic arches were dissected, longitudinally opened, pinned down, and stained with OilRedO for planimetry A, Representative images from the dissection microscope. B, Plaque size determined by planimetry in the dissected aortic arch. Data are means ± SEM. The shaded area indicates the 3R4F value at the switching/cessation time-point (month 2).
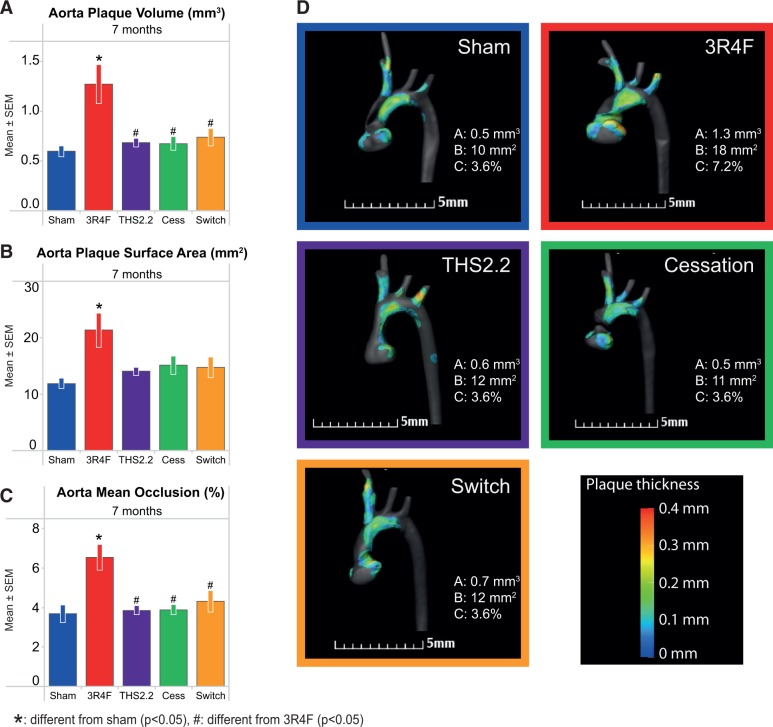
The additional quantitative micro-CT investigation of the aortic arch plaque formation in situ at the 7-month time-point confirmed the morphometric results from the plaque surface assessment: for 3R4F-exposed mice, all 3 parameters (plaque volume, plaque area, and aortic occlusion) were significantly higher compared with sham-exposed mice, but the THS2.2, cessation, and switching groups were not different from sham (Figure 4). The aorta plaque surface area (the micro-CT parameter most closely resembling the morphometric plaque area) was 78% higher for the 3R4F group versus sham, while manual quantification of plaque area in the isolated aortas showed a 39% higher value following 3R4F CS exposure.
FIG. 4.
Micro computed tomography (micro-CT)-based aortic arch (in situ) plaque measurements. For details, see Supplementary Methods—micro/CT procedures. A, Plaque volume. B, Plaque surface area. C, Aortic occlusion (mean ± SEM). D, Representative micro-CT images.
Plasma and Aortic Arch Lipidomics
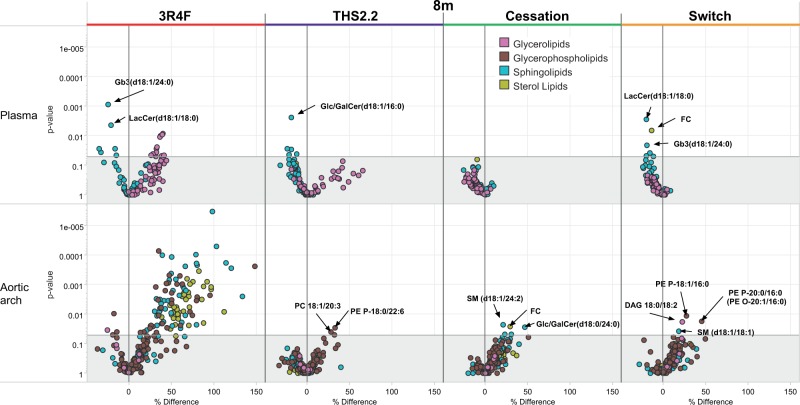
Lipidomics in these 2 tissues was performed at the 8-month time-point. In plasma, a few glycerolipids were significantly more abundant in the 3R4F group, and a similar trend was also observed in the THS2.2 group (although not statistically significant), whereas the cessation group showed no changes in their glycerolipid levels (Figure 5, upper panel). From the other lipid classes, some sphingolipids showed significant decreases in the 3R4F, THS2.2, and switch groups, although these were not always the same lipid molecules. Interestingly, 2 individual ceramides (LacCer(d18:1/18:0) and Gb3(d18:1/24:0)) were lower in both the 3R4F and switch group, while a lower level of Glc/GalCer(d18:1/16:0) was only observed in the THS2.2 group. It is noteworthy that, in general, the THS2.2 and switch groups did not show as strong changes in these lipids as seen the 3R4F group, while no changes were seen in the cessation group.
FIG. 5.
Lipidomics profiles of aortic arch and plasma in Apoe−/− mice exposed for 8 months to cigarette smoke (3R4F), THS2.2, or to a cessation or switch protocol (2 months 3R4F followed by 6 months fresh air or THS2.2, respectively) compared with sham exposure for 8 months. Each dot in the volcano plot represents a measured lipid. Lipid classes, as defined by the Lipid Maps consortium, are color coded and indicated in the legend.
In the aortic arch, the relative differences for all groups compared with sham are shown in the lower panel of Figure 5. In the 3R4F group, glycerophospholipids, sphingolipids, and sterol lipids showed significantly higher levels than in sham, while only small differences in the glycerophospholipids PE P-18:0/22:6 and PC 18:1/20:3 were seen in the THS2.2 group relative to sham. Small increases of a few other lipids, mostly sphingolipids and glycerophospholipids, were detected in the cessation and switch groups.
Lung Function and Lung Volume
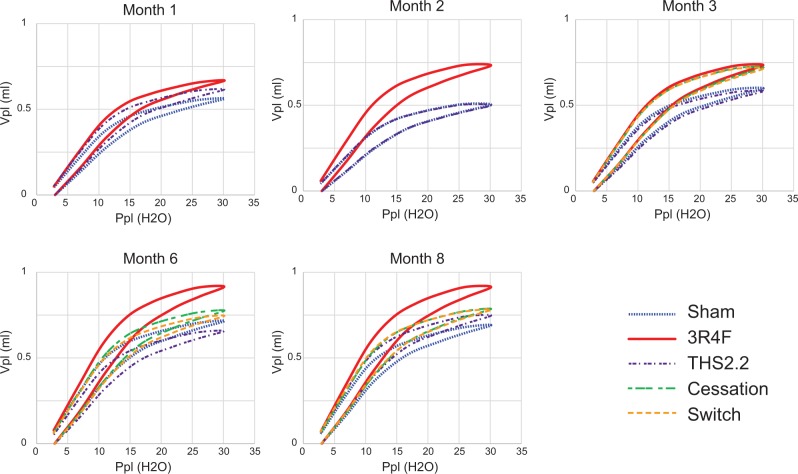
The pressure-volume relationship (PVs-P) demonstrated a typical emphysema-induced upward/leftward shift from the sham curve following CS exposure, indicating a strong CS effect throughout the study period (Figure 6). There was no obvious effect of THS2.2 aerosol exposure on the PVs-P loop compared with the sham mice at any time-points evaluated. Switching and cessation resulted in stabilization of the values while continued 3R4F exposure led to further increases in the PVs-P values.
FIG. 6.
Pressure/volume loops. Lung function was measured in selected animals 18–24 h after exposure using the FlexiVent system (Scireq). “Airway” constriction and lung “stiffness” were assessed by measuring pressure, flow, and volume relationships in the respiratory system, and by using forced oscillations to discriminate between airway and lung tissue variables according to complex mathematical models (for details, see Phillips et al., 2015). The relationship between pressure (Ppl, pressure plethysmography) and the resultant volume (Vpl, volume plethysmography) over an inflation/deflation cycle is shown. Data are means without SDs, n = 9–10.
Other lung function parameters, such as single compartment “snapshot perturbation” measurements of dynamic lung resistance (R), dynamic elastance (E), and dynamic compliance (C), also demonstrated 3R4F CS exposure-related changes, indicating a loss of elastic recoil in the smoke-exposed lungs, which was evident after 1 month of 3R4F exposure (Supplementary Figure 10). Although R changed only slightly with increasing age/study duration, age-related changes in E and C were more prominent, leading to convergence with the 3R4F values from month 3 onwards. In THS2.2 aerosol-exposed mice, the snapshot perturbation parameters did not differ significantly from those observed in the sham group (P > .05). These results are in good agreement with our previous findings in C57BL/6 wt mice (Phillips et al., 2015).
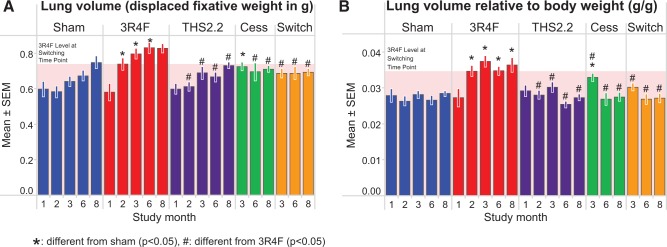
The lung volume (as determined by the fixative displacement method) of 3R4F-exposed mice was significantly higher than of sham- or THS2.2 aerosol-exposed mice (Figure 7, left panel). Both cessation and switching resulted in a rapid return to lung volumes similar to those of the age-matched sham-exposed mice within 1–3 months. Because CS-exposed mice had a lower body weight than mice from the other groups, the group differences were exacerbated when normalizing lung volume to body weight (Figure 7, right panel). The increased lung volume seen in the CS-exposed animals, probably caused by the exposure-related changes to lung compliance and elastance, supports the lung function results, where CS exposure resulted in a leftward shift in the PVsP loop (Figure 6).
FIG. 7.
Lung volume measurements. Lungs were removed and volumes were determined by displacement of fixative under hydrostatic pressure (15 cm H2O). A, Absolute volumes. B, Volumes relative to body weight. Data are means ± SEM, n = 9–10. The shaded area indicates the 3R4F value at the switching/cessation time-point (month 2).
BALF Analysis
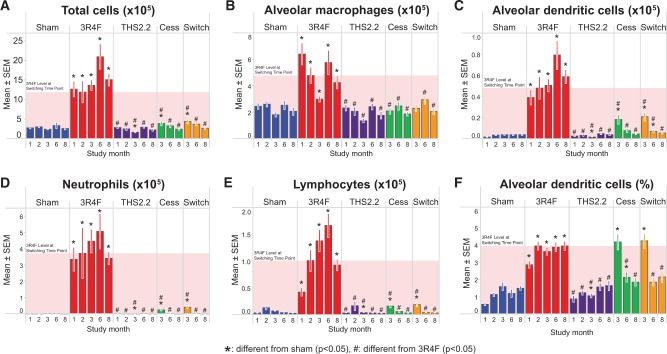
Relative to sham, the absolute number of FLCs (total) was much higher after 1 month of 3R4F CS exposure and continued to be elevated throughout the study, indicating inflammation. In contrast to this CS effect on FLCs, even prolonged exposure to the THS2.2 aerosol had no effect relative to sham-exposed animals (Figure 8A). Both cessation and switching resulted in a rapid decline in total FLC counts, almost reaching the level of sham- or THS2.2 aerosol-exposed mice after just 1 month of cessation, and completely returning to the FLC counts of sham- and THS2.2 aerosol-exposed mice by month 8.
FIG. 8.
Free lung cells in BALF. Light scatter and relative immunofluorescence were measured in BALF cells by flow cytometry. A, Total cell number. B, Macrophage count. C. Dendritic cells, absolute counts. D, Neutrophil count. E, Total number of lymphocytes. F, Dendritic cells, relative numbers. Data are means ± SEM and were analyzed by t test, potentially accounting for variance heterogeneity. The shaded area indicates the 3R4F value at the switching/cessation time-point (month 2).
Similar changes and kinetics were also seen in the FLC subpopulations in 3R4F-exposed mice, indicating that the increased FLC count reflected increases in the numbers of neutrophils, macrophages, lymphocytes, and dendritic cells (Figs. 8B–F). The strongest 3R4F CS exposure-related change was observed for neutrophils, followed by lymphocytes, dendritic cells, and macrophages. The numbers of all cell types returned to the sham/THS2.2 group level upon cessation or switching: macrophages within 1 month, neutrophils and lymphocytes within 4 months, and dendritic cells within 6 months. Macrophage activation markers (CD54, CD86, and CD11b) indicated that the activated subpopulations returned to sham levels within 4 months, with the slowest kinetics observed for CD86+ cells (Supplementary Figure 11). No significant effect on the numbers and differentiation of FLCs was observed for THS2.2 aerosol exposure (Figure 8).
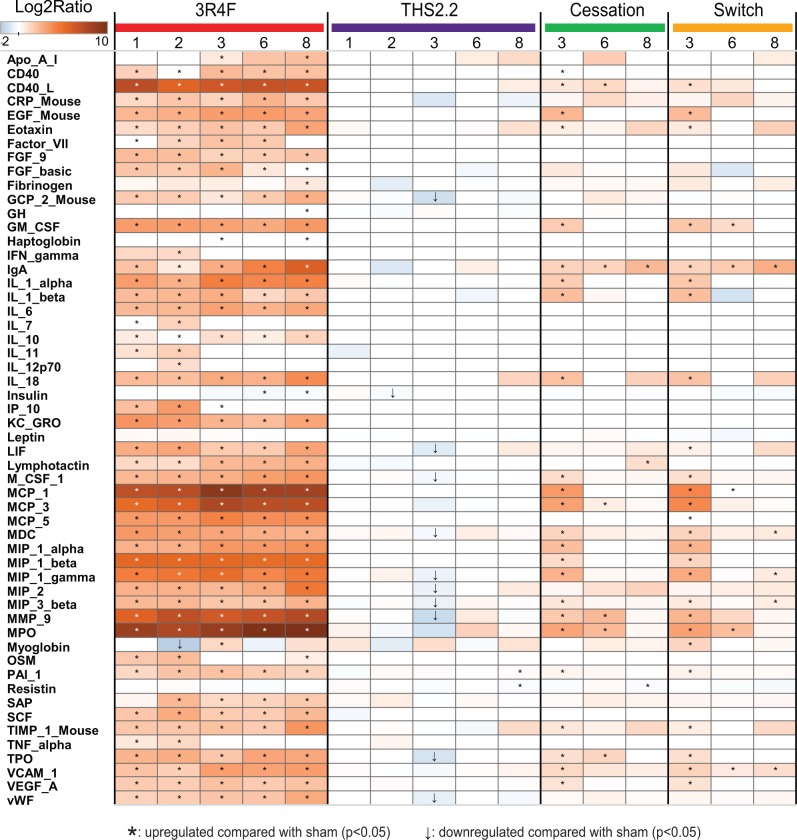
MAP analysis of 63 inflammatory mediators in the BALF resulted in 51 detectable analytes, which are depicted as a heatmap in Figure 9. The most common trend was the rapid increase in expression of most analytes following 1 month of 3R4F CS exposure to levels that generally persisted during the 8 months of exposure. The overall expression of the analytes from THS2.2 aerosol-exposed animals was very similar to that from the sham group. Both switching and cessation resulted in the return of protein levels toward sham/THS2.2 aerosol-exposed group levels, reaching sham levels in most but not all cases; exceptions included immunoglobulin A, eotaxin, interleukin-18, macrophage inflammatory protein (MIP)-2, tissue inhibitor of metalloproteinase (TIMP)-1. Those analytes showing exposure-related changes were mainly associated with inflammation, including many proteins previously observed to respond to CS, such as myeloperoxidase, MIP-1, -2, and -3, monocyte chemoattractant protein-1, -3, and -5, interleukins, as well as several tissue remodeling enzymes and growth factors (vascular cell adhesion molecule, epidermal growth factor, vascular endothelial growth factor, MMP-9, and TIMP-1). The proteolytic activity of the BALF largely paralleled the protein abundance of MMP-9 (Supplementary Figure 12). Taken together, these results are well aligned with the influx of inflammatory cells observed in the BALF (Figure 8). Overall, these results are similar to those observed in our previous study on C57BL/6 wt mice following a similar study design (Phillips et al., 2015).
FIG. 9.
Inflammatory mediators in BALF. Cell-free BALF supernatants were analyzed using a multiplexed bead array. Ratio is given as median of treated mice over median of sham-exposed mice at the same time-point (truncated scale). Only analytes with statistically significant differences compared with sham under at least one condition are shown.
Histopathology of the Respiratory Tract
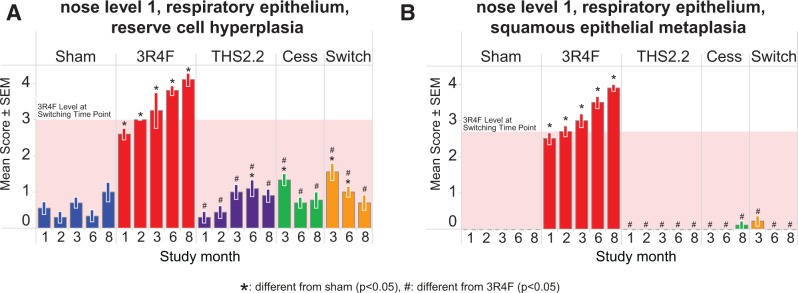
The evaluation of the nose at 3 levels revealed typical CS-related adaptive effects of the nasal epithelia in 3R4F CS-exposed mice, including CS-induced reserve cell hyperplasia and squamous metaplasia of the respiratory epithelium (Figure 10). These effects were most pronounced in nose level 1 sections, and decreased in severity toward the more distal nasal regions; at nose level 4 (the most distal nasal region evaluated), there were no differences in either hyperplasia or metaplasia of the epithelium in any of the exposure groups (Supplementary Results file 2). The effects were not observed in the THS2.2-exposed group. Both cessation and switching resulted in a rapid recovery toward sham-exposed group levels within 1 (squamous metaplasia) or 3 (reserve cell hyperplasia) months post CS-exposure.
FIG. 10.
Adaptive changes of the nasal epithelium. Histopathological assessment of the nose, level 1, respiratory epithelium. A, Reserve cell hyperplasia. B, Squamous metaplasia. Data are means ± SEM, n = 10. The shaded area indicates the 3R4F value at the switching/cessation time-point (month 2).
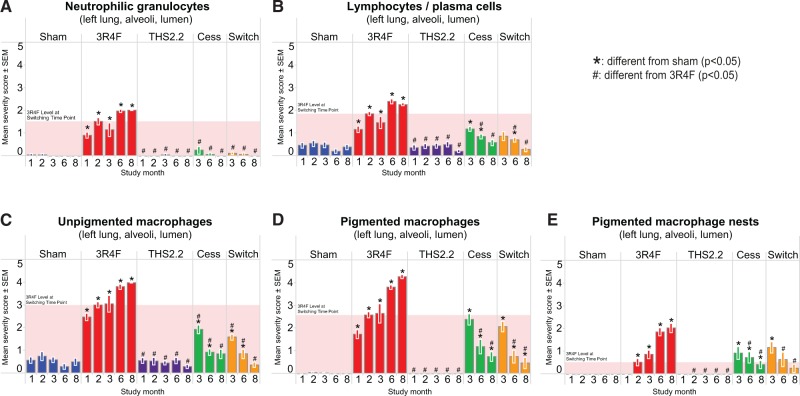
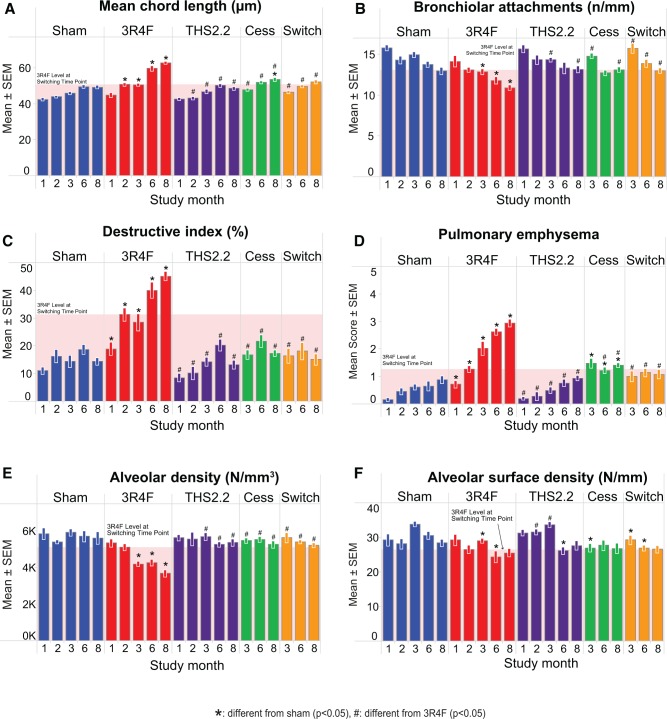
In the lung, typical CS-related effects were observed in 3R4F CS-exposed animals, as seen by the infiltration of inflammatory cells into the alveolar and perivascular spaces (Figure 11), as well as through quantitative lung morphometric measurements and semiquantitative emphysema scoring (Figs. 12A–D). Notably, an increased number of neutrophils, lymphocytes, and macrophages were observed in the alveolar spaces of CS-exposed mice from month 1 onward (Figure 11). Decreases of the inflammatory changes from the levels reached after 2 months of CS exposure were observed in the switch and cessation groups and reached sham levels after 6 months postexposure to CS (except for pigmented macrophages). No significant differences to the sham were seen for THS2.2 aerosol exposure at all time-points. These results agree with the analysis of FLC differential counts seen in BALF.
FIG. 11.
Inflammatory cell infiltration into the alveolar lumen. Histopathological evaluation of lung sections. A, Neutrophils. B, Lymphocytes. C, Unpigmented macrophages. D, Pigmented macrophages. E, Pigmented macrophage nests. Data are means ± SEM, n = 10. The shaded area indicates the 3R4F value at the switching/cessation time-point (month 2).
FIG. 12.
Emphysema assessment by morphometry and histopathological evaluation of lung sections. A–C, Morphometric assessment, classical parameters, A, mean chord length, B, bronchiolar attachments, C, destructive index. D, Semiquantitative histopathological scoring. E and F, Volume-independent morphometric parameters, E, alveolar density, F, alveolar surface density. Mean ± SEM, n = 10. The shaded area indicates the 3R4F value at the switching/cessation time-point (month 2).
The overall lung emphysema score (Figure 12D) showed an increase relative to that of sham-exposed animals from month 1 onwards, with a progressive increase documented over time. An aging effect was also observed, as shown by the score of 0.16 in month 1 and 0.88 in month 8 for sham-exposed mice. No significant differences in the assessment of lung tissue from THS2.2 aerosol-exposed relative to sham-exposed mice were seen. Further progression of an emphysematous condition was measured in the quantitative morphometric assessment of lung tissue (Figs. 12A–C). 3R4F CS exposure resulted in an increased MCL and DI, and a decreased number of BAs in the lungs of exposed mice relative to sham-exposed animals. For the THS 2.2, cessation, and switching groups, these emphysema-related parameters did not differ from the sham, except for cessation with a significantly higher MCL at month 8, and in the emphysema score at months 6 and 8; in these 3 cases, the changes were also significantly different from the 3R4F group, ie, they were just intermediate between sham and continued 3R4F CS exposure. The less volume-dependent parameters, alveolar density (Figure 12E) and alveolar surface density (Figure 12F) followed the same trend with 3R4F CS-related decreases at most time-points and no effects for the other groups at all time-points, although the alveolar surface density was more noisy and hence less sensitive than the other parameters. The reproducibility of sham and 3R4F group values for MCL in this and our previous study on C57BL/6 wt mice is noteworthy: MCL increased over time from 42 to 48 in Apoe−/− mice and from 45 to 50 in wt mice, while the maximum MCL for 3R4F CS exposure was 60 in Apoe−/− mice and 62 in wt mice. The range for the DI was slightly lower (10%–40%) in Apoe−/− mice than in wt mice (8%–58%), as were the severity scores (0.2–3 vs 0.2–4, respectively) (Phillips et al., 2015).
Transcriptomics of Lung Tissue
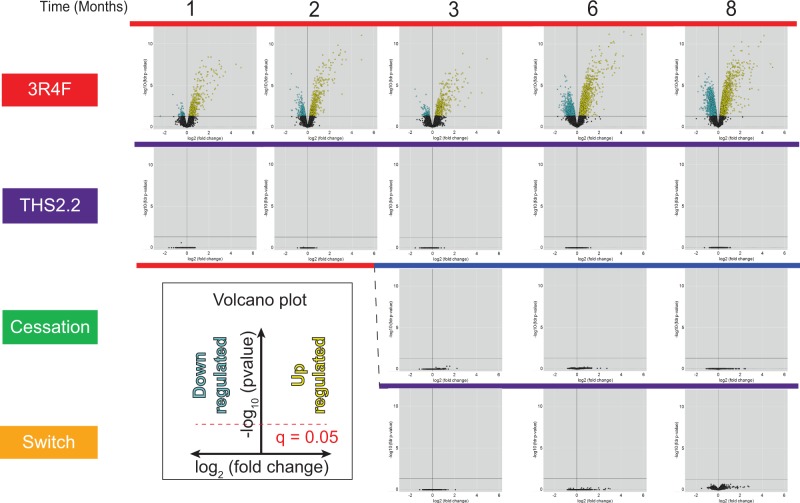
The amplitudes (expressed in the volcano plots as log-fold change, x-axis) and significances (expressed as-log of the adjusted P-value or FDR) of gene expression changes in the lung for 3R4FCS- and THS2.2-aerosol-exposed mice were compared with the sham group at each respective time-point (Figure 13). Under the FDR thresholds, exposure to CS from 3R4F caused the differential expression of approximately 600 genes at month 1, increasing over time to approximately 5100 genes at month 8. Neither exposure to THS2.2 aerosol nor cessation or switching after 2 months of 3R4F CS caused any significant gene expression changes at any time-point (for a raw P-value representation also showing weak responses in these groups, see Supplementary Figure 13).
FIG. 13.
Volcano plots representing the systems response profiles in the lung. Gene expression change, calculated as the log2 fold-change, is plotted on the x-axis and the significance, proportional to the negative log10 (false discovery rate-adjusted P-value), is plotted on the y-axis. Yellow and blue dots highlight genes that are significantly up- or downregulated, respectively, compared with the sham group at each respective time-point. Full color version available online.
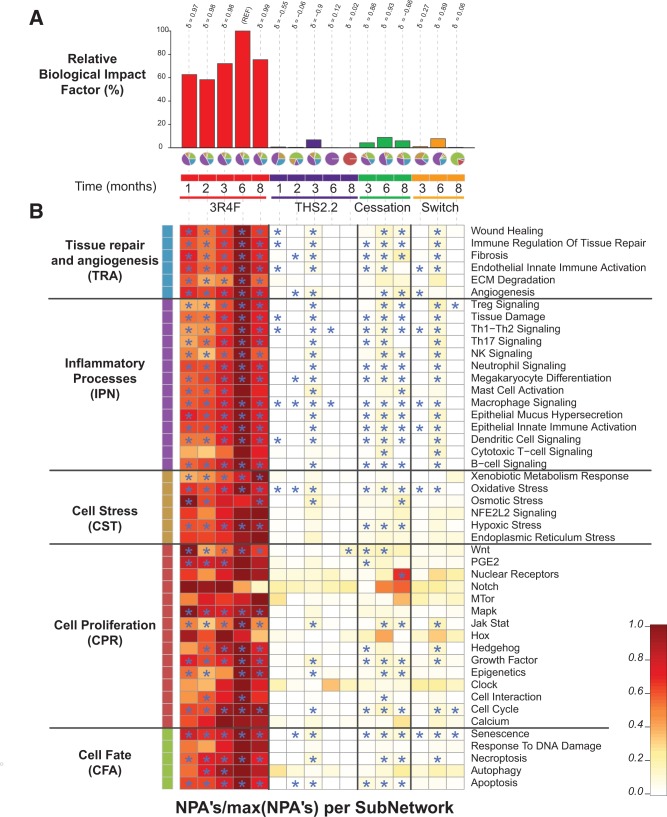
Using the network models, the threshold-free BIF analysis (Figure 14A) returned the highest relative BIF (RBIF) value for the 3R4F group at 6 months (set as 100%). The RBIF for 3R4F CS exposure showed an increasing trend with exposure duration (from 60% at the early time-points to approximately 75% at 8 months). The RBIFs for the THS2.2, cessation, and switching groups were often close to 0% and never exceeded 10% of the biological impact for 3R4F CS. For each treatment comparison, the δ value (−1 to 1) indicates how similar the underlying network perturbations are with respect to the reference (ie, 3R4F group at 6 months). A δ value of 1 indicates that all networks are perturbed by the same mechanisms. The δ-values of 0.97 or higher for all 3R4F CS responses, and of 0.89 and 0.93 for those 6-month cessation and switch RBIFs that were close to 10%, indicate that perturbations of the same mechanisms underlie these RBIFs.
FIG. 14.
Network-based biological impact factor (BIF) and network perturbation amplitude (NPA) analysis from the lung. A, Relative BIF (RBIF) for treatment versus sham. The percentages show the relative biological impact which is derived from the cumulated network perturbations caused by the treatment relative to the reference (defined as the treatment comparison showing the highest perturbation, ie, at the 6-month time-point). For each treatment comparison, the δ value ( − 1 to 1) indicates how similar the underlying network perturbations are with respect to the reference (ie, 3R4F at 6 months). A δ value of 1 indicates that all networks are perturbed by the same mechanisms. The small pie charts underneath the RBIF bars demonstrates the relative contributions by the NPAs of the 5 underlying network models (indicated by the segment colors) which are shown in greater detail in Figure 14B. B, Heatmap of NPA Scores summarizing subnetwork NPAs relative to the maximum NPA in each subnetwork. Stars indicate significant perturbations: a network is considered as perturbed if, in addition to the significance of the NPA score with respect to the experimental variation, the 2 companion statistics (O and K) derived to inform on the specificity of the NPA score with respect to the biology described in the network, are significant. *O and K statistic P-values below 0.05 and significant with respect to the experimental variation.
The small pie charts underneath the bar graph visualize the decomposition of the calculated BIF from the transcriptomics data into its mechanistic components (Figure 14A). The most perturbed biological mechanisms following 3R4F CS exposure belong to the inflammatory processes network (accounting for almost half of the RBIF), while tissue repair and angiogenesis, cell fate, and cell stress network perturbations were additional major contributors (when comparing these NPA results with our previously published NPA analyses, it should be noted that the recently updated versions of the causal biological networks have been applied).
Very little or no perturbation was seen for THS2.2 aerosol exposure except for month 3, with a RBIF around 7% and a composition very similar to that of the 3R4F group. Strongly reduced perturbation patterns were also seen after cessation and switching, indicating an almost complete resolution of CS-related perturbations after 6 months of cessation or switching to THS2.2 aerosol. At the very low RBIF values, the mechanistic composition pie charts indicate deviations in the distribution because only a few subnetworks may still reach statistical significance. This can be followed in Figure 14B which provides a further breakdown of these perturbed mechanisms. In this heatmap, the subnetwork NPAs are shown relative to the maximum value obtained in each category, thereby making relatively weak perturbations visible. This high sensitivity representation shows that the biological mechanisms perturbed in the 3R4F group are either absent or only very weakly perturbed in the THS2.2, cessation, and switching groups, and that no mechanisms other than those seen for 3R4F CS exposure were perturbed in the THS2.2 and switch groups.
Lung Proteomics
The effect of different exposure conditions on the lung proteome was assessed by quantitative proteomics. A total of 5428 proteins were identified in the lung proteome. However, for the reliable identification of differential protein abundance compared with the sham exposure group, only those proteins identified in at least two-thirds of one group were considered, thereby reducing their number to approximately 50%.
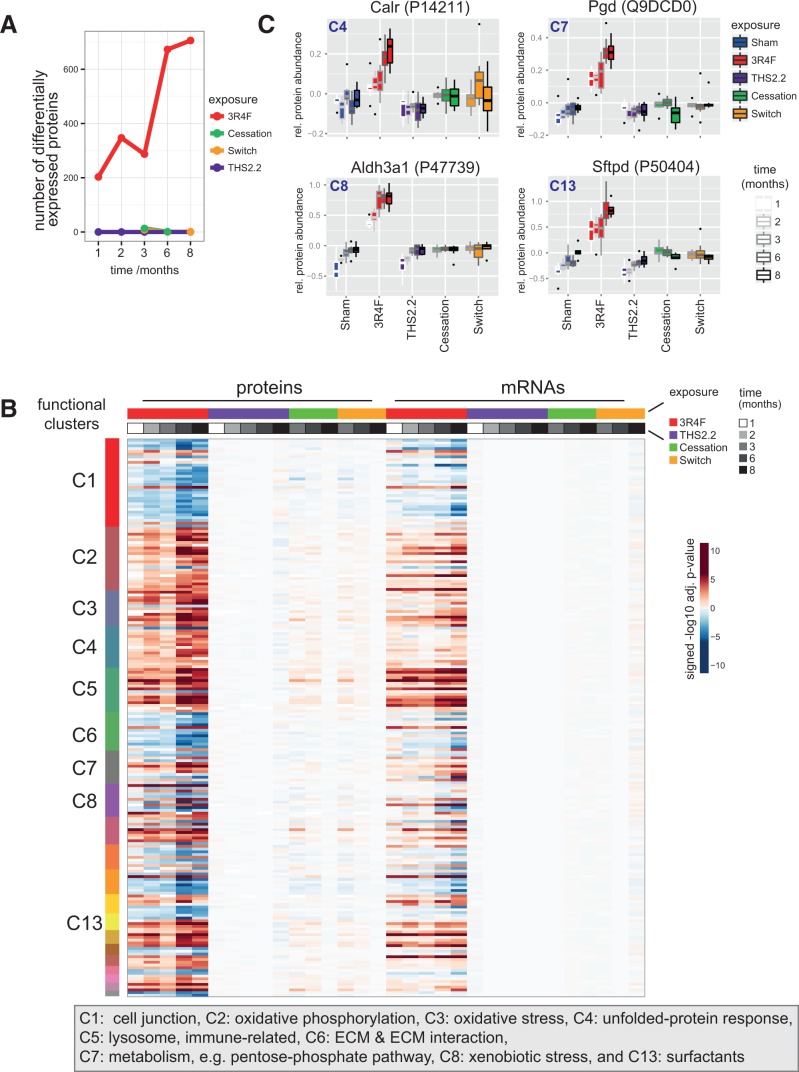
Exposure to 3R4F CS resulted in a clear time-dependent effect on the lung proteome, with the abundance of more than 700 proteins significantly altered after 8 months of 3R4F CS exposure (Figure 15A). There was a particularly significant increase in the number of differentially abundant proteins observed between months 3 and 6. By contrast, exposure to THS2.2 aerosol had no significant effect on protein abundance during the entire 8-month exposure period (Figure 15B). Both cessation and switching to 3R4F CS resulted in a comparable and rapid attenuation of the observable 3R4F CS exposure effects: at the 3-month time-point (1 month after switching/the start of cessation), differential abundance was still detectable for 10 and 8 proteins in the cessation and switching groups, respectively. However, at 8 months, cessation and switching results were matching those of the sham group, with metallothionein-1 being the only remaining upregulated protein in the switching group. Supplementary Figure 14 shows the differential protein abundances as volcano plots.
FIG. 15.
Lung proteomics. A, Number of differentially abundant proteins (DAPs) across exposure conditions and time-points. DAPs with a Benjamini-Hochberg adjusted P-value < .05 were considered. B, Comparison of protein and mRNA response profiles for the identified association clusters across all conditions. Differential expression heatmap (signed log10 adj. P-values) for proteins in the clusters (rows) across all conditions (columns). The cluster membership is indicated by the color bar on the left, and color bars on top indicate the sample groups and data modalities (protein or mRNA measurement). See Supplementary Figure 14 for protein names. C, Sample-level response profiles for selected key proteins representing 4 of the affected biological processes: calreticulin (Calr) for the unfolded-protein response, phosphogluconate dehydrogenase (Pgd) for the pentose-phosphate pathway, aldehyde dehydrogenase 3A1 (Aldh3a1) for xenobiotic metabolism, and surfactant protein D (Sftpd) for the surfactant cluster. Boxplots show the median and interquartile range for each exposure condition and time-point (increasing from left to right).
To gauge which biological effects of CS exposure were covered by our proteomics investigation, a functional association clustering approach (Supplementary Figure 16, and Supplementary file 3 see Supplementary Methods for details) was used. A broad range of exposure effects that were previously reported for CS exposure were observed in our experiment, including a xenobiotic and oxidative stress response, unfolded-protein response, changes in surfactant metabolism, an immune response, and metabolic adaptations including protein upregulation of the pentose-phosphate pathway (Phillips et al., 2015). Comparison of the differential expression response of these functional clusters across conditions reconfirmed the same trends described earlier (Figure 15B, left): a time-dependent 3R4F CS effect, a limited effect of THS2.2 aerosol exposure, and the limited but still visible effects upon cessation and switching that disappeared over time. Strikingly, most of these protein abundance changes were paralleled by expression changes of the respective mRNAs (Figure 15B, right, Supplementary Figure 15).
Finally, some key proteins that were representative of 4 of the affected biological processes were selected to exemplify the observed quantitative responses on the level of individual proteins: calreticulin (Calr) for the unfolded-protein response, phosphogluconate dehydrogenase (Pgd) for the pentose-phosphate pathway, aldehyde dehydrogenase 3A1 (Aldh3a1) for xenobiotic metabolism, and surfactant protein D (Sftpd) for the surfactant cluster (Figure 15C). In a similar manner as observed before, the lack of a 3R4F-like response in the THS2.2 group, as well as the recovery in the cessation and switching groups, was clearly demonstrated.
Histopathology of the Liver and Kidney
Histopathological assessment of the liver focused on hepatocyte fat content (evaluated after oil red O staining), glycogen content (PAS/PASD staining), and additional endpoints including micro-granuloma and micro-hemorrhage. Minimal exposure effects were identified, including a lower mean fat and glycogen content in 3R4F CS-exposed mice, although this was not statistically significant. Differences between the cessation and switching groups were small and also not significant (Supplementary Results file 2).
Kidney findings in the 3R4F group were generally limited to the tissues isolated in month 6 and were characterized by a reduced incidence of thickening of the glomerular basement membrane relative to the sham-exposed groups. There was no difference between THS2.2, switch, or cessation groups regarding this parameter at any time-point. Mesangial matrix expansion was also decreased in the 3R4F CS-exposed mice relative to the other groups. By month 8, the aforementioned CS effects were no longer observed, and all groups were similar across all parameters evaluated (Supplementary Results file 2).
DISCUSSION
The goals of this study were to evaluate the development, progression, and reversibility of atherosclerosis, lung inflammation, and emphysema in Apoe−/−mice following chronic exposure to 3R4F CS, THS2.2 aerosol, or cessation or switching to THS2.2 aerosol, building upon previous studies in Apoe−/− and C57BL/6 mice conducted in our laboratory (Boue et al., 2012, 2013; Lietz et al., 2013; Phillips et al., 2015) and reported by others (Arunachalam et al., 2010; Han et al., 2012).
Vascular Effects: Atherosclerotic Plaque Formation and Lipid Changes
Consistent acceleration of atherosclerotic progression (increasing aortic plaque area and volume) over the age-related increases was only evident in 3R4F CS-exposed mice, not THS2.2 aerosol-exposed mice, and stopping 3R4F CS exposure halted this effect, as shown by its partial regression upon cessation or switching. These results are in agreement with historical data showing increased atherosclerotic plaque development following CS exposure (Han et al., 2012; von Holt et al., 2009) and a partial recovery following cessation (Boue et al., 2012; Lietz et al., 2013).
The single, statistically significant increases in plaque size (planimetry) for THS2.2—as well as for cessation—at the 6-month time-point were not indicative of a consistent increase in plaque size higher than sham over time because these differences were not apparent at the 8-month time-point nor at all earlier time-points. Also, for a consistent THS2.2 effect, one would have expected to see at least the same increase in the switching group that received the same concentration of THS2.2, even on the background on an initial 2-month CS exposure.
The microCT scan results of the “aorta” measurement at month 7 paralleled the aortic arch planimetric results for most groups but did not confirm the increased plaque sizes in the THS2.2 and cessation groups. However, at one of the additional microCT measurement sites, the left subclavian artery, a significantly higher plaque burden was observed for the THS2.2 group. Taken together, this observation indicates an incidental but not consistent exposure-related enhancement of plaque formation for THS2.2 compared with sham within the 8-month observation period and warrants further investigations on this topic.
Aortic arch lipidomics at the 8-month time-point revealed broad upregulation of sphingolipids, glycerophospholipids, and sterol lipids following 3R4F CS exposure, while only marginal increases in a few glycerophospholipids and sphingolipids were observed in the other groups. Importantly, the attenuation of the increases in many lipid species relative to the 3R4F group suggests that THS2.2 aerosol does not exert a comparable effect, and that switching or cessation alleviates the changes caused by 3R4F CS exposure. The results for the 3R4F group are consistent with previous findings, with ceramides, sphingomyelins, and glycosphingolipids being candidates for potent atherogenic lipids (Boue et al., 2012). The recovery after 2 months of CS exposure followed by a 6-month cessation, however, was much more pronounced than in the previous study with a 3-month CS exposure plus 3-month cessation period (Lietz et al., 2013). This is consistent with the assumption that shorter exposure periods combined with longer postexposure periods are more efficient at restoring lipids back to less atherogenic levels.
Systemic Effects: Liver and Blood Responses
In the liver, typical lipid accumulation effects caused by the Apoe deficiency were seen in all groups, including sham, to a similar extent, and no additional exposure-related histological effects could be distinguished on this background.
The observed decrease in blood glucose levels, a common finding in normal chow-fed mice and rats following CS exposure (Chen et al., 2007; Terpstra et al., 2003), cannot readily be explained by a possible nicotine effect (Vu et al., 2014) because the effect was absent in THS2.2 aerosol-exposed mice receiving the same doses of nicotine. These differences in plasma analytes were largely reversed within 1 month following either cessation or switching to THS2.2 aerosol exposure.
Plasma lipid/lipoprotein profiles were obtained from 2 cohorts of mice using 2 independent methods, the autoanalyzer (enzymatic/biochemical) method and the VAP (ultracentrifugation). VAP was chosen because of its high sensitivity and resolution allowing to measure also subclasses of HDL, LDL, and VLDL (Kulkarni, 2006). Independent of the method applied, high interindividual variability and small effect size resulted in only a few number of statistically significant differences In the plasma, 3R4F CS exposure-related changes in lipoprotein profiles (TC, VLDL, and HDL), particularly during the early exposure months, corresponded with the high atherosclerotic plaque burden. This finding on HDL is in agreement with previous clinical studies, which showed that smoking cessation improved the plasma HDL profile (Gepner et al., 2011). Both approaches had limitations especially with the month-to-month variability that is particularly obvious in the triglycerides measurements for all groups but cessation (both methods), and also in the HDL and LDL measurements for the sham and/or 3R4F groups (Figure 2, Supplementary Figure 8). Even for the overall weak but consistent effect of 3R4F versus sham, our statistics for the pairwise comparisons at each time-point indicates, at the given variability, statistical significance for only a few changes (error bars indicate SEM, not SD). In this picture, the apparent trend of increasing triglyceride values over time, in the absence of significant differences to the sham at any time-point, is not plausible, also with regard to the absent increase in the switch group.
As a third independent assessment of blood lipids, we assessed the plasma lipidomics at month 8, providing among other lipid class concentrations also the concentrations of the glycerolipids. Again, only in the 3R4F group several glycerolipid species displayed a statistically significantly higher level than in the sham, and also in this measurement the apparent trend of increased glycerolipids in the THS2.2 group is not statistically significant and not supported by the switch group results. Several ceramides/sphingolipids were decreased at the 8-month time-point in the 3R4F group, thereby resembling some of our previously observed decreases at the 6-month time-point (Boue et al., 2012). We speculate that the accumulation of sphingolipids in the vascular wall could at least in part lead to their reduced levels in the plasma.
Taken together, these results indicate that 3 different approaches showing weak but consistent responses for 3R4F did not reveal an overall consistent effect of THS2.2 exposure on blood lipid profiles within the limitations of the current study design (6 replicates per group) and resolution of the methods applied.
Respiratory Effects: Upper Airway Irritation
The observed reserve cell hyperplasia and squamous metaplasia of the respiratory epithelium at nose levels 1–3 in response to 3R4F CS exposure resembled the typical CS exposure-related adaptive effects of the rodent nasal epithelia described previously (Kogel et al., 2014; Stinn et al., 2010; Terpstra et al., 2003; Werley et al., 2008). Also, as previously observed, these adaptive changes were completely reversible upon CS exposure cessation. The THS2.2 aerosol did not elicit changes except from mild reserve cell hyperplasia at nose level 1 (the most sensitive site) at month 6. The effects after switching from 3R4F CS to THS2.2 aerosol were similar to switching from 3R4F CS to fresh air (cessation), or sham exposure.
Respiratory Effects: Lung Inflammation and Emphysema
A rapidly induced and sustained pulmonary inflammation was evident in 3R4F CS-exposed mice based on multiple measured parameters. The observed rapid (≤ 1 month) influx of inflammatory cells (neutrophils, lymphocytes, and macrophages) was accompanied by changes in numerous inflammatory mediators identified in the BALF. The increased proteolytic activity, together with increased abundance of MMP-9 and its inhibitor, TIMP-1, may indicate that extracellular matrix remodeling accompanies the alveolar destruction in emphysema (Foronjy et al., 2008). These lung inflammatory parameters closely resemble the previously observed changes in response to 3R4F CS exposure in Apoe−/− and C57BL/6 wt mice (Boue et al., 2013; Phillips et al., 2015). Exposure to the THS2.2 aerosol caused few changes to lung inflammation parameters relative to sham-exposed mice, which did not show a consistent pattern over time. Following cessation or switching, a rapid decrease in pulmonary inflammation in terms of cell infiltrate and expression of mediators was seen. These results were fully supported by the numbers of neutrophils, macrophages, macrophage nests, and lymphocytes observed in the histological sections of the lung.
Progressive emphysematous changes in 3R4F CS-exposed mice were indicated by various endpoints supporting each other such as lung function, lung volume, and histopathology. Lung function analysis in Apoe−/− mice was previously reported only from a subacute (3 days) exposure model demonstrating similar CS effects in 2 strains of mice but with different baseline values and relative changes from sham-exposed mice (Arunachalam et al., 2010). In this study, the results from the respiratory physiology, i.e., the PVs-P loops and the values for compliance, elastance, and resistance (Supplementary Figure 10), indicated emphysematous changes following 3R4F CS exposure. This indication was further supported by the CS-induced increases in lung volume under static pressure. No difference to the sham was seen for THS2.2 aerosol exposure, and switching and cessation resulted in a partial recovery after 4 months but the PVs-P did not completely revert back to the sham level. Compared with previous results from C57BL/6 wt mice (Phillips et al., 2015), these findings indicate a delayed emphysema development relative to C57BL/6 wt mice, while showing the same overall effects regarding CS-induced progression of emphysematous changes and halting upon cessation or switching. These differences may either be attributed to the knockout of the Apoe gene directly or indirectly to the 40% lower daily exposure dose in the Apoe study relative to the C57BL/6 wt study, which was necessary for Apoe−/− mice because of their lower tolerance to CS (Boue et al., 2013).
Histologically, these emphysematous changes were supported by semiquantitative scoring as well as lung morphometry. Both evaluations revealed a significant increase over time in emphysema-related parameters/scores in 3R4F CS-exposed lungs, exceeding an increasing trend with age that was seen in the sham-exposed lungs. THS2.2 aerosol-exposed lungs were indistinguishable from sham, and switching or cessation inhibited the further progression of these parameters, leading to convergence with the sham/THS2.2 group levels. This observation parallels the findings in the previous study on C57BL/6 wt mice, in which the progression of emphysema was also halted upon cessation or switching at the 2-month level (Phillips et al., 2015). These structural parameters, interpreted together with the increased lung volume at fixed pressure (volumetric measurements and Pv-SP), are indicative of the development of emphysema (see also Knudsen et al., 2010) in response to 3R4F CS exposure.
At the transcriptomics/network modeling level, 3R4F CS exposure had a major impact (almost half of the overall RBIF) on inflammatory processes, while cell fate, tissue repair, and angiogenesis, and cell stress had a weaker impact on the overall RBIF. Although several mechanisms related to cell proliferation were significantly perturbed at all time-points, their contribution to the overall RBIF was low. The lack of impact of THS2.2 aerosol exposure at all time-points except the approximately 7% RBIF at 3 months, as well as nearly complete recovery at month 8 in the cessation and switching groups, were also illustrated by the NPA analysis.
Some stress- and metabolism-related molecular mechanisms involved in the lung response to 3R4F CS that were less evident from the NPA analysis were revealed by proteomic analysis. These included changes in the abundance of proteins involved in energy metabolism, metabolic activation, oxidative stress, and the unfolded-protein response as well as in intercellular and cell-matrix signaling and surfactant production, which overall resembled the proteomics results in C57BL/6 wt mice (Phillips et al., 2015).
CONCLUSIONS
These results collectively show that CS accelerated the development of atherosclerotic plaques and emphysema, as demonstrated by a number of anatomical and molecular disease indicators. By contrast, the chronic exposure of mice to a THS2.2 aerosol (with nicotine concentration matched to CS) had minimal biological impact on disease endpoints and weak effects on molecular endpoints. Although the 2-month exposure of mice to CS resulted in early manifestations of emphysema and atherosclerosis endpoints, both switching and cessation resulted in a partial (lung function, plaque area, and lung morphometry) or even complete (pulmonary inflammation) recovery to sham-exposed levels. This systems toxicology approach, investigating both respiratory and CVD mechanisms in the same study, provides extensive insights including molecular mechanisms that may support an integrated product risk assessment of THS2.2, including the biological effects of cessation/switching compared with continuous smoking.
FUNDING
The study was solely funded and sponsored by Philip Morris International, and all authors except for W.K.S. and A.B. are (or were at the time of the study) employees of Philip Morris International. W.K.S. is contracted and paid by Philip Morris International. A.B. is an employee of Histovia GmbH which was contracted and paid by Philip Morris International to perform the histopathological analysis.
Supplementary Material
ACKNOWLEDGMENTS
The authors acknowledge and thank the members of the bioresearch and aerosol generation teams at PMIRL-S for their technical contributions.
SUPPLEMENTARY DATA
Supplementary data are available online at http://toxsci.oxfordjournals.org/.
REFERENCES
- Arunachalam G., Sundar I. K., Hwang J. W., Yao H., Rahman I. (2010). Emphysema is associated with increased inflammation in lungs of atherosclerosis-prone mice by cigarette smoke: Implications in comorbidities of COPD. J. Inflamm. 7, 34. [DOI] [PMC free article] [PubMed] [Google Scholar]
- Bakhru A., Erlinger T. P. (2005). Smoking cessation and cardiovascular disease risk factors: Results from the third national health and nutrition examination survey. PLoS Med. 2, e160. [DOI] [PMC free article] [PubMed] [Google Scholar]
- Bartalesi B., Cavarra E., Fineschi S., Lucattelli M., Lunghi B., Martorana P., Lungarella G. (2005). Different lung responses to cigarette smoke in two strains of mice sensitive to oxidants. Eur. Respir. J. 25, 15–22. [DOI] [PubMed] [Google Scholar]
- Boue S., De Leon H., Schlage W. K., Peck M. J., Weiler H., Berges A., Vuillaume G., Martin F., Friedrichs B., Lebrun S., et al. (2013). Cigarette smoke induces molecular responses in respiratory tissues of ApoE-/- mice that are progressively deactivated upon cessation. Toxicology 314, 112–124. [DOI] [PubMed] [Google Scholar]
- Boue S., Talikka M., Westra J. W., Hayes W., di Fabio A., Park J., Schlage W. K., Sewer A., Fields B., Ansari S., et al. (2015). Causal biological network database: A comprehensive platform of causal biological network models focused on the pulmonary and vascular systems. Database 2015, bav030. [DOI] [PMC free article] [PubMed] [Google Scholar]
- Boue S., Tarasov K., Janis M., Lebrun S., Hurme R., Schlage W., Lietz M., Vuillaume G., Ekroos K., Steffen Y., et al. (2012). Modulation of atherogenic lipidome by cigarette smoke in apolipoprotein E-deficient mice. Atherosclerosis 225, 328–334. [DOI] [PubMed] [Google Scholar]
- Chan J. S., Vuillaume G., Bever C., Lebrun S., Lietz M., Steffen Y., Stolle K., Wahba K., Wang X., Moodie S., et al. (2012). The Apoe-/- Mouse PhysioLab® Platform: A validated physiologically-based mathematical model of atherosclerotic plaque progression in the Apoe-/- mouse. Biodiscovery 3, 1–13. [Google Scholar]
- Chen H., Hansen M. J., Jones J. E., Vlahos R., Anderson G. P., Morris M. J. (2007). Detrimental metabolic effects of combining long-term cigarette smoke exposure and high-fat diet in mice. Am. J. Physiol. Endocrinol. Metab. 293, E1564–E1571. [DOI] [PubMed] [Google Scholar]
- Dhariwal J., Tennant R. C., Hansell D. M., Westwick J., Walker C., Ward S. P., Pride N., Barnes P. J., Kon O. M., Hansel T. T. (2014). Smoking cessation in COPD causes a transient improvement in spirometry and decreases micronodules on high-resolution CT imaging. Chest 145, 1006–1015. [DOI] [PMC free article] [PubMed] [Google Scholar]
- Food and Drug Administration F. (2009). Family Smoking Prevention And Tobacco Control Act. In (F. Food and Drug Administration, Ed). Public Law 111-31, pp. 21 U.S.C 387 k. [Google Scholar]
- Food and Drug Administration F. (2012). Modified Risk Tobacco Product Applications: Draft Guidance for Industry, http://www.fda.gov/downloads/TobaccoProducts/Labeling/RulesRegulationsGuidance/UCM297751.pdf. [Google Scholar]
- Foronjy R., Nkyimbeng T., Wallace A., Thankachen J., Okada Y., Lemaitre V., D’Armiento J. (2008). Transgenic expression of matrix metalloproteinase-9 causes adult-onset emphysema in mice associated with the loss of alveolar elastin. Am. J. Physiol. Lung Cell. Mol. Physiol. 294, L1149–L1157. [DOI] [PubMed] [Google Scholar]
- Franceschini A., Szklarczyk D., Frankild S., Kuhn M., Simonovic M., Roth A., Lin J., Minguez P., Bork P., von Mering C., et al. (2013). STRING v9.1: Protein-protein interaction networks, with increased coverage and integration. Nucleic Acids Res. 41, D808–D815. [DOI] [PMC free article] [PubMed] [Google Scholar]
- Gepner A. D., Piper M. E., Johnson H. M., Fiore M. C., Baker T. B., Stein J. H. (2011). Effects of smoking and smoking cessation on lipids and lipoproteins: Outcomes from a randomized clinical trial. Am. Heart J. 161, 145–151. [DOI] [PMC free article] [PubMed] [Google Scholar]
- GOLD. (2014). Global strategy for the diagnosis, management, and prevention of chronic obstructive disease (updated 2014): Global Initiative for Chronic Obstructive Lung Disease, Inc. [cited 2014 April 04]. Available at: http://www.goldcopd.org/uploads/users/files/GOLD_Report_2014_Jan23.pdf Accessed December 1, 2015. [Google Scholar]
- Han S. G., Howatt D. A., Daugherty A., Gairola C. G. (2012). Atherogenic and pulmonary responses of ApoE- and LDL receptor-deficient mice to sidestream cigarette smoke. Toxicology 299, 133–138. [DOI] [PubMed] [Google Scholar]
- Hoeng J., Deehan R., Pratt D., Martin F., Sewer A., Thomson T. M., Drubin D. A., Waters C. A., de Graaf D., Peitsch M. C. (2012). A network-based approach to quantifying the impact of biologically active substances. Drug Discov. Today 17, 413–418. [DOI] [PubMed] [Google Scholar]
- Hoeng J., Talikka M., Martin F., Sewer A., Yang X., Iskandar A., Schlage W. K., Peitsch M. C. (2013). Case study: The role of mechanistic network models in systems toxicology. Drug Discov. Today 19, 183–192. [DOI] [PubMed] [Google Scholar]
- Jensen R. P., Luo W., Pankow J. F., Strongin R. M., Peyton D. H. (2015). Hidden formaldehyde in e-cigarette aerosols. N. Engl. J. Med. 372, 392–394. [DOI] [PubMed] [Google Scholar]
- Knudsen L., Weibel E. R., Gundersen H. J., Weinstein F. V., Ochs M. (2010). Assessment of air space size characteristics by intercept (chord) measurement: An accurate and efficient stereological approach. J. Appl. Physiol. 108, 412–421. [DOI] [PubMed] [Google Scholar]
- Kogel U., Schlage W. K., Martin F., Xiang Y., Ansari S., Leroy P., Vanscheeuwijck P., Gebel S., Buettner A., Wyss C., et al. (2014). A 28-day rat inhalation study with an integrated molecular toxicology endpoint demonstrates reduced exposure effects for a prototypic modified risk tobacco product compared with conventional cigarettes. Food Chem. Toxicol. 68, 204–217. [DOI] [PubMed] [Google Scholar]
- Kulkarni K. R. (2006). Cholesterol profile measurement by vertical auto profile method. Clin. Lab. Med. 26, 787–802. [DOI] [PubMed] [Google Scholar]
- Lietz M., Berges A., Lebrun S., Meurrens K., Steffen Y., Stolle K., Schueller J., Boue S., Vuillaume G., Vanscheeuwijck P., et al. (2013). Cigarette-smoke-induced atherogenic lipid profiles in plasma and vascular tissue of apolipoprotein E-deficient mice are attenuated by smoking cessation. Atherosclerosis 229, 86–93. [DOI] [PubMed] [Google Scholar]
- Martin F., Sewer A., Talikka M., Xiang Y., Hoeng J., Peitsch M. C. (2014). Quantification of biological network perturbations for mechanistic insight and diagnostics using two-layer causal models. BMC Bioinformatics 15, 238. [DOI] [PMC free article] [PubMed] [Google Scholar]
- Martin F., Thomson T. M., Sewer A., Drubin D. A., Mathis C., Weisensee D., Pratt D., Hoeng J., Peitsch M. C. (2012). Assessment of network perturbation amplitude by applying high-throughput data to causal biological networks. BMC Syst. Biol. 6, 54. [DOI] [PMC free article] [PubMed] [Google Scholar]
- Moennikes O., Vanscheeuwijck P. M., Friedrichs B., Anskeit E., Patskan G. J. (2008). Reduced toxicological activity of cigarette smoke by the addition of ammonia magnesium phosphate to the paper of an electrically heated cigarette: Subchronic inhalation toxicology. Inhal. Toxicol. 20, 647–663. [DOI] [PMC free article] [PubMed] [Google Scholar]
- Ochs M. (2014). Estimating structural alterations in animal models of lung emphysema. Is there a gold standard? Ann. Anat. 196, 26–33. [DOI] [PubMed] [Google Scholar]
- Office of the Surgeon General U. S., Centers for Disease Control and Prevention (US), National Center for Chronic Disease Prevention and Health Promotion (US), and Office on Smoking and Health (US). (2010). How Tobacco Smoke Causes Disease: The Biology and Behavioral Basis for Smoking-Attributable Disease: A Report of the Surgeon General. Centers for Disease Control and Prevention (US) Atlanta GA, http://stacks.cdc.gov/view/cdc/6067/cdc_6067_DS1.pdf. Accessed December 1, 2015. [PubMed] [Google Scholar]
- Pauwels R. A., Rabe K. F. (2004). Burden and clinical features of chronic obstructive pulmonary disease (COPD). Lancet 364, 613–620. [DOI] [PubMed] [Google Scholar]
- Phillips B., Veljkovic E., Peck M. J., Buettner A., Elamin A., Guedj E., Vuillaume G., Ivanov N. V., Martin F., Boue S., et al. (2015). A 7-month cigarette smoke inhalation study in C57BL/6 mice demonstrates reduced lung inflammation and emphysema following smoking cessation or aerosol exposure from a prototypic modified risk tobacco product. Food Chem. Toxicol. 80, 328–345. [DOI] [PubMed] [Google Scholar]
- Postma D. S., Bush A., van den Berge M. (2015). Risk factors and early origins of chronic obstructive pulmonary disease. Lancet 385, 899–909. [DOI] [PubMed] [Google Scholar]
- Price J. F., Mowbray P. I., Lee A. J., Rumley A., Lowe G. D., Fowkes F. G. (1999). Relationship between smoking and cardiovascular risk factors in the development of peripheral arterial disease and coronary artery disease: Edinburgh Artery Study. Eur. Heart J. 20, 344–353. [DOI] [PubMed] [Google Scholar]
- Rampling M. W. (1993). Clotting factors and rheology: Mechanisms of damage and intervention. In: Cardiovascular Disease: Risk Factors and Intervention (Poulter N., Sever P., Thom S., Eds.), pp. 201–213. Radcliffe Medical Press; Oxford. [Google Scholar]
- Scherle W. (1970). A simple method for volumetry of organs in quantitative stereology. Mikroskopie 26, 57–60. [PubMed] [Google Scholar]
- Schorp M. K., Tricker A. R., Dempsey R. (2012). Reduced exposure evaluation of an electrically heated cigarette smoking system. Part 1: Non-clinical and clinical insights. Regul. Toxicol. Pharmacol. 64, S1–S10. [DOI] [PubMed] [Google Scholar]
- Siasos G., Tsigkou V., Kokkou E., Oikonomou E., Vavuranakis M., Vlachopoulos C., Verveniotis A., Limperi M., Genimata V., Papavassiliou A. G., et al. (2014). Smoking and atherosclerosis: Mechanisms of disease and new therapeutic approaches. Curr. Med. Chem. 21, 3936–3948. [DOI] [PubMed] [Google Scholar]
- Stinn W., Arts J. H., Buettner A., Duistermaat E., Janssens K., Kuper C. F., Haussmann H. J. (2010). Murine lung tumor response after exposure to cigarette mainstream smoke or its particulate and gas/vapor phase fractions. Toxicology. 275, 10–20. [DOI] [PubMed] [Google Scholar]
- Sturla S. J., Boobis A. R., Fitzgerald R. E., Hoeng J., Kavlock R. J., Schirmer K., Whelan M., Wilks M. F., Peitsch M. C. (2014). Systems toxicology: From basic research to risk assessment. Chem. Res. Toxicol. 27, 314–329. [DOI] [PMC free article] [PubMed] [Google Scholar]
- Terpstra P. M., Teredesai A., Vanscheeuwijck P. M., Verbeeck J., Schepers G., Radtke F., Kuhl P., Gomm W., Anskeit E., Patskan G. (2003). Toxicological evaluation of an electrically heated cigarette. Part 4: Subchronic inhalation toxicology. J. Appl. Toxicol. 23, 349–362. [DOI] [PubMed] [Google Scholar]
- Thomson T. M., Sewer A., Martin F., Belcastro V., Frushour B., Gebel S., Park J., Schlage W. K., Talikka M., Vasilyev D. M., et al. (2013). Quantitative assessment of biological impact using transcriptomic data and mechanistic network models. Toxicol. Appl. Pharmacol. 272, 863–878. [DOI] [PubMed] [Google Scholar]
- Vasquez S. X., Gao F., Su F., Grijalva V., Pope J., Martin B., Stinstra J., Masner M., Shah N., Weinstein D. M., et al. (2011). Optimization of microCT imaging and blood vessel diameter quantitation of preclinical specimen vasculature with radiopaque polymer injection medium. PLoS One 6, e19099. [DOI] [PMC free article] [PubMed] [Google Scholar]
- Veniant M. M., Withycombe S., Young S. G. (2001). Lipoprotein size and atherosclerosis susceptibility in Apoe(-/-) and Ldlr(-/-) mice. Arterioscler. Thromb. Vasc. Biol. 21, 1567–1570. [DOI] [PubMed] [Google Scholar]
- Vizcaino J. A., Deutsch E. W., Wang R., Csordas A., Reisinger F., Rios D., Dianes J. A., Sun Z., Farrah T., Bandeira N., et al. (2014). ProteomeXchange provides globally coordinated proteomics data submission and dissemination. Nat. Biotechnol. 32, 223–226. [DOI] [PMC free article] [PubMed] [Google Scholar]
- von Holt K., Lebrun S., Stinn W., Conroy L., Wallerath T., Schleef R. (2009). Progression of atherosclerosis in the Apo E-/- model: 12-month exposure to cigarette mainstream smoke combined with high-cholesterol/fat diet. Atherosclerosis 205, 135–143. [DOI] [PubMed] [Google Scholar]
- Vu C. U., Siddiqui J. A., Wadensweiler P., Gayen J. R., Avolio E., Bandyopadhyay G. K., Biswas N., Chi N. W., O’Connor D. T., Mahata S. K. (2014). Nicotinic cholinergic receptors in glucose homeostasis: The acute hyperglycemic and chronic insulin-sensitive effects of nicotine suggest dual opposing roles of the receptors in male mice. Endocrinology 155, 3793–3805. [DOI] [PubMed] [Google Scholar]
- Werley M. S., Freelin S. A., Wrenn S. E., Gerstenberg B., Roemer E., Schramke H., Van Miert E., Vanscheeuwijck P., Weber S., Coggins C. R. (2008). Smoke chemistry, in vitro and in vivo toxicology evaluations of the electrically heated cigarette smoking system series K. Regul. Toxicol. Pharmacol. 52, 122–139. [DOI] [PubMed] [Google Scholar]
Associated Data
This section collects any data citations, data availability statements, or supplementary materials included in this article.


