Abstract
Single-cell electrical phenotyping (e.g., specific membrane capacitance (Cm) and cytoplasm conductivity (σp)) has long been regarded as potential label-free biophysical markers in tumor status evaluation. However, previous studies only reported the differentiation of tumor cell lines without classifying real tumor samples using cellular electrical properties. In this study, two types of mouse tumor models were constructed by injecting two types of tumor cell lines (A549 and H1299), respectively. Then tumor portions were retrieved for immunohistochemistry studies and single-cell electrical phenotyping based on home-developed microfluidic platforms. Immunohistochemistry results of tumor samples confirmed the adenocarcinoma and large-cell carcinoma characteristics for A549 and H1299 based tumor samples, respectively. Meanwhile, cellular Cm and σp were characterized as 2.25 ± 0.50 μF/cm2 and 0.96 ± 0.20 S/m for A549 based tumor samples (ncell = 1336, Mouse I, II, III) and 1.76 ± 0.54 μF/cm2 and 1.35 ± 0.28 S/m for H1299 based tumor samples (ncell = 1442, Mouse IV, V, VI). Significant differences in Cm and σp were observed between these two types of tumor samples, validating the feasibility of using Cm and σp for mouse tumor classification.
Single-cell electrical phenotyping (e.g., the quantification of specific membrane capacitance (Cm) and cytoplasm conductivity (σp)) is important for understanding cellular functions and status1,2, enabling the classification of tumor cells3,4,5,6 , stem cells7,8,9,10 and blood cells11,12,13,14,15,16.
In the field of electrical phenotyping of tumor cells, there are mainly two conventional techniques, which are dielectrophoresis and electrorotation17,18. In dielectrophoresis, cells attached to dielectrophoretic electrodes at specific frequencies were counted, and the number of attached cells was then translated to intrinsic electrical properties19. Based on this technique, electrical property variations of tumor cells with different malignant levels (e.g., normal keratinocytes versus oral squamous cell carcinoma cell lines4,20,21) and different anti-drug capabilities (e.g., K562 cells vs. their multidrug resistant derivatives3, MCF 7 cells vs. their multidrug resistant derivatives5) were reported. However, this technique can only provide electrical properties based on batch testing and cannot quantify electrical properties at the single cell level.
In electrorotation, a rotating electric field is applied to rotate a suspended cell as a result of Maxwell-Wanger polarization22,23. Based on this technique, electrical property variations of tumor cells with different anti-drug capabilities (e.g., K562 cells vs. their multidrug resistant derivatives24) were reported. However, in electrorotation, cell manipulation and positioning in the rotating electric field is time consuming and labor intensive.
With the development of microfluidics featured with typical dimensions in the range of 1–100 μm25,26, micro electrical impedance spectroscopy was proposed for cell classification at the single cell level27,28,29,30. Frazier et al. sucked cells on top of electrodes and classified breast31 as well as head and neck cells32 with different malignant levels. Sun et al. aspirated single cells through a microfluidics based constriction channel (cross sectional area smaller than biological cells) for cellular impedance measurement, enabling classification of breast tumor cells and their multiple drug resistant counterparts33. However, these classifications can only quantify size-dependent electrical parameters which are heavily dependent on experimental conditions, which cannot indicate intrinsic cellular electrical properties (Cm and σp).
Recently, we proposed a microfluidic platform enabling the high-throughput quantification of Cm and σp by modeling the cellular travelling process within the constriction design34,35. Using this system, electrical variations of paired high- and low-metastatic carcinoma strains, as well as tumor cells with single oncogenes under regulation were reported based on measurement results from hundreds of cells6. However, previous studies only reported the differentiation of tumor cell lines without classifying real tumor samples using Cm and σp.
To address this issue, in this study, we conducted single-cell electrical phenotyping of two types of mouse tumor samples, which were constructed by injecting two types of tumor cell lines, respectively. Then tumor portions were retrieved for single-cell electrical phenotyping based on the home-developed microfluidic platforms. Significant differences in Cm and σp were observed between these two types of tumor samples, validating the feasibility of using Cm and σp for mouse tumor classification.
Materials and Methods
Materials
Materials used for isolation of solid tumor samples include CytoSelect™ Clonogenic Tumor Cell Isolation Kit (Cell Biolabs, Inc. San Diego, CA, USA) and collagenase II (Sigma, St. Louis, MO, USA). All cell-culture reagents were purchased from Life Technologies Corporation (Carlsbad, CA, USA) unless otherwise specified. The materials used for the fabrication of microfluidic devices were SU-8 photoresist (MicroChem Corp, Newton, MA, USA) and 184 silicone elastomer (Dow Corning Corp., Midland, MI, USA).
Mouse Tumor Formation, Retrieval, and Colony Formation
Female BALB/c-nude mice were obtained from the Experimental Animal Center of NICPBP (China’s National Institute for the Control of Pharmaceutical and Biologic Products). Mice were maintained in a pathogen-free environment, with temperature and humidity constant. All procedures involving animals were approved by the Capital Medical University Animal Care and Use Committee and were carried out in accordance with the approved guidelines. Xenograft assays were performed with 3 animals for each cohort and H1299 or A549 cells (2 × 10⁶ in 0.2 mL PBS) were injected subcutaneously. After seven weeks, mice were sacrificed and the tumor portions were excised and retrieved.
Tumors from mice were formalin-fixed and paraffin-embedded. Paraffin sections were dewaxed in xylene and rehydrated with xylene/alcohol (1:1), 100% alcohol, 95% alcohol, 90% alcohol, 80% alcohol, 70% alcohol and 50% alcohol successively. After stained with hematoxylin and eosin, the sections were hydrated with 95% alcohol, 100% alcohol and xylene successively. Images were taken in a Nikon microscope through a 20 × objective.
For the isolation of solid tumor samples, CytoSelect™ Clonogenic Tumor Cell Isolation Kit (Cell Biolabs) was used. Briefly, xenograft tumors were minced with a razor blade and washed several times in PBS with high doses of penicillin/streptomycin to avoid contamination. Tissue dissociation was carried out by enzymatic digestion (0.8 mg/ml collagenase II, Sigma) at 37 °C for 4 hours to allow complete cell dissociation with pipetting every 1 hour. Cells were filtered through 40 μm sterile filter and adjusted to 5 × 10⁶ cells/mL. Then cells were incubated 14 days in a proprietary semisolid agar media. Once these cells formed colonies, they were retrieved from the agar media and separated from the single cells by using a 70 μm sterile filter. The viable cells in these colonies were then dissociated into individual cells and seeded in 6-well plates for single-cell electrical phenotyping.
Microfluidic Device Fabrication, Operation and Data Analysis
The two-layer PDMS device (constriction channel cross-section area of 10 μm × 10 μm) was replicated from a double-layer SU-8 mold, with detailed fabrication procedures described in previous publications6,36. Briefly, the first layer of SU-8 5 was used to form the constriction channel (10 μm) and the second layer of SU-8 25 was used to form the cell loading channel (25 μm). PDMS prepolymer and curing agent were mixed, degassed, poured on channel masters and baked in an oven. PDMS channels were then peeled from the SU-8 masters with reservoir holes punched through and bonded to a glass slide.
The whole detailed operation process and data processing was described in previous publications6,36. Briefly, the cell samples were pipetted to the entrance of the cell loading channel of the microfluidic device where a negative pressure at 1 kPa was applied to aspirate cells continuously through the constriction channel with two-frequency impedance data (1 kHz + 100 kHz) and images recorded (sampling rate: 20 points per sec, experimental duration: 750 sec as one experiment, throughput: ~1 cell per sec). Raw impedance data were translated to impedance data with cells at 1 kHz and 100 kHz, which were used to evaluate the sealing properties of deformed cells with constriction channel walls and equivalent cellular membrane capacitance as well as cytoplasm resistance, respectively. By combining cell elongation length during its traveling process within the constriction channel based on image processing, these impedance data were further translated to Cm and σp.
Results and Discussion
Currently, the golden-standard approach for tumor classification is the immunohistochemistry of tumor samples where morphology data obtained from hematoxylin and eosin staining were used for tumor status evaluation. However, this is a qualitative approach which requests extensive personnel training to make sound decisions. In this study, we explored the feasibility of using electrical parameters including Cm and σp to classify tumor samples, which may provide a quantitative approach for cellular status evaluation.
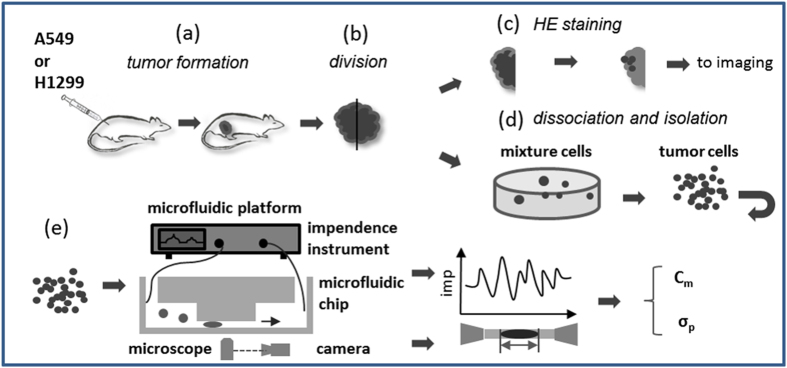
As shown in Fig. 1, in this study, initially, two human lung tumor cell lines (A549 and H1299) were injected subcutaneously into nude mice, respectively, to form solid tumors (see Fig. 1(a)). Then tumor samples were excised and divided into two portions (see Fig. 1(b)). For the immunohistochemistry assay, tumor samples were formalin-fixed and stained by hematoxylin and eosin (see Fig. 1(c)). In the meanwhile, xenograft tumor samples were dissociated by enzymatic digestion and seeded in agar media to remove fibroblast like cells (see Fig. 1(d)). Purified tumor clones were then retrieved from agar media to form suspended single cells, which were then flushed into the constriction channel based microfluidic platform with Cm and σp quantified (see Fig. 1(e)).
Figure 1. Schematic of this study.
(a) mouse tumor formation (subcutaneous injection of lung tumor cells into nude mice). (b) tumor sample retrieval and division into two portions. (c) hematoxylin and eosin staining. (d) sample dissociation and seeding in agar media for purification (removal of fibroblast-like cells). (e) electrical property characterization of single tumor cells with Cm and σp quantified.
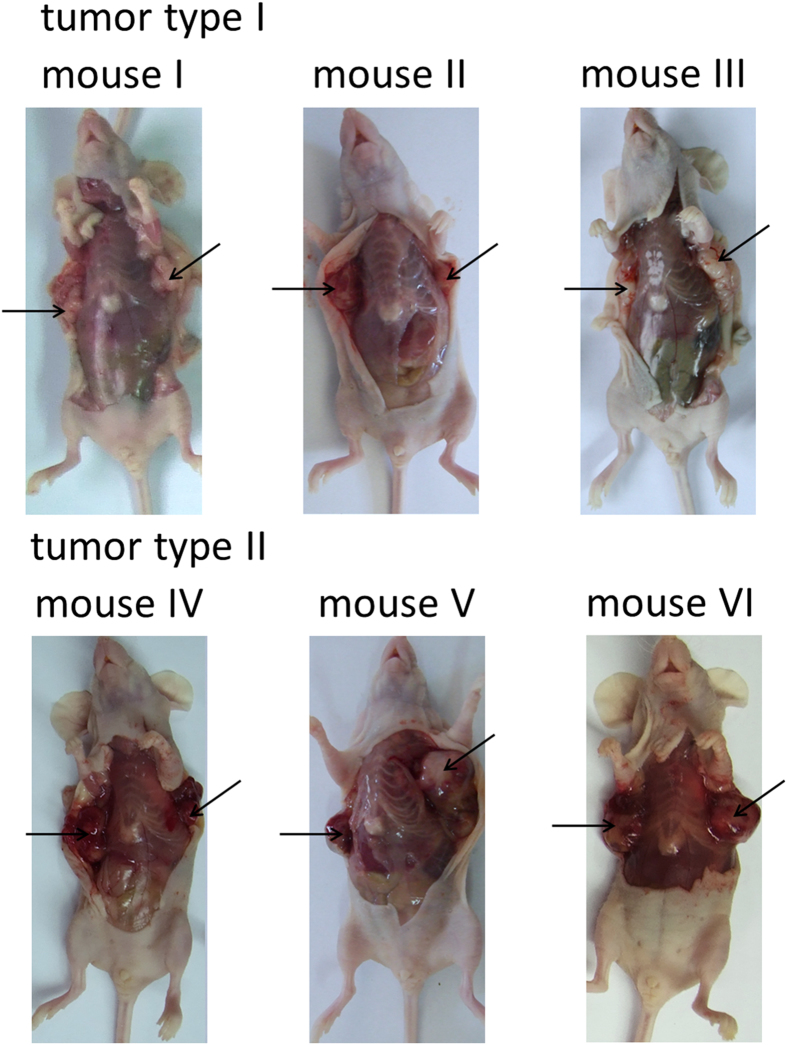
After the injection of lung tumor cell lines into nude mice subcutaneously, tumor formation was noticed within two weeks and mice appeared weight loss seven weeks later. Then six mice in total (three mice injected with A549 cells and three mice injected with H1299 cells) were sacrificed with tumor samples retrieved. As shown in Fig. 2, three mice injected with A549 cells and three mice injected with H1299 cells were sacrificed with tumor portions marked with arrows.
Figure 2. Images of sacrificed mice with the tumor portions marked by arrows.
A549 (tumor type I) and H1299 (Tumor Type II) cells were injected in the flank of 6-week-old female BALB/c-nude mice subcutaneously. Tumors were noticed after 2–3 weeks of tumor cell injection and mice were sacrificed in 7 weeks with the tumor portions retrieved.
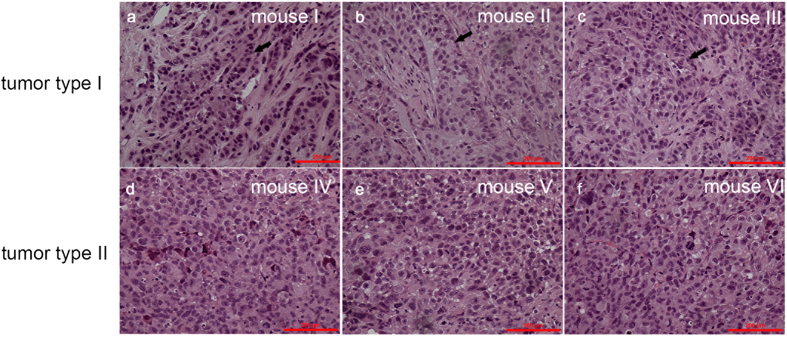
For each retrieved tumor sample, it was divided into two portions. One portion of the tumor sample was formalin-fixed and paraffin-embedded. After stained with hematoxylin and eosin, the images were taken for tumor type classification. Figure 3(a–f) represent tumor samples from three mice injected with A549 cells or H1299 cells, respectively. Significant differences in the hematoxylin and eosin staining were located, due to the pathological difference of A549 and H1299 cells. A549 is an adenocarcinoma cell line and therefore adenocarcinoma characteristics (i.e., glandular cavities) were observed in corresponding xenograft tumor samples (see Fig. 3(a–c)) while H1299 is a large cell neuroendocrine cell line and therefore large cell carcinoma characteristics (i.e., polygonal-shaped cells) were located in corresponding xenograft tumor samples (see Fig. 3(d–f)). The consistency between the injected tumor cell types and morphologies of xenograft tumor samples confirmed the successful formation of tumor samples. Note that although a significant difference in cellular morphologies between these two types of tumors can be obtained, this approach is qualitative and cannot provide quantitative data.
Figure 3. Immunohistochemistry results of xenograft tumor samples.
(a–c) Tumor samples from three mice injected with A549 cells are featured with adenocarcinoma characteristics (glandular cavities) since A549 is an adenocarcinoma cell line. (d–f) Tumor samples from three mice injected with H1299 cells are featured with large cell carcinoma characteristics (polygonal-shaped cells) since H1299 is a large cell neuroendocrine cell line.
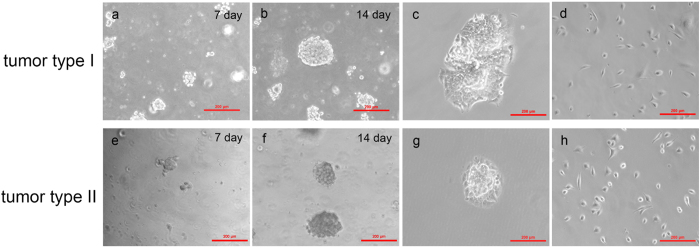
The second portion for each retrieved tumor sample was dissociated into individual cells and cultured in semisolid agar media to form tumor colonies. This approach is a well-established method, capable of forming pure tumor colonies by removing impuries such as tumor-associated fibroblasts which cannot effectively proliferate in the environment of semisolid agar media (CytoSelect™ Clonogenic Tumor Cell Isolation Kit, Cell Biolabs). As shown in Fig. 4, it is a time-sequence proliferation of tumor cells to form the tumor colonies (A549 based tumor colony formation for Fig. 4(a,b) and H1299 based tumor colony formation for Fig. 4(e,f)). Figure 4(c,g) show the retrivied tumor clusters from A549 and H1299 based tumor samples, respectively. These tumor colonies were further dissociated into individual cells and seeded in 6-well plates for single-cell electrical phenotyping (see Fig. 4(d,h)).
Figure 4. Time-sequence tumor colony formation, tumor cluster retrieve and seeded in culture plates.
Tumor colony formation for A549 based tumor samples (a,b) and H1299 based tumor samples (e,f). (c,g) show the retrieved tumor clusters collected from A549 and H1299 based tumor samples, respectively. These tumor colonies were further dissociated into individual cells and seeded in 6-well plates for single-cell electrical phenotyping (d,h).
Single-cell electrical phenotyping was realized by a home-developed microfluidic platform where single-cell suspensions were pipetted to the entrance of the microfluidic device and a negative pressure was applied to aspirate cells continuously through the constriction channel (a channel with a cross-sectional area smaller than a cell) with two-frequency impedance data (1 kHz + 100 kHz) and images recorded. Note that 1 kHz impedance data was used to evaluate the cell-channel leakage and 100 kHz impedance data was used to quantify membrane capacitance and cytoplasm resistance.
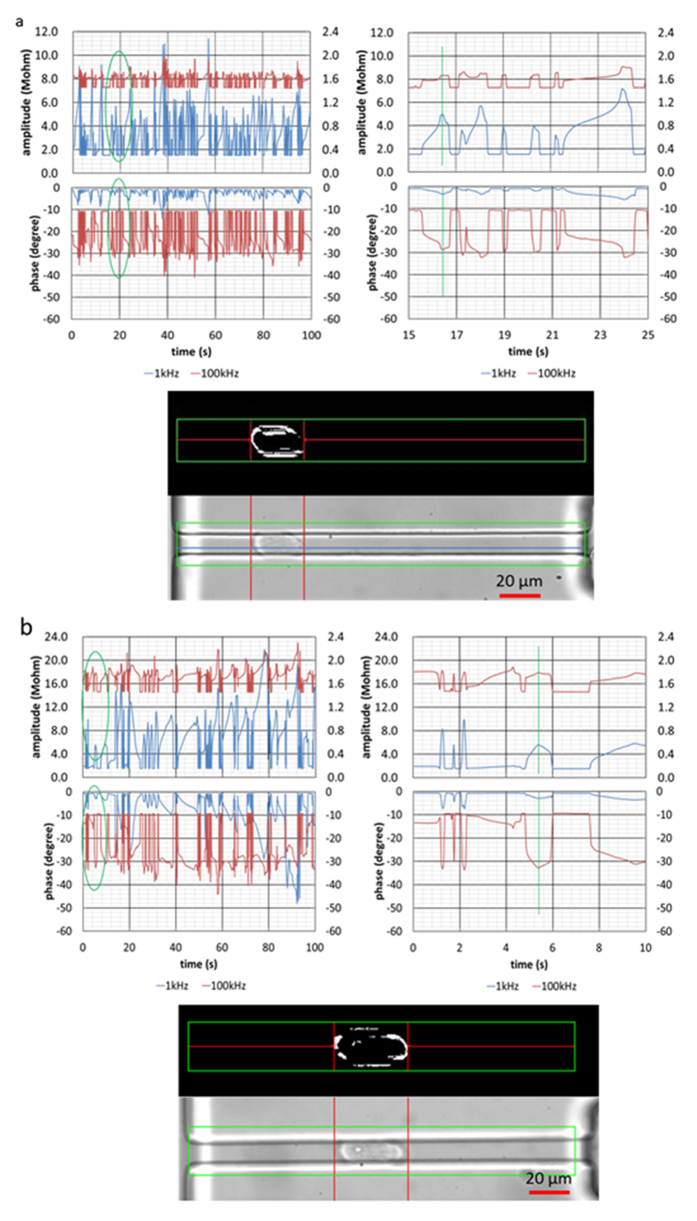
Figure 5(a,b) show the impedance amplitude and phase measurement at 1 kHz and 100 kHz, simultaneously as well as images of cellular squeezing through the constriction channels for A549 and H1299 based tumor cells, respectively. During the cell squeezing process, there was an amplitude increase and a phase decrease for impedance data at both 1 kHz and 100 kHz. Basal impedance amplitudes (no cell entry) at 1 kHz were lower than the values at 100 kHz and there were higher impedance amplitude increases during the cellular squeezing process at 1 kHz than those of 100 kHz. As to the phase data, basal phase values (no cell entry) at 1 kHz were almost zero degree, which were higher than the values at 100 kHz. There were higher phase changes during the cellular squeezing process at 100 kHz than 1 kHz.
Figure 5. Impedance amplitude and phase measurement at 1 kHz and 100 kHz, simultaneously as well as cellular images squeezing through the constriction channels for A549.
(a) and H1299 (b) based tumor cells, respectively. During the cell squeezing process, there is an amplitude increase and phase decrease for data at both 1 kHz and 100 kHz. Basal impedance amplitudes (no cell entry) at 1 kHz were lower than the values at 100 kHz and there were higher impedance amplitude increases during the cellular squeezing process at 1 kHz than those of 100 kHz. As to the phase data, basal phase values (no cell entry) at 1 kHz were almost zero degree, which were higher than the values at 100 kHz. There were higher phase changes during the cellular squeezing process at 100 kHz than 1 kHz.
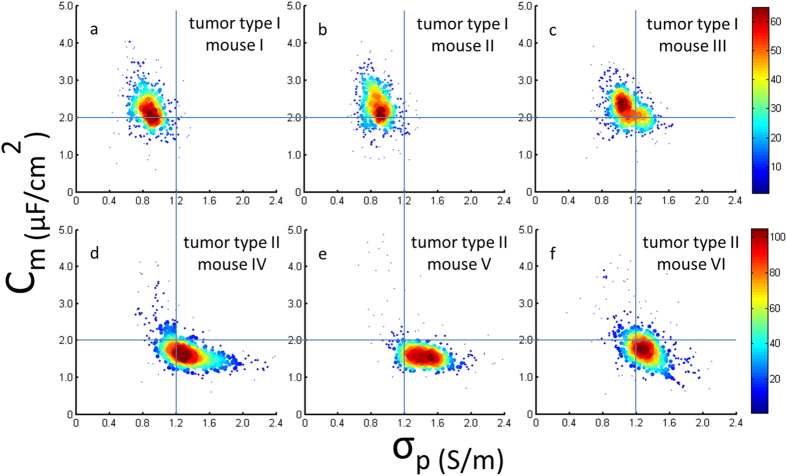
Based on previously developed electrical models34,35, raw impedance data were translated to Cm and σp, two size-independent intrinsic electrical parameters of single cells (see Fig. 6). For A549 based tumor samples, Cm and σp were quantified as 2.25 ± 0.54 μF/cm2 and 0.88 ± 0.17 S/m (ncell = 415, Mouse I), 2.30 ± 0.52 μF/cm2 and 0.89 ± 0.15 S/m (ncell = 440, Mouse II) as well as 2.22 ± 0.44 μF/cm2 and 1.11 ± 0.19 S/m (ncell = 481, Mouse III). Compared to previous data where Cm and σp of pure A549 cell lines were characterized as 2.00 ± 0.60 μF/cm2 and 0.73 ± 0.17 S/m (ncell = 487)6, for retrieved cells from A549 based tumors, both increases in specific membrane capacitance and cytoplasm conductivity were observed. For H1299 based tumor samples, Cm and σp were quantified as 1.76 ± 0.51 μF/cm2 and 1.34 ± 0.30 S/m (ncell = 526, Mouse IV), 1.69 ± 0.53 μF/cm2 and 1.42 ± 0.27 S/m (ncell = 410, Mouse V) as well as 1.81 ± 0.57 μF/cm2 and 1.30 ± 0.24 S/m (ncell = 506, Mouse VI). When the data were compared to previous data of pure H1299 cell lines (1.63 ± 0.52 μF/cm2 and 0.90 ± 0.19 S/m ncell = 489)6, only significant increase in cytoplasm conductivity was observed for retrieved H1299 based tumor cells.
Figure 6. Cm and σp for A549 (a–c) and H1299 (d–f) based tumor samples, respectively.
When a cross line (Cm = 2.0 μF/cm2 and σp = 1.2 S/m) was drawn to split the scatter plots, electrical properties of A549 and H1299 based tumor samples fall within the upper left domain and the lower right domain, respectively. These results confirm the classification of mouse tumor samples based on Cm and σp.
Compared to A549 based tumor samples (Cm of 2.25 ± 0.50 μF/cm2 and σp of 0.96 ± 0.20 S/m (ncell = 1336, Mouse I, II, III)), H1299 based tumor samples demonstrated lower Cm and higher σp (Cm of 1.76 ± 0.54 μF/cm2 and σp of 1.35 ± 0.28 S/m (ncell = 1442, Mouse IV, V, VI)). When a cross line (Cm = 2.0 μF/cm2 and σp = 1.2 S/m) was drawn to split the scatter plots, electrical properties of A549 and H1299 based tumor samples fall within the upper left domain and the lower right domain, respectively. These results confirm the classification of mouse tumor samples based on Cm and σp.
Conclusions
In this paper, electrical property differences were located for two types of tumor samples from three mice injected with A549 cells or H1299 cells, respectively, confirming the feasibility of tumor cell classification based on cellular electrical properties. Future work will focus on electrical property characterization of human tumor samples, with the purpose of investigating the feasibility of human tumor sample classification using Cm and σp.
Additional Information
How to cite this article: Zhao, Y. et al. Single-Cel Electrical Phenotyping Enabling the Classification of Mouse Tumor Samples. Sci. Rep. 6, 19487; doi: 10.1038/srep19487 (2016).
Acknowledgments
The authors would like to acknowledge financial support from National Basic Research Program of China (973 Program, Grant No. 2014CB744600), National Natural Science Foundation of China (Grant No. 61201077, 81261120561 and 61431019), Instrument Development Program of Chinese Academy of Sciences and Beijing NOVA Program of Science and Technology.
Footnotes
The authors declare no competing financial interests.
Author Contributions Y.Z. and D.C. designed and performed the experiments; M.J., X.Z. and W.Y. constructed the mouse models and cultured the cells; Y.Z., C.X. and R.H. analysed the data. J.W. and J.C. conceived the experiments and drafted the paper.
References
- Morgan H., Sun T., Holmes D., Gawad S. & Green N. G. Single cell dielectric spectroscopy. J. Phys. D: Appl. Phys . 40, 61–70 (2007). [Google Scholar]
- Valero A., Braschler T. & Renaud P. A unified approach to dielectric single cell analysis: impedance and dielectrophoretic force spectroscopy. Lab Chip 10, 2216–2225 (2010). [DOI] [PubMed] [Google Scholar]
- Labeed F. H., Coley H. M., Thomas H. & Hughes M. P. Assessment of multidrug resistance reversal using dielectrophoresis and flow cytometry. Biophys. J. 85, 2028–2034 (2003). [DOI] [PMC free article] [PubMed] [Google Scholar]
- Liang X., Graham K. A., Johannessen A. C., Costea D. E. & Labeed F. H. Human oral cancer cells with increasing tumorigenic abilities exhibit higher effective membrane capacitance. Integr. Biol . 6, 545–554 (2014). [DOI] [PubMed] [Google Scholar]
- Coley H. M., Labeed F. H., Thomas H. & Hughes M. P. Biophysical characterization of MDR breast cancer cell lines reveals the cytoplasm is critical in determining drug sensitivity. Biochim. Biophys. Acta 1770, 601–608 (2007). [DOI] [PubMed] [Google Scholar]
- Zhao Y. et al. Tumor cell characterization and classification based on cellular specific membrane capacitance and cytoplasm conductivity. Biosens. Bioelectron . 57, 245–253 (2014). [DOI] [PubMed] [Google Scholar]
- Song H. et al. A microfluidic impedance flow cytometer for identification of differentiation state of stem cells. Lab Chip 13, 2300–2310 (2013). [DOI] [PubMed] [Google Scholar]
- Flanagan L. A. et al. Unique dielectric properties distinguish stem cells and their differentiated progeny. Stem Cells 26, 656–665 (2008). [DOI] [PubMed] [Google Scholar]
- Labeed F. H. et al. Biophysical characteristics reveal neural stem cell differentiation potential. PLoS One 6, e25458 (2011). [DOI] [PMC free article] [PubMed] [Google Scholar]
- Adams T. N. G., Turner P. A., Janorkar A. V., Zhao F. & Minerick A. R. Characterizing the dielectric properties of human mesenchymal stem cells and the effects of charged elastin-like polypeptide copolymer treatment. Biomicrofluidics 8, 054109 (2014). [DOI] [PMC free article] [PubMed] [Google Scholar]
- Watkins N. N. et al. Microfluidic CD4+ and CD8+ T lymphocyte counters for point-of-care HIV diagnostics using whole blood. Sci Transl Med 5, 214ra170 (2013). [DOI] [PubMed] [Google Scholar]
- Han X., van Berkel C., Gwyer J., Capretto L. & Morgan H. Microfluidic lysis of human blood for leukocyte analysis using single cell impedance cytometry. Anal Chem 84, 1070–1075 (2012). [DOI] [PubMed] [Google Scholar]
- Du E. et al. Electric impedance microflow cytometry for characterization of cell disease states. Lab Chip 13, 3903–3909 (2013). [DOI] [PMC free article] [PubMed] [Google Scholar]
- Holmes D. et al. Leukocyte analysis and differentiation using high speed microfluidic single cell impedance cytometry. Lab Chip 9, 2881–2889 (2009). [DOI] [PubMed] [Google Scholar]
- Holmes D. & Morgan H. Single cell impedance cytometry for identification and counting of CD4 T-cells in human blood using impedance labels. Anal Chem 82, 1455–1461 (2010). [DOI] [PubMed] [Google Scholar]
- Vykoukal D. M., Gascoyne P. R. & Vykoukal J. Dielectric characterization of complete mononuclear and polymorphonuclear blood cell subpopulations for label-free discrimination. Integr. Biol . 1, 477–484 (2009). [DOI] [PubMed] [Google Scholar]
- Gimsa J. A comprehensive approach to electro-orientation, electrodeformation, dielectrophoresis, and electrorotation of ellipsoidal particles and biological cells. Bioelectrochemistry 54, 23–31 (2001). [DOI] [PubMed] [Google Scholar]
- Jones T. B. Basic theory of dielectrophoresis and electrorotation. IEEE Eng Med Biol Mag 22, 33–42 (2003). [DOI] [PubMed] [Google Scholar]
- Broche L. M., Labeed F. H. & Hughes M. P. Extraction of dielectric properties of multiple populations from dielectrophoretic collection spectrum data. Phys Med Biol 50, 2267–2274 (2005). [DOI] [PubMed] [Google Scholar]
- Broche L. M. et al. Early detection of oral cancer-Is dielectrophoresis the answer? Oral Oncol 43, 199–203 (2007). [DOI] [PubMed] [Google Scholar]
- Mulhall H. J. et al. Cancer, pre-cancer and normal oral cells distinguished by dielectrophoresis. Anal Bioanal Chem 401, 2455–2463 (2011). [DOI] [PubMed] [Google Scholar]
- Fuhr G., Hagedorn R. & Goring H. Separation of different cell-types by rotating electric-fields. Plant Cell Physiol 26, 1527–1531 (1985). [Google Scholar]
- Arnold W. M. & Zimmermann U. Electro-rotation-development of a technique for dielectric measurements on individual cells and particles. J Electrostat 21, 151–191 (1988). [Google Scholar]
- Bahrieh G., Erdem M., Ozgur E., Gunduz U. & Kulah H. Assessment of effects of multi drug resistance on dielectric properties of K562 leukemic cells using electrorotation. RSC Adv 4, 44879–44887 (2014). [Google Scholar]
- Whitesides G. M. The origins and the future of microfluidics. Nature 442, 368–373 (2006). [DOI] [PubMed] [Google Scholar]
- Wootton R. C. & Demello A. J. Microfluidics: Exploiting elephants in the room. Nature 464, 839–840 (2010). [DOI] [PubMed] [Google Scholar]
- Cheung K. C. et al. Microfluidic impedance-based flow cytometry. Cytometry A 77, 648–666 (2010). [DOI] [PubMed] [Google Scholar]
- Sun T. & Morgan H. Single-cell microfluidic impedance cytometry: a review. Microfluid Nanofluidics 8, 423–443 (2010). [Google Scholar]
- Zheng Y., Nguyen J., Wei Y. & Sun Y. Recent advances in microfluidic techniques for single-cell biophysical characterization. Lab Chip 13, 2464–2483 (2013). [DOI] [PubMed] [Google Scholar]
- Chen J. et al. Microfluidic impedance flow cytometry enabling high-throughput single-cell electrical property characterization. Int. J. Mol. Sci. 16, 9804–9830 (2015). [DOI] [PMC free article] [PubMed] [Google Scholar]
- Han K. H., Han A. & Frazier A. B. Microsystems for isolation and electrophysiological analysis of breast cancer cells from blood. Biosens. Bioelectron . 21, 1907–1914 (2006). [DOI] [PubMed] [Google Scholar]
- Cho Y. et al. Whole-cell impedance analysis for highly and poorly metastatic cancer cells. J. Microelectromech. Syst . 18, 808–817, (2009). [Google Scholar]
- Chen J. et al. Classification of cell types using a microfluidic device for mechanical and electrical measurement on single cells. Lab Chip 11, 3174–3181 (2011). [DOI] [PubMed] [Google Scholar]
- Zhao Y. et al. A microfluidic system enabling continuous characterization of specific membrane capacitance and cytoplasm conductivity of single cells in suspension. Biosens. Bioelectron . 43C, 304–307 (2013). [DOI] [PubMed] [Google Scholar]
- Zhao Y. et al. A microfluidic system for cell type classification based on cellular size-independent electrical properties. Lab Chip 13, 2272–2277, (2013). [DOI] [PubMed] [Google Scholar]
- Huang S.-B. et al. Classification of cells with membrane staining and/or fixation based on cellular specific membrane capacitance and cytoplasm conductivity. Micromachines 6, 163–171 (2015). [Google Scholar]


