

Abstract
Visceral adiposity index (VAI) well mirrors visceral fat dysfunction. No study explored the association between low androgen and VAI. We aimed to determine whether VAI was associated with hypogonadism and sex hormones, and also whether it better predicted hypogonadism than other obesity indices. Our data were collected from 16 sites in East China. 2,759 men were enrolled. Hypogonadism was defined as total testosterone < 11.3 nmol/L. VAI was calculated in male: (waist circumference/(39.68 + (1.88 × BMI))) × (triglycerides/1.03) × (1.31/HDL). 484 (17.5%) hypogonadal men had significantly higher VAI. After adjusting for age, smoking, neck and hip circumference, diabetes and hypertension, VAI was inversely associated with total testosterone, estradiol and SHBG (P < 0.01). Higher quartiles of VAI were associated with significantly increasing odds of hypogonadism (P for trend < 0.01). The fully adjusted odds ratio was 5.88 (95 CI% 4.09, 8.46) for the highest quartile compared with the lowest quartile of VAI. Among all the indices investigated, VAI showed the largest area under the curve (P < 0.001). In conclusion, the VAI was significantly associated with a higher prevalence of hypogonadism in Chinese men. VAI also best predicted hypogonadism among obesity indices (waist, hip and neck circumference, BMI, waist-hip ratio and body adiposity index).
Hypogonadism in male has been well documented to be a risk factor for diabetes1 and cardiovascular disease2. It is also common, especially in the middle aged and elderly. In USA, the prevalence of hypogonadism was 38.7% in men aged ≥45 years3 and in Chinese men, about a quarter had androgen deficiency4. The number is much higher among patients referring for the treatment of obesity, although the prevalence of symptomatic hypogonadism in the general population is very low, about only 2–3%5.
Hypogonadism has a bidirectional relationship with obesity5 and it has a strongest association with visceral obesity among the metabolic syndrome components6. The most common index to define visceral obesity is waist circumference (WC). However, another index called visceral adiposity index (VAI) shows promising capability to be a marker of visceral fat dysfunction, which has been reported in more than 70 publications since it was first introduced in 20107,8. The VAI has been investigated in cardiovascular and cerebrovascular diseases8, nonalcoholic fatty liver disease9, polycystic ovary syndrome10, and acromegaly11. A recent study suggests, among the most common indices of adiposity including body mass index (BMI), WC, hip circumference and waist-hip ratio (WHR) and several adipocytokines, the VAI would be a simple tool for clearly reflecting adipose tissue dysfunction and associated cardiometabolic risk12. Amato et al. suggested VAI be applied in patients with hypogonadism7, but until now there is no study exploring the association between hypogonadism and VAI.
We performed a large investigation in 2014, referred to as Survey on Prevalence in East China for Metabolic Diseases and Risk Factors (SPECT-China). Using the data from the study, we aimed to determine whether the VAI was associated with hypogonadism and sex hormones, and also whether VAI better predicted hypogonadism than other obesity indices. To the best of our knowledge, the current analyses are the first to explore the application of VAI in male hypogonadism.
Results
Characteristics of the study population
General characteristics of the study population are summarized in Table 1. Four hundred and eighty-four (17.5%) men were diagnosed with hypogonadism by total testosterone (T). Compared to men without hypogonadism, the men with hypogonadism had comparable age but had significantly higher VAI, waist, neck and hip circumference, BMI, other obesity indices and triglycerides (TG) as well as higher prevalence of diabetes, hypertension and metabolic syndrome. These men also had significantly lower estradiol (E2), sex hormone binding globulin (SHBG) and luteinizing hormone (LH).
Table 1. General characteristics of the participants.
| Men without hypogonadism | Men with hypogonadism | P | |
|---|---|---|---|
| N | 2275 | 484 | |
| Age, yr | 53 (14) | 52 (12) | 0.78 |
| Metabolic factors | |||
| Body mass index, kg/m2 | 24.2 (3.2) | 26.1 (3.5) | <0.001 |
| Waist circumference, cm | 82 (9) | 87 (9) | <0.001 |
| Neck circumference, cm | 35.6 (3.1) | 36.8 (2.8) | <0.001 |
| Hip circumference, cm | 93 (6) | 96 (7) | <0.001 |
| Waist-hip ratio | 0.88 (0.17) | 0.93 (0.46) | <0.001 |
| Body adiposity index, % | 25.0 (3.3) | 26.3 (3.6) | <0.001 |
| Triglycerides, mmol/L | 1.69 (1.46) | 2.96 (3.26) | <0.001 |
| HDL, mmol/L | 1.39 (0.31) | 1.27 (0.30) | <0.001 |
| LDL, mmol/L | 2.92 (0.70) | 2.98 (0.67) | 0.08 |
| Visceral adiposity index | 1.68 (2.00) | 3.26 (4.43) | <0.001 |
| Hypertension, % | 39.9 | 49.5 | <0.001 |
| Diabetes, % | 10.8 | 23.1 | <0.001 |
| Metabolic syndrome, n (%) | 315 (13.8) | 148 (30.6) | <0.001 |
| Sex hormones | |||
| Total T, nmol/L | 17.6 (5.2) | 9.2 (1.9) | <0.001 |
| E2, pmol/L | 112.2 (65.5) | 83.3 (53.5) | <0.001 |
| SHBG, nmol/L | 49.0 (24.9) | 29.4 (16.4) | <0.001 |
| FSH, IU/L | 8.7 (7.4) | 9.6 (10.8) | 0.66 |
| LH, IU/L | 5.5 (3.7) | 5.1 (4.6) | <0.001 |
| Current smoker, % | 49.2 | 43.3 | <0.05 |
E2, estradiol; FSH, follicle-stimulating hormone; LH, luteinizing hormone; SHBG, sex hormone binding globulin; T, testosterone.
The data are summarized as the mean (standard deviation) for continuous variables, or as number with proportion for categorical variables. The Mann-Whitney U or Student T test was used for continuous variables, and the Pearson χ2 test was used for dichotomous variables.
Table 2 shows the results of variables according to the VAI quartiles. The quartile ranges were ≤0.85, 0.86–1.32, 1.33–2.17 and ≥2.18. According to trend analysis, with the increase of VAI quartiles, total T, E2, SHBG, follicle-stimulating hormone (FSH) and LH decreased (all P for trend <0.001) and as expected, waist, neck and hip circumference, BMI, other obesity indices, TG, low density lipoprotein (LDL) as well as prevalence of hypertension and diabetes increased (all P for trend <0.001). We also observed the prevalence of hypogonadism of each VAI quartile was significantly higher than that of previous quartile (Fig. 1) (all age-adjusted P < 0.05).
Table 2. Characteristics of the participants by quartiles of visceral adiposity index.
| Visceral adiposity index | Q1 | Q2 | Q3 | Q4 | P for trend |
|---|---|---|---|---|---|
| ≤0.85 | 0.86–1.32 | 1.33–2.17 | ≥2.18 | ||
| N | 693 | 687 | 691 | 688 | |
| Age, yr | 54 (15) | 53 (14) | 52 (13) | 51 (12) | <0.001 |
| Metabolic factors | |||||
| Body mass index, kg/m2 | 22.6 (3.0) | 24.0 (3.1) | 25.2 (3.1) | 26.2 (3.0) | <0.001 |
| Waist circumference, cm | 77 (8) | 81 (9) | 85 (8) | 88 (8) | <0.001 |
| Neck circumference, cm | 34.4 (2.4) | 35.4 (2.6) | 36.4 (3.8) | 37.0 (2.6) | <0.001 |
| Hip circumference, cm | 91 (6) | 93 (6) | 95 (6) | 96 (6) | <0.001 |
| Waist-hip ratio | 0.85 (0.07) | 0.90 (0.48) | 0.89 (0.07) | 0.92 (0.06) | <0.001 |
| Body adiposity index, % | 24.1 (3.4) | 24.9 (3.4) | 25.7 (3.4) | 26.1 (3.2) | <0.001 |
| Triglycerides, mmol/L | 0.84 (0.19) | 1.24 (0.26) | 1.75 (0.38) | 3.84 (3.15) | <0.001 |
| HDL, mmol/L | 1.64 (0.31) | 1.41 (0.25) | 1.29 (0.23) | 1.14 (0.23) | <0.001 |
| LDL, mmol/L | 2.69 (0.65) | 2.92 (0.73) | 3.05 (0.67) | 3.05 (0.67) | <0.001 |
| Hypertension, % | 35.9 | 40.7 | 40.4 | 49.4 | <0.001 |
| Diabetes, % | 10.5 | 10.0 | 11.0 | 20.3 | <0.001 |
| Sex hormones | |||||
| Total T, nmol/L | 19.0 (6.4) | 16.8 (5.4) | 15.4 (5.2) | 13.3 (4.3) | <0.001 |
| E2, pmol/L | 119.3 (73.0) | 107.2 (60.2) | 103.7 (60.9) | 98.0 (61.1) | <0.001 |
| SHBG, nmol/L | 59.7 (29.2) | 47.9 (22.1) | 40.8 (21.5) | 33.6 (16.8) | <0.001 |
| FSH, IU/L | 10.4 (11.1) | 8.8 (7.2) | 8.6 (6.3) | 7.5 (6.5) | <0.001 |
| LH, IU/L | 6.3 (5.3) | 5.4 (3.5) | 5.1 (3.1) | 4.7 (3.1) | <0.001 |
| Current smoker, % | 44.2 | 43.2 | 51.6 | 53.8 | <0.001 |
E2, estradiol; FSH, follicle-stimulating hormone; LH, luteinizing hormone; SHBG, sex hormone binding globulin; T, testosterone. The data are summarized as the mean (standard deviation) for continuous variables, or as number with proportion for categorical variables. P for trend was calculated by ANOVA and Chi-square test.
Figure 1. The prevalence of hypogonadism by quartiles of visceral adiposity index.
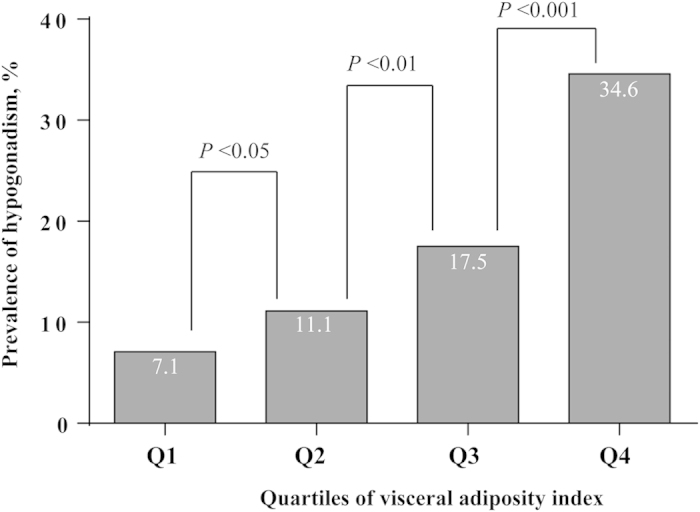
P values were age-adjusted.
Association of VAI with sex hormones
Table 3 summarizes the results of the linear regression models studying the association of VAI with total T, E2, SHBG, LH and FSH. In the model adjusted for age and smoking, the VAI was inversely associated with total T (Beta = −0.255), E2 (Beta = −0.063), log-SHBG (Beta = −0.226) and log-FSH (Beta = −0.038) (all P < 0.05). After additional adjustments for neck and hip circumference, the association of VAI with total T, E2 and log-SHBG weakened but it was still significant (all P < 0.01). After additional adjustments for diabetes and hypertension, for total T (Beta = −0.202), E2 (Beta = −0.052) and log-SHBG (Beta = −0.159), the association with VAI did not change (all P < 0.01).
Table 3. Association of visceral adiposity index with sex-related hormones.
| Dependent variables | Visceral adiposity index (independent variable) |
||
|---|---|---|---|
| Model 1 | Model 2 | Model 3 | |
| Total T | −0.255 (0.042)‡ | −0.212 (0.042)‡ | −0.202 (0.042)‡ |
| E2 | −0.063 (0.483)† | −0.054 (0.492)† | −0.052 (0.495)† |
| log-SHBG | −0.226 (0.001)‡ | −0.170 (0.001)‡ | −0.159 (0.001)‡ |
| log-LH | −0.031 (0.002) | −0.008 (0.002) | −0.009 (0.002) |
| log-FSH | −0.038 (0.002)* | −0.029 (0.002) | −0.032 (0.002) |
Beta coefficients (standard errors) from linear regression models are presented. *P < 0.05, †P < 0.01, ‡P < 0.001.
T, testosterone; E2, estradiol; SHBG, sex hormone binding globulin.
Model 1 controls for age (continuous variable) and smoking. Model 2 additionally controls for neck and hip circumference (both continuous variables). Model 3 additionally controls for diabetes and hypertension. SHBG, LH and FSH were log-transformed because of their skewed distribution.
Association of VAI with hypogonadism
Table 4 demonstrates the results of the logistic regression measuring the association of VAI with hypogonadism. In each model, the odds ratio (OR) for hypogonadism increased across VAI quartiles (all P for trend < 0.001). In the model adjusted for age and smoking (Table 4, model 1), compared with men in the lowest quartile of VAI, the OR of hypogonadism in men in the highest quartile of VAI were 7.76 (95% CI 5.49, 10.96; P < 0.001). After additional adjustments for obesity indices (neck and hip circumference), OR decreased and the association weakened (Table 4, model 2) but it was still significant (P for trend < 0.001). Additional adjustment for diabetes and hypertension also did not change this association (Table 4, model 3). The OR of hypogonadism in Q4 was 5.88 (95% CI 4.09, 8.46; P < 0.001). No interaction was observed between VAI, and smoking, neck circumference, hip circumference, diabetes and hypertension.
Table 4. Association of visceral adiposity index with hypogonadism.
| Visceral adiposity index | Model 1 | Model 2 | Model 3 |
|---|---|---|---|
| Q1 (≤0.85) | 1.00 (ref.) | 1.00 (ref.) | 1.00 (ref.) |
| Q2 (0.86–1.32) | 1.71 (1.16, 2.52) | 1.61 (1.09, 2.39) | 1.62 (1.09, 2.41) |
| Q3 (1.33–2.17) | 3.06 (2.13, 4.41) | 2.64 (1.81, 3.84) | 2.63 (1.81, 3.84) |
| Q4 (≥2.18) | 7.76 (5.49, 10.96) | 6.33 (4.41, 9.08) | 5.88 (4.09, 8.46) |
| P value for trend | <0.001 | <0.001 | <0.001 |
The data are expressed as odds ratio (95% CI) unless otherwise indicated. Logistic regression analysis was used.
Model 1 controls for age (continuous variable) and smoking. Model 2 additionally controls for neck and hip circumference (both continuous variables). Model 3 additionally controls for diabetes and hypertension.
AUCs of different obesity indices to predict hypogonadism
We explored the value of obesity indices in distinguishing between subjects with and without hypogonadism (Table 5). Using ROC analysis, VAI could distinguish subjects with hypogonadism from those without, with a sensitivity of 0.68, a specificity of 0.63. Its AUC was 0.71 (95% CI 0.69, 0.73; P < 0.001). WC, BMI, neck circumference, hip circumference, waist-hip ratio (WHR) and body adiposity index (BAI) was significantly inferior to VAI model in AUC (all P < 0.001).
Table 5. AUC for visceral adiposity index and other adiposity indices for hypogonadism.
| Prediction model | AUC ROC | SE for AUC | P value 1 | P value 2 |
|---|---|---|---|---|
| Visceral adiposity index | 0.71 (0.69, 0.73) | 0.01 | <0.001 | |
| Waist circumference | 0.66 (0.64, 0.67) | 0.01 | <0.001 | <0.001 |
| Neck circumference | 0.63 (0.61, 0.65) | 0.01 | <0.001 | <0.001 |
| Hip circumference | 0.62 (0.60, 0.64) | 0.01 | <0.001 | <0.001 |
| Waist-hip ratio | 0.63 (0.61, 0.64) | 0.01 | <0.001 | <0.001 |
| Body mass index | 0.66 (0.65, 0.68) | 0.01 | <0.001 | <0.01 |
| Body adiposity index | 0.60 (0.59, 0.62) | 0.01 | <0.001 | <0.001 |
AUC, area under the curve; ROC, receiver operating characteristic.
P value 1: The diagnostic value for ROC, two tail significance.
P value 2: Difference of AUC compared to the visceral adiposity index model, two tail significance (Z test).
Sensitivity analyses
After excluding subjects with metabolic syndrome based on the International Diabetes criteria definition (n = 463), the OR for hypogonadism still increased across VAI quartiles in each model (all P for trend < 0.001). In fully adjusted model, the OR of hypogonadism in men in the highest quartile of VAI were 6.63 (95% CI 4.46, 9.86; P < 0.001). Its AUC was 0.70 (95% CI 0.66, 0.73; P < 0.001), still the largest among the obesity indices (all P < 0.01).
Discussion
In this population-based study, we observed that the VAI mirroring visceral adipose tissue dysfunction was significantly associated with lower total T, E2 and SHBG levels after adjusting for age, smoking, neck and hip circumference, diabetes and hypertension. The fully adjusted OR of hypogonadism increased by 588% for the highest quartile compared with the lowest quartile of VAI. VAI also best predicted hypogonadism among different obesity indices. To the best of our knowledge, this study is the first to explore the association between VAI and hypogonadism (Fig. 2).
Figure 2. Relationship between VAI and hypogonadism in male.
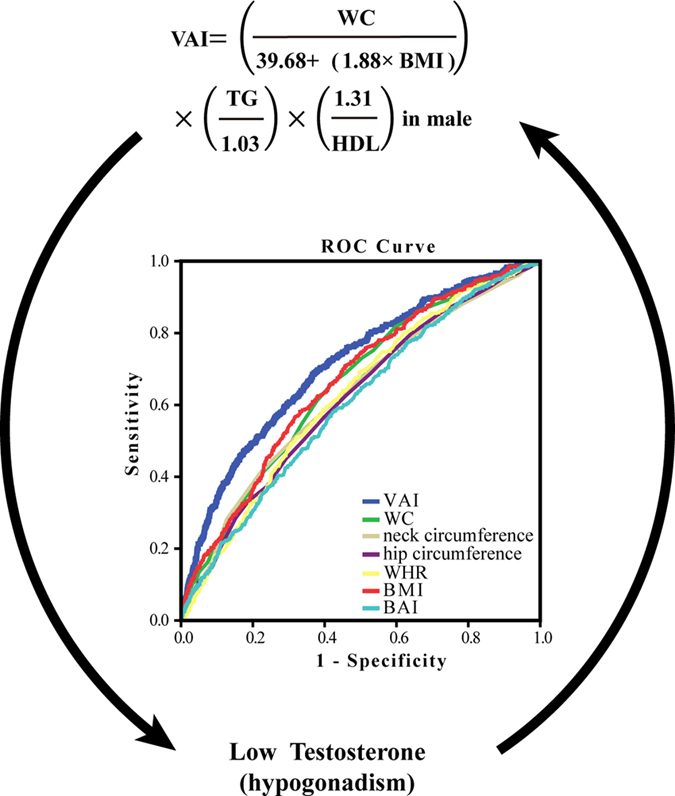
We observed that the VAI was significantly associated with lower total testosterone and hypogonadism. VAI also had the largest area under curves among different obesity indices, indication it best predicted hypogonadism. VAI, visceral adiposity index; WC, waist circumference; WHR, waist-hip ratio; BMI, body mass index; BAI, body adiposity index. This figure was created by Adobe Illustrator CS5 (Adobe Systems Incorporated, USA).
The VAI is a new method for assessment of adipose distribution and function, first presented by Marco Calogero Amato et al. in 20108. It is a gender-specific empirical-mathematical model. VAI is determined by anthropometric (BMI and WC) and corrected for functional parameters (TG and HDL), which shows a strong relationship with visceral fat mass detected by MRI8. In a previous study, VAI was independently associated with both cardiovascular and cerebrovascular events, all metabolic syndrome factors, insulin resistance8 and adiponectin13. However, this was not observed for WC8. This further indicates WC alone could not well distinguish subcutaneous and visceral fat mass14. Given the association between hypogonadism and obesity, in our study we also found the VAI had significantly larger AUC than other common obesity indices including WC, BMI, neck circumference, hip circumference, WHR and BAI. Thus VAI may be used as a surrogate of visceral fat dysfunction and we added new evidence to the application of VAI.
Obesity and male hypogonadism are often associated. This is consistent with our findings that further indicates visceral fat mass or dysfunction may be associated with hypogonadism. How obesity induces hypogonadism is not completely clear. Hypothalamic dysfunction with a decreased gonadotropin-releasing hormone release seems to drive part or most of the mechanisms explaining hypogonadism in obese subjects5,15. From our data, we could also speculate that the hypothalamic-pituitary level is the probable origin of the hypogonadal condition, because in the hypogonadal group, E2, FSH and LH were lower, which was more evident when quartiles of VAI were considered. In clinical intervention studies, a meta-analysis reported bariatric surgery-induced weight loss which was dramatically more effective than life-style changes, induced a significant increase in T levels, SHBG, FSH and LH16. Hypogonadism may also induce visceral obesity. In surgically castrated animal model, weight significantly increased, especially along with a 7-fold increase in visceral fat accumulation in 2 months17, which is consistent with the phenomenon in men with androgen deprivation therapy by surgical or medical castration18. Moreover, testosterone replacement alters the cell size in visceral fat but not in subcutaneous fat in hypogonadal aged male rats19. It also prevents gain in visceral adipose tissue in aging men20. Therefore, visceral fat dysfunction, which could be reflected by VAI rather than by WC or BMI, may form a vicious circle with hypogonadism. A combined approach of lifestyle intervention (weight loss) and testosterone supplementation might be adopted as a further option to break this vicious circle in symptomatic, hypogonadal, obese men5.
Another interesting finding is not only T but also SHBG was inversely associated with VAI. Currently plasma SHBG could be recognized as a biomarker of the degree of inflammation in metabolic disorders21. Cytokines such as tumor necrosis factor alpha, interleukin 1 beta and adiponectin, all of which could be released by adipose tissue, regulate SHBG expression21. This further indicates the effect of visceral fat dysfunction on the sex hormones.
Our study had several strengths. First, regarding the novelty, this study is the first to detect an association between VAI and hypogonadism in general Chinese men, a largest population group in the world, thereby adding new evidence in this field. Second, because the anthropometric measurements and questionnaires were all completed by the same trained group and all the biomedical measurements were performed in one laboratory certified by the College of American Pathologists, this study has strong quality control. Third, because the SPECT-China study was performed in a general population, our results are more reflective as opposed to a clinic-based population. However, our study has several limitations. First, due to the cross-sectional nature of the study, we cannot draw a causal relationship between VAI and hypogonadism, however we have mentioned their association might be bidirectional. Second, this study recruited primarily Han Chinese men but VAI was set up based on the Caucasian population. However, the application of VAI in the Chinese population has been reported in about 10 studies and VAI is well associated with cardiovascular diseases22, fatty liver23, diabetes24 and insulin resistance25 in Chinese. Finally, we did not measure albumin, so the calculated free testosterone could not be obtained, which is a reliable index of free testosterone26. However, the most widely accepted parameters to establish the presence of hypogonadism is serum total testosterone27, which has been used by numerous studies28,29.
In conclusion, the VAI was significantly associated with a higher prevalence of hypogonadism in Chinese men. VAI also best predicted hypogonadism among common obesity indices. This study may have particular interest for some Asian populations including Chinese. They are more prone to have generally low BMI but visceral fat accumulation30,31, so hypogonadism may be further neglected and the application of VAI may improve this. Future studies should further explore the underlying mechanisms.
Methods
Study population
SPECT-China is a population-based cross-sectional survey on the prevalence of metabolic diseases and risk factors in East China (ChiCTR-ECS-14005052, www.chictr.org) from February to June 2014. A stratified cluster sampling method was used. This study was performed in Shanghai, Jiangxi Province and Zhejiang Province (three sites in urban areas of Shanghai, one site in an urban area of Jiangxi Province, three sites in rural areas in Shanghai, three sites in rural areas in Zhejiang and six sites in rural areas in Jiangxi Province), with detailed information in previous published articles32. We included Chinese citizens aged 18 years and older and excluded those who had severe communication problems or acute illnesses or were unwilling to participate. The study protocol was approved by the Ethics Committee of Shanghai Ninth People’s Hospital, Shanghai JiaoTong University School of Medicine. All procedures followed were in accordance with the ethical standards of the responsible committee on human experimentation (institutional and national) and with the Helsinki Declaration of 1975, as revised in 2008. All participants provided written informed consent before data collection.
A total of 6,899 subjects were enrolled in the SPECT-China study32. Among them, there were 2940 men who did not receive testosterone supplementation. Men with missing values of BMI or WC (n = 173), lipid profile (n = 2) and total testosterone (n = 6) were excluded from the study. Finally, this study included a total number of 2759 men with a mean (SD) age of 53 (13) years.
Measurements
In every site, the same trained staff group completed the questionnaire including information on demographic characteristics, medical history and lifestyle risk factors, and collected anthropometric data. Current smoking was defined as having smoked at least 100 cigarettes in one’s lifetime and currently smoking cigarettes33. Body weight, height, and blood pressure were measured using standard methods, as previously described33. BMI was calculated as weight in kilograms divided by height in meters squared. WC was measured midway between the inferior margin of the last rib and the crest of the ilium in a horizontal plane12. Hip circumference was measured around the pelvis at the point of maximal protrusion of the buttocks12. WHR was calculated by dividing the WC by the hip circumference. Neck circumference was measured. Participants stood erect with their head positioned in the Frankfort horizontal plane. The superior border of a tape measure was placed just below the laryngeal prominence and applied perpendicular to the long axis of the neck34. BAI was calculated as hip circumference (in cm) divided by height (in m)1.5 −1835.
The participants fasted for 8 h before the study. Fasting blood samples were drawn between 0700 h and 1000 h. The blood samples for the plasma glucose test were collected in vacuum tubes with anticoagulant sodium fluoride and centrifuged on the spot within 1 h after collection. The blood samples were stored at −20 °C and were shipped in dry ice within 2 to 4 hours of collection to a central laboratory. Hemoglobin A1c was assessed using high-performance liquid chromatography (Medconn, MQ-2000PT, Shanghai, China). Plasma glucose and lipid profile including TG, high density lipoprotein (HDL) and LDL were measured by BECKMAN COULTER AU 680 (Germany). The total T, E2, FSH and LH were measured using the immulite 2000 platform chemiluminescence immunoassays (Siemens, Germany) and sex hormone binding globulin (SHBG) by electrochemiluminescence (Roche Cobas E601, Switzerland). The minimal detectable limit for hormones was as follows: 0.7 nmol/L (total T), 73.4 pmol/L (E2), and 0.1 IU/L (FSH and LH). The inter-assay coefficients of variation were as follows: 6.6% (total T), 7.5% (E2), 7% (SHBG), 4.5% (FSH) and 6.0% (LH). The intra-assay coefficients of variation were as follows: 5.7% (total T), 7% (SHBG), 6.2% (E2), 3.8% (FSH) and 4.9% (LH).
Definition of variables and outcomes
Hypogonadism was defined as total T < 11.3 nmol/L in men29. The VAI was calculated according to the following equation7 where WC was expressed in centimeter, and TG and HDL levels in mmol/L: (WC/(39.68 + (1.88 × BMI))) × (TG/1.03) × (1.31/HDL). Based on the American Diabetes Association 2014 criteria, diabetes was defined as a previous diagnosis by healthcare professionals, fasting plasma glucose ≥7.0 mmol/L, or HbA1c ≥6.5%. Hypertension was defined as a systolic blood pressure of 140 mm Hg or higher or a diastolic blood pressure of 90 mm Hg or higher or current use of antihypertensive treatment. Metabolic syndrome was defined based on the International Diabetes Federation criteria36.
Statistical analysis
We performed survey analyses using IBM SPSS Statistics, Version 22 (IBM Corporation, Armonk, NY, USA). All of the analyses were two-sided. P < 0.05 was considered to be statistically significant. The general characteristics are summarized as the mean (SD) values for continuous variables or as a number with proportion for categorical variables. To test for differences in characteristics between the participants with and without hypogonadism, Mann-Whitney U or Student T test was used for continuous variables, and the Pearson χ2 test was used for dichotomous variables. The values of total T (n = 1) and E2 (n = 754) under the minimal detectable limit were given a value midway between zero and the minimal detectable limit for the analyses: 0.35 nmol/L for total T and 36.7 pmol/L for E2.
The association of VAI (independent variable) with total T, E2, SHBG, FSH and LH (dependent variables) was assessed using linear regression. Model 1 controls for age (continuous variable) and smoking. Model 2 additionally controls for neck and hip circumference (both continuous variables). Because BMI and waist circumference were not adjusted because they are included in the equation of VAI. Model 3 additionally controls for diabetes and hypertension. SHBG, LH and FSH were log-transformed because of their skewed distribution. The results were expressed as standardized coefficients (beta) and standard errors.
The VAI was divided into quartiles. The first quartile represented the lowest one and the fourth quartile represented the highest. Odds ratio (OR) and 95% CI were calculated using logistic regression to determine the risk of hypogonadism for each quartile of VAI, with the lowest quartile as the reference. Models were the same as those in linear regression. We also tested the interaction effect between VAI and smoking, neck and hip circumference, diabetes and hypertension by adding a multiplicative factor in the logistic regression model.
To measure the accuracy of obesity indices in distinguishing between subjects with and without hypogonadism, we calculated the area under the curve (AUC) of the receiver operating characteristic (ROC) using standard methods37. Z test was performed to examine differences between AUCs.
Marco Calogero Amato et al. suggests VAI better be used in subjects without overt metabolic syndrome7. In sensitivity analyses, we excluded subjects with metabolic syndrome (n = 463) and then reperformed the logistic regression and calculate AUCs.
Additional Information
How to cite this article: Wang, N. et al. Visceral fat dysfunction is positively associated with hypogonadism in Chinese men. Sci. Rep. 6, 19844; doi: 10.1038/srep19844 (2016).
Acknowledgments
This study was supported by National Natural Science Foundation of China (81270885, 81070677); Clinical Potential Subject Construction of Shanghai Jiaotong University School of Medicine (2014); Ministry of Science and Technology in China (2012CB524906); Science and Technology Commission of Shanghai Municipality (14495810700, 12XD1403100). The authors thank Chunfang Zhu, Xiaoqi Pu, Zhen Cang, Chaoxia Zhu, Meng Lu, Ying Meng, Hui Guo, and Chi Chen for collecting data. The authors also thank Xiaojin Wang and Bingshun Wang from the Department of Biostatistics, Shanghai Jiaotong University School of Medicine, Shanghai, China for data processing, and Weiping Tu, Bin Li and Ling Hu for helping organize this investigation. The authors thank all of the team members and the participants from Shanghai, Zhejiang Province and Jiangxi Province in the SPECT-China study.
Footnotes
Author Contributions Y.L. designed the research; N.W., H.Z., B.H., Q.L., Y.C., Y.C., F.X. and D.L. collected the data; Y.L. provided essential reagents and materials; N.W. analyzed the data; N.W. and H.Z. wrote the manuscript. All authors read and approved the final manuscript.
References
- Ding E. L., Song Y., Malik V. S. & Liu S. Sex differences of endogenous sex hormones and risk of type 2 diabetes: a systematic review and meta-analysis. JAMA. 295, 1288–1299 (2006). [DOI] [PubMed] [Google Scholar]
- Khaw K. T. et al. Endogenous testosterone and mortality due to all causes, cardiovascular disease, and cancer in men: European prospective investigation into cancer in Norfolk (EPIC-Norfolk) Prospective Population Study. Circulation 116, 2694–2701 (2007). [DOI] [PubMed] [Google Scholar]
- Mulligan T., Frick M. F., Zuraw Q. C., Stemhagen A. & McWhirter C. Prevalence of hypogonadism in males aged at least 45 years: the HIM study. Int. J. Clin. Pract. 60, 762–769 (2006). [DOI] [PMC free article] [PubMed] [Google Scholar]
- Liu C. C. et al. The prevalence of and risk factors for androgen deficiency in aging Taiwanese men. J. Sex. Med. 6, 936–946 (2009). [DOI] [PubMed] [Google Scholar]
- Corona G., Vignozzi L., Sforza A., Mannucci E. & Maggi M. Obesity and late-onset hypogonadism. Mol. Cell. Endocrinol. (2015) Available at: http://www.sciencedirect.com/science/article/pii/S030372071500338X. (Accessed: 5th November 2015). [DOI] [PubMed]
- Brand J. S. et al. Testosterone, sex hormone-binding globulin and the metabolic syndrome in men: an individual participant data meta-analysis of observational studies. PloS. one 9, e100409 (2014). [DOI] [PMC free article] [PubMed] [Google Scholar]
- Amato M. C. & Giordano C. Visceral adiposity index: an indicator of adipose tissue dysfunction. Int. J. Endocrinol. 2014, 730827 (2014). [DOI] [PMC free article] [PubMed] [Google Scholar]
- Amato M. C. et al. Visceral Adiposity Index: a reliable indicator of visceral fat function associated with cardiometabolic risk. Diabetes care 33, 920–922 (2010). [DOI] [PMC free article] [PubMed] [Google Scholar]
- Musso G., Cassader M. & Gambino R. Diagnostic accuracy of adipose insulin resistance index and visceral adiposity index for progressive liver histology and cardiovascular risk in nonalcoholic fatty liver disease. Hepatology 56, 788–789 (2012). [DOI] [PubMed] [Google Scholar]
- Amato M. C., Verghi M., Galluzzo A. & Giordano C. The oligomenorrhoic phenotypes of polycystic ovary syndrome are characterized by a high visceral adiposity index: a likely condition of cardiometabolic risk. Hum. Reprod. 26, 1486–1494 (2011). [DOI] [PubMed] [Google Scholar]
- Ciresi A., Amato M. C., Pizzolanti G. & Giordano Galluzzo C. Visceral adiposity index is associated with insulin sensitivity and adipocytokine levels in newly diagnosed acromegalic patients. J. Clin. Endocrinol. Metab. 97, 2907–2915 (2012). [DOI] [PubMed] [Google Scholar]
- Amato M. C. et al. Visceral adiposity index (VAI) is predictive of an altered adipokine profile in patients with type 2 diabetes. PloS. one 9, e91969 (2014). [DOI] [PMC free article] [PubMed] [Google Scholar]
- Al-Daghri N. M. et al. Visceral adiposity index is highly associated with adiponectin values and glycaemic disturbances. Eur. J. Clin. Invest. 43, 183–189 (2013). [DOI] [PubMed] [Google Scholar]
- Pouliot M. C. et al. Waist circumference and abdominal sagittal diameter: best simple anthropometric indexes of abdominal visceral adipose tissue accumulation and related cardiovascular risk in men and women. Am. J. Cardiol. 73, 460–468 (1994). [DOI] [PubMed] [Google Scholar]
- Morelli A. et al. Metabolic syndrome induces inflammation and impairs gonadotropin-releasing hormone neurons in the preoptic area of the hypothalamus in rabbits. Mol. Cell. Endocrinol. 382, 107–119 (2014). [DOI] [PubMed] [Google Scholar]
- Corona G. et al. Body weight loss reverts obesity-associated hypogonadotropic hypogonadism: a systematic review and meta-analysis. Eur. J. Endocrinol. 168, 829–43 (2013). [DOI] [PubMed] [Google Scholar]
- Georgiev I. P. et al. Effects of castration-induced visceral obesity and antioxidant treatment on lipid profile and insulin sensitivity in New Zealand white rabbits. Res. Vet. Sci. 90, 196–204 (2011). [DOI] [PubMed] [Google Scholar]
- Saylor P. J. & Smith M. R. Metabolic complications of androgen deprivation therapy for prostate cancer. J. Urol. 189, S34–42; discussion S43-34 (2013). [DOI] [PubMed] [Google Scholar]
- Abdelhamed A. et al. Testosterone replacement alters the cell size in visceral fat but not in subcutaneous fat in hypogonadal aged male rats as a late-onset hypogonadism animal model. Res. Rep. Urol. 7, 35–40 (2015). [DOI] [PMC free article] [PubMed] [Google Scholar]
- Allan C. A., Strauss B. J., Burger H. G., Forbes E. A. & McLachlan R. I. Testosterone therapy prevents gain in visceral adipose tissue and loss of skeletal muscle in nonobese aging men. J. Clin. Endocrinol. Metab. 93, 139–146 (2008). [DOI] [PubMed] [Google Scholar]
- Simo R., Saez-Lopez C., Barbosa-Desongles A., Hernandez C. & Selva D. M. Novel insights in SHBG regulation and clinical implications. Trends. Endocrin. Metab. 26, 376–383 (2015). [DOI] [PubMed] [Google Scholar]
- Du T. et al. Nontraditional risk factors for cardiovascular disease and visceral adiposity index among different body size phenotypes. Nutr. Metab. Cardiovasc. Dis. 25, 100–107 (2015). [DOI] [PMC free article] [PubMed] [Google Scholar]
- Feng R. N. et al. Lean-non-alcoholic fatty liver disease increases risk for metabolic disorders in a normal weight Chinese population. World J. Gastroenterol. 20, 17932–17940 (2014). [DOI] [PMC free article] [PubMed] [Google Scholar]
- Chen C. et al. The application of visceral adiposity index in identifying type 2 diabetes risks based on a prospective cohort in China. Lipids Health Dis. 13, 108 (2014). [DOI] [PMC free article] [PubMed] [Google Scholar]
- Oh J. Y., Sung Y. A. & Lee H. J. The visceral adiposity index as a predictor of insulin resistance in young women with polycystic ovary syndrome. Obesity (Silver Spring) 21, 1690–1694 (2013). [DOI] [PubMed] [Google Scholar]
- Vermeulen A., Verdonck L. & Kaufman J. M. A critical evaluation of simple methods for the estimation of free testosterone in serum. J. Clin. Endocrinol. Metab. 84, 3666–3672 (1999). [DOI] [PubMed] [Google Scholar]
- Wang C. et al. Investigation, treatment and monitoring of late-onset hypogonadism in males: ISA, ISSAM, EAU, EAA and ASA recommendations. Eur. J. Endocrinol. 159, 507–514 (2008). [DOI] [PMC free article] [PubMed] [Google Scholar]
- Nimptsch K., Platz E. A., Willett W. C. & Giovannucci E. Association between plasma 25-OH vitamin D and testosterone levels in men. Clin. Endocrinol. (Oxf.) 77, 106–112 (2012). [DOI] [PMC free article] [PubMed] [Google Scholar]
- Harman S. M. et al. Longitudinal effects of aging on serum total and free testosterone levels in healthy men. Baltimore Longitudinal Study of Aging. J. Clin. Endocrinol. Metab. 86, 724–731 (2001). [DOI] [PubMed] [Google Scholar]
- Zhang X. et al. Visceral adiposity and risk of coronary heart disease in relatively lean Chinese adults. Int. J Cardiol. 168, 2141–2145 (2013). [DOI] [PMC free article] [PubMed] [Google Scholar]
- Lear S. A. et al. Visceral adipose tissue accumulation differs according to ethnic background: results of the Multicultural Community Health Assessment Trial (M-CHAT). Am. J. Clin. Nutr. 86, 353–359 (2007). [DOI] [PubMed] [Google Scholar]
- Wang N. et al. Is exposure to famine in childhood and economic development in adulthood associated with diabetes? J. Clin. Endocrinol. Metab. (2015) Available at: http://press.endocrine.org/doi/10.1210/jc.2015-2750. (Accessed: 5th November 2015). [DOI] [PMC free article] [PubMed] [Google Scholar]
- Xu Y. et al. Prevalence and control of diabetes in Chinese adults. JAMA. 310, 948–959 (2013). [DOI] [PubMed] [Google Scholar]
- Preis S. R. et al. Neck circumference as a novel measure of cardiometabolic risk: the Framingham Heart study. J. Clin. Endocrinol. Metab. 95, 3701–3710 (2010). [DOI] [PMC free article] [PubMed] [Google Scholar]
- Freedman D. S. et al. The body adiposity index (hip circumference/height(1.5)) is not a more accurate measure of adiposity than is BMI, waist circumference, or hip circumference. Obesity (Silver Spring) 20, 2438–2444 (2012). [DOI] [PMC free article] [PubMed] [Google Scholar]
- Alberti K. G., Zimmet P., Shaw J. & IDF Epidemiology Task Force Consensus Group. The metabolic syndrome–a new worldwide definition. Lancet 366, 1059–1062 (2005). [DOI] [PubMed] [Google Scholar]
- Hanley J. A. & McNeil B. J. The meaning and use of the area under a receiver operating characteristic (ROC) curve. Radiology 143, 29–36 (1982). [DOI] [PubMed] [Google Scholar]