Abstract
Better understanding of the molecular changes associated with disease is essential for identifying new routes to improved therapeutics and diagnostic tests. The aim of this study was to investigate the dynamic changes in the metabolic profile of mouse sera during T. gondii infection. We carried out untargeted metabolomic analysis of sera collected from female BALB/c mice experimentally infected with the T. gondii Pru strain (Genotype II). Serum samples were collected at 7, 14 and 21 day post infection (DPI) from infected and control mice and were subjected to liquid chromatography-quadrupole time-of-flight mass spectrometry (LC-Q-TOF-MS)-based global metabolomics analysis. Multivariate statistical analysis identified 79 differentially expressed metabolites in ESI+ mode and 74 in ESI− mode in sera of T. gondii-infected mice compared to the control mice. Further principal component analysis (PCA) and partial least squares-discrimination analysis (PLS-DA) identified 19 dysregulated metabolites (5 in ESI+ mode and 14 in ESI− mode) related to the metabolism of amino acids and energy metabolism. The potential utility of these metabolites as diagnostic biomarkers was validated through receiver operating characteristic (ROC) curve analysis. These findings provide putative metabolite biomarkers for future study and allow for hypothesis generation about the pathophysiology of toxoplasmosis.
Toxoplasma gondii is an obligate intracellular protozoan pathogen that can infect any warm-blooded animal species and virtually any nucleated cell types, which makes T. gondii a highly prevalent parasitic infection with up to one third of the world’s human population has been estimated to be infected1. While infection in immunocompetent people is asymptomatic, T. gondii can cause retinochoroiditis and encephalitis in immunocompromised individuals, and has been a frequent cause of abortion or congenital toxoplasmosis in pregnant women2. Variation in the clinical manifestations and severity of the disease is determined by both the host’s genetic background and the genotype of the infecting parasite strain3. Type I strains are lethal (LD100~1), and in contrast, type II and III strains are significantly less virulent (LD100 ≥ 103)4. In North America and Europe, Type II strains are responsible for human toxoplasmosis and chronic infections in food animals5.
The prognosis of toxoplasmosis largely depends on the stage of T. gondii infection. Acute infection is caused by the tachyzoite stage of the parasite, and as infection progresses tachyzoite transforms to the bradyzoite form, which is associated with long-term chronic infection, where the parasite persists for many years or the life-time of the host6. T. gondii strictly relies on host cellular metabolism to obtain the energy and biosynthetic building blocks required for their replication7. But, very little is known about the physiological state and biochemical landscape of both the host and parasite during these acute and chronic infections. During chronic infection T. gondii enters a quiescent state; however there is a possibility that even the latent parasite stage exerts a considerable impact on the host metabolic profiles8. The alteration in the metabolism of the host during acute and latent stages of T. gondii infection needs to be defined in order to better understand the pathogenesis of toxoplasmosis (e.g., the potential role of quiescence in combating host parasiticidal responses) and develop drugs that target processes essential for parasite survival during latency.
How an intracellular pathogen such as T. gondii manipulates the metabolism of its host in order to create a more hospitable metabolic niche has been a central question in toxoplasmosis research9. T. gondii is in a constant competition with its host over access to carbon sources and nutrients because this parasite needs to tailor its metabolism to fulfill particular tasks, such as the synthesis of virulence factors or the maintenance of its energy/redox state in hospitable host environments. Recently, a pioneering study has investigated the metabolic needs and capabilities of T. gondii using a combined computational and experimental approach10. The interplay between T. gondii parasites and their hosts has been studied for decades using targeted approaches, such as the analysis of mutants or host immunological responses11,12. Although much has been learned from such studies, they focus on individual pathways and fail to reveal the global effects of infection on the host’s metabolism. To address this limitation, high-throughput methods, such as transcriptomics and proteomics, have been used to study host- T. gondii interactions13,14. However, the effect of T. gondii on the biochemical composition of host body fluids remains unknown. T. gondii, although strictly intracellular it has been detected in body fluids15,16. These extracellular niches may provide different nutrient availability or other benefits and challenges. Therefore, a complete understanding of T. gondii pathogenesis necessitates consideration of the effect of the parasite on the metabolism of body fluids over time. In this regard, host serum offers an important window for understanding the biological changes that occur in host during infection.
Recently, techniques that detect and quantify multiple small chemical metabolites in complex biological samples have been developed, giving rise to the field of metabolomics17. Metabolomic studies have relied on the use of analytical platforms, such as nuclear magnetic resonance (NMR), gas or liquid chromatography coupled to mass spectrometry (GC-MS/LC-MS) and capillary electrophoresis/mass spectrometry (CE-MS) for the analysis of the metabolome7. Among these techniques, LC/MS has been widely used in metabolites’ identification and quantification, and has been a useful metabolomic method with high sensitivity, peak resolution, and reproducibility18. Also, it can identify and quantify hundreds of metabolites with higher mass accuracy, thus allowing comprehensive metabolic profiling19. This non-targeted metabolomic approach enables changes in many metabolites to be evaluated in an unbiased fashion, and thus can provide a global view of dynamic metabolic variations, simulating the changes that occur during the disease development, which can allow the discovery of key metabolites that are able to discriminate healthy individuals from patients20.
We used LC-Q/TOF-MS-metabolomic-based approach to investigate the impact of T. gondii infection on host metabolism using BALB/c mice as a model. To our knowledge, this is the first comprehensive metabolomic analysis of the effect of T. gondii infection on host serum metabolism. Our findings indicate that LC-MS-based untargeted metabolomic analysis is able to identify dysregulated metabolites in mouse serum and discriminate the metabolomic profile between T. gondii-infected and non-infected mice, as well as during the different stages of the disease. A few mammalian signaling pathways of fundamental importance for host metabolic and immune homeostasis have been affected, including pathways involved in host amino acid, lipid and energy signaling. The disruption of such pathways reveals the significant impact of T. gondii infection on host metabolic function and may shed light on the molecular mechanisms used by T. gondii to cause disease, as well as those used by host defenses.
Results
Characteristics of infected mice
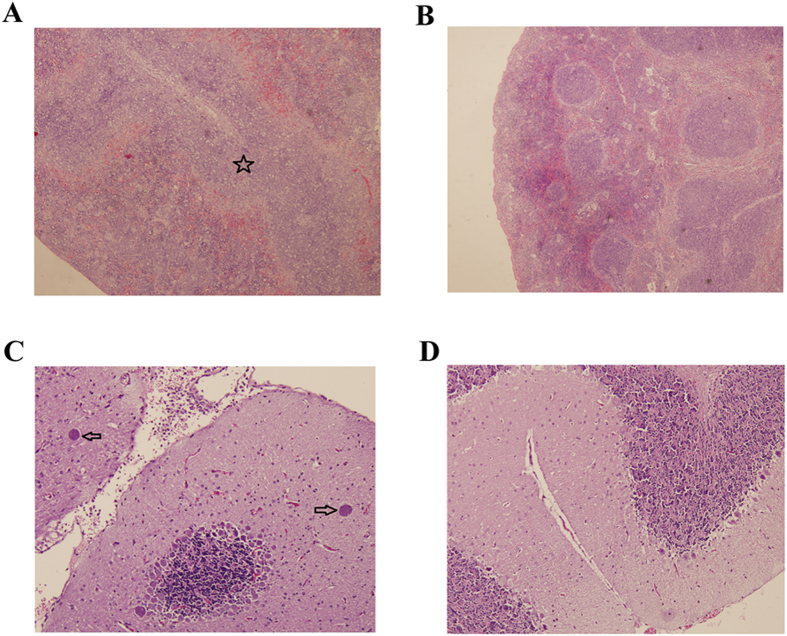
Control mice did not exhibit any clinical signs during the entire course of infection. However, infected mice showed time-dependent increase in the progression of illness. Infection has been assessed via the detection of T. gondii B1 gene in various mouse tissues and all infected mice were tested positive (data not shown). At 7 DPI mice showed mild signs, which progressed to typical clinical signs of acute infection at 10 DPI. By 14 DPI mice began to recover and at 21 DPI all mice restored their normal physical state. Using H&E staining, spleen and brain samples were examined for histopathological damages caused by T. gondii. As expected, all control mice tissues did not show any obvious pathological changes. In contrast, infected mice showed splenomegaly at 14 DPI (Fig. S1). Also, a reduced white pulp with an expansion of the red pulp compartment was observed at 14 DPI (Fig. 1A). Brain of infected mice had inflammatory reactions characterized by focal mononuclear cell infiltrates and glial nodules at 14 and 21 DPI. A number of multifocally distributed tissue cysts filled with bradyzoites were detected at 21 DPI (Fig. 1C).
Figure 1. Histopathological lesions in mouse tissues infected with Toxoplasma gondii Pru strain (10 cysts per mouse by oral route, H&E stain).
(A) A section of spleen from infected mice at 14 DPI. Pentagram indicates the largely scattered white pulp; (B) A section of spleen from normal mice at 14 DPI showing no histological abnormalities; (C) Brain histology of infected mice at 21 DPI. Arrow indicates the tissue cyst; (D) Brain histology of normal mice at 21 DPI without any pathological changes. Magnifications: 40X (A,B); 100X (C,D).
Comparative metabolite profiling of serum from infected mice and controls
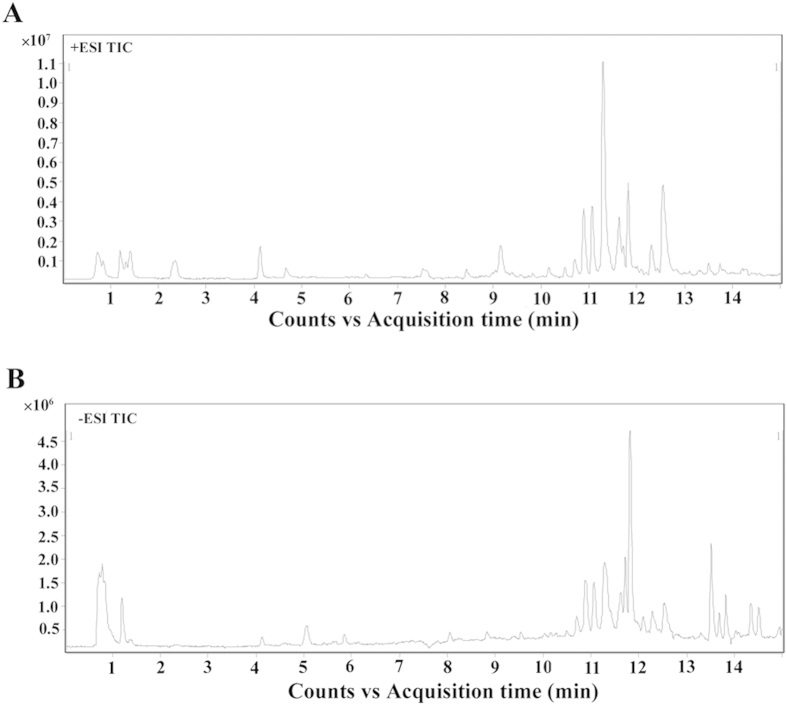
We next analyzed all total ion chromatograms of mice sera. We noted a stable retention time without peaks’ drifts (Fig. S2). Representative TIC chromatograms of serum samples from infected mice are shown (Fig. 2). Baseline correction, peak deconvolution, alignment, normalization and median-centering are applied to process the data, and there are 509 and 532 retention time-exact mass pairs determined in each sample profile analyzed in positive or negative ion mode, respectively. The majority of peaks in the chromatograms are identified as endogenous metabolites and most of these metabolites are involved in multiple biochemical processes, especially in energy and lipid metabolism. The LC–MS system stability and reproducibility for the large-scale sample analysis were observed in the PCA scores plot representation of QC samples by using the metabolite profiles obtained in positive and negative ion modes, as shown in Fig. S3. Six QC samples were run for serum samples throughout the entire analysis. There was no drift in the PCA scores plot representation of QC samples, and 87.2% and 93.2% of RSDs were less than 30% for serum samples in the positive mode and negative mode, respectively. Therefore, the LC–MS system repeatability and stability were deemed acceptable.
Figure 2. Representative total ion current (TIC) chromatograms of infected mice serum obtained in.
(A) positive ion mode (ESI+) and (B) negative ion mode (ESI-). Y-axis represents the intensity.
To investigate the metabolic variations during the disease progression, all observations acquired in both ion modes were first analyzed using two components PCA score trajectories plot (Fig. S4). The score plot did not illustrate good classification of the infected mice groups and their corresponding control groups. Subsequently, the cross-validated two-component PLS-DA models were used for further multivariate analysis, and showed a satisfactory modeling. To reduce the system error and interference of impurity peak, the OPLS-DA model of SIMCA-P were then established for the following analysis.
Temporal variation in metabolic profiling
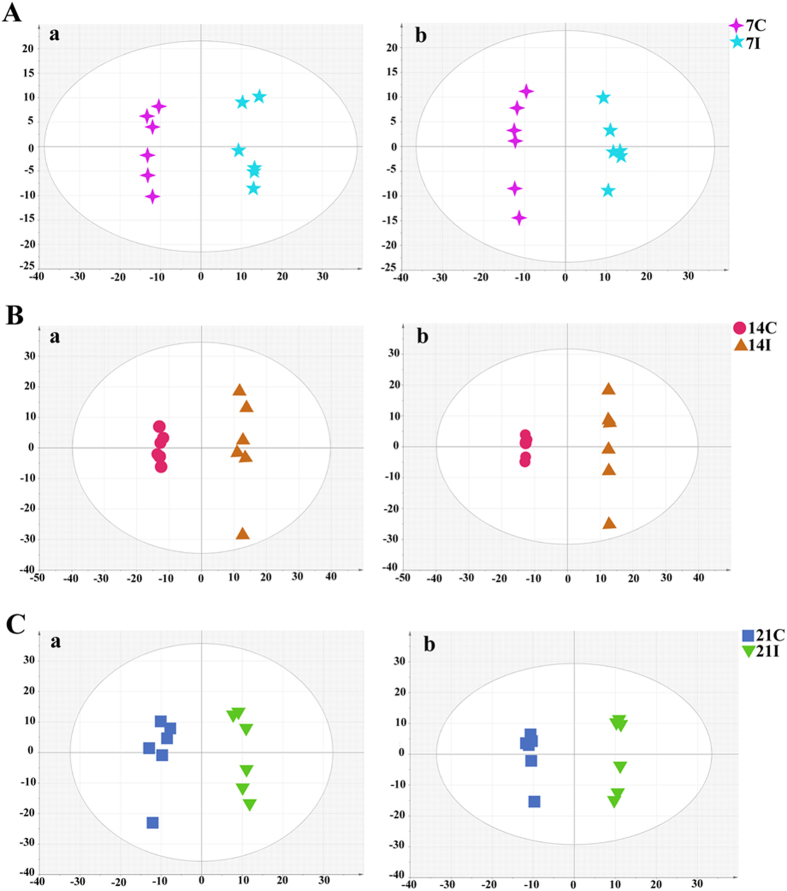
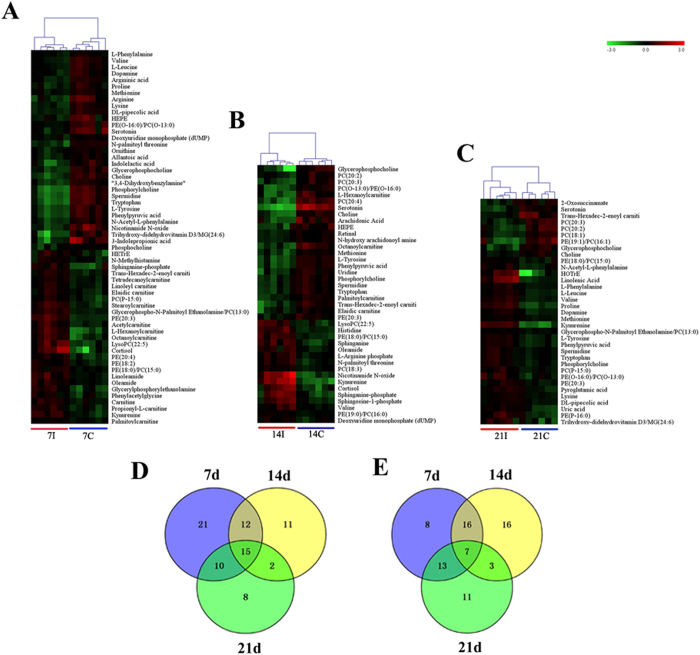
To better define the metabolic variations in mice serum after T. gondii infection, all observations acquired in both ion modes were analyzed using OPLS-DA. Generally, the model is believed to be reliable when the Q2 > 0.4. As shown in Fig. 3 the scores plots of OPLS-DA model discriminated the infected groups from their corresponding control groups, which exhibited satisfactory classification. The differential metabolites at different times post infection were selected according to the VIP threshold (VIP > 1) in the OPLS-DA model and the p-value of student’s t-test (p < 0.05) after FDR correction. As shown in Fig. 4A–C the serum metabolic states of the infected mice deviated significantly from their corresponding controls in the ESI+ mode. The serum metabolic profiling in the infected mice changed most significantly from their controls at 7 DPI. As the infection time increases the number of differential metabolites decreased, indicating a restoration of the dysregulated metabolic state in a time-dependent manner. Meanwhile, metabolic profile observed in ESI- mode also exhibited the same trend (Fig. S5). Of the 79 differential metabolites detected in ESI+ mode, 43 were shared between at least two of the three infection stages (Fig. 4D). Also, we detected 74 significant differential metabolites in ESI- mode, of which 43 were shared between at least two of three infection stages (Fig. 4E). As shown in Table 1, we detected 15 metabolites under ESI+ and 7 metabolites under ESI- that varied at all three time points. The related pathways of each metabolite were also listed by searching the KEGG pathway database (http://www.genome.jp/kegg/), and the majority of these 22 metabolites were involved in lipid metabolism and amino acid metabolism.
Figure 3. OPLS-DA score plot of T. gondii infected and control groups.
(A) The 7D infected group (7I) and the 7D control group (7C) (R2X = 0.427, R2Y = 0.985,Q2 = 0.829 ESI+; R2X = 0.392, R2Y = 0.987, Q2 = 0.801 ESI−); (B) The 14D infected group (14I) and the 14D control group (14C) (R2X = 0.699, R2Y = 0.996, Q2 = 0.934 ESI+; R2X = 0.771, R2Y = 1, Q2 = 0.944 ESI−); (C) The 21D infected group (21I) and the 21D control group (21C) (R2X = 0.506, R2Y = 0.975,Q2 = 0.877 ESI+; R2X = 0.505, R2Y = 0.997, Q2 = 0.852 ESI−). In the OPLS-DA score plot, each data point represents one mouse serum sample, and the distance between points in the plot indicates the similarity between samples. (a) ESI+; (b) ESI-. x- and y-axes represent PC1 and PC2, respectively.
Figure 4. Comparison of the mice serum metabolomes during the course of infection.
Heat maps representing the significantly changed metabolites between infected groups and the corresponding control groups in ESI+ mode (A–C). Individual samples are separated using hierarchical clustering, with the dendrogram scaled to represent the distance between each branch. Heat maps show a clear separation of metabolomic profile between different groups. Normalized signal intensities (log2 transformed and row adjustment) are visualized as a color spectrum and the scale from least abundant to highest ranges is from −3.0 to 3.0. Green indicates low expression, whereas red indicates high expression of the detected metabolites. (A) 7D infected group vs 7D control; (B) 14D infected group vs 14D control; (C) 21D infected group vs 21D control; (D) Venn diagram shows a clear separation among sample groups at the three indicated infection time points in the ESI + mode; (E) Venn diagram shows a clear separation among sample groups at three indicated infection time points in the ESI- mode.
Table 1. List of dysregulated metabolites identified in the serum of mice throughout the entire infection process.
| Modes | mz | Name | Rt (min) | 7d* | 14d* | 21d* | Metabolic pathways |
|---|---|---|---|---|---|---|---|
| ESI+ | 104.1072 | Choline | 0.78 | −1.16 | −1.20 | −0.35 | Glycine, serine and threonine metabolism; Glycerophospholipid metabolism; bile secretion |
| 258.1101 | Glycerophosphocholine | 0.81 | −0.95 | −1.54 | −0.78 | Glycerophospholipid metabolism | |
| 118.0863 | Valine | 1.2 | −0.65 | 0.53 | 0.63 | Valine, leucine and isoleucine degradation and biosynthesis | |
| 150.0584 | Methionine | 1.21 | −0.35 | −0.71 | 0.25 | Cysteine and methionine metabolism | |
| 182.0812 | L-Tyrosine | 1.25 | −1.18 | −1.08 | 0.58 | Tyrosine metabolism; Phenylalanine metabolism; Phenylalanine, tyrosine and tryptophan biosynthesis; Thiamine metabolism | |
| 165.0544 | Phenylpyruvic acid | 1.25 | −1.19 | −1.04 | 0.58 | Phenylalanine metabolism; Phenylalanine, tyrosine and tryptophan biosynthesis | |
| 177.1022 | Serotonin | 1.79 | −1.06 | −3.30 | −0.73 | Tryptophan metabolism; bile secretion | |
| 209.092 | Kynurenine | 2.27 | 0.83 | 2.72 | 1.80 | Tryptophan metabolism | |
| 170.0598 | Phosphorylcholine | 4.12 | −1.69 | −0.62 | 0.38 | Glycerophospholipid metabolism | |
| 146.0601 | Spermidine | 4.13 | −1.67 | −0.57 | 0.34 | Not known | |
| 205.0972 | Tryptophan | 4.13 | −1.60 | −0.66 | 0.37 | Phenylalanine, tyrosine and tryptophan biosynthesis | |
| 398.3268 | Trans-Hexadec-2-enoyl carnitine | 10.01 | 0.46 | −1.03 | −0.93 | Not known | |
| 482.3244 | PE (18:0)/PC (15:0) | 10.72 | 0.36 | 1.05 | 0.27 | Not known | |
| 440.3137 | PE (O-16:0)/PC (O-13:0) | 11.51 | −0.66 | −0.98 | 0.65 | Not known | |
| 504.3066 | PE(20:3) | 12.44 | 1.14 | −0.43 | 0.31 | Not known | |
| ESI− | 242.0798 | Cytidine | 0.81 | −0.66 | −0.73 | −0.71 | Pyrimidine metabolism |
| 180.0666 | L-Tyrosine | 1.27 | −1.23 | −0.49 | 0.77 | Tyrosine metabolism | |
| 130.0873 | L-Leucine | 1.42 | −0.51 | 1.14 | 0.79 | Valine, leucine and isoleucine degradation; Valine, leucine and isoleucine biosynthesis | |
| 245.0933 | N-Acetyl-DL-tryptophan | 6.14 | −2.25 | −2.11 | −1.18 | Not known | |
| 508.3408 | 1-heptadecanoyl-sn-glycero-3-phosphocholine | 12.56 | −0.21 | 0.48 | 0.14 | Not known | |
| 303.2328 | Arachidonic Acid | 13.69 | −0.65 | −1.17 | −0.72 | Arachidonic acid metabolism | |
| 305.2488 | Eicosatrienoic acid | 14.1 | −0.60 | −1.14 | −0.49 | Not known |
*indicates Log2 Fold change.
Metabolic Variations between different stages
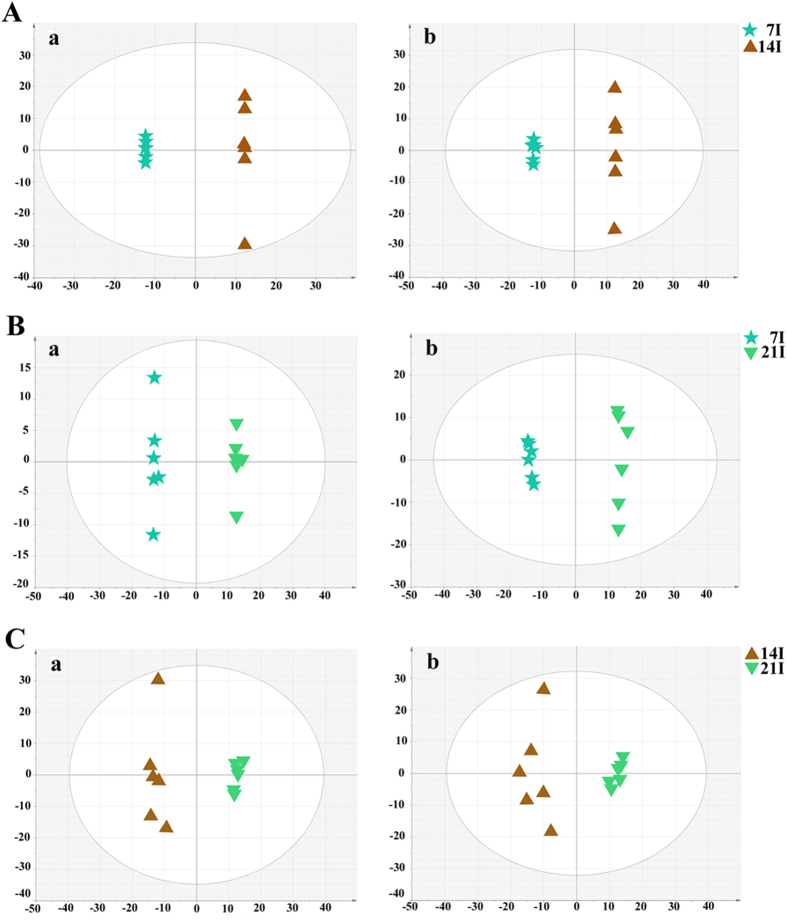
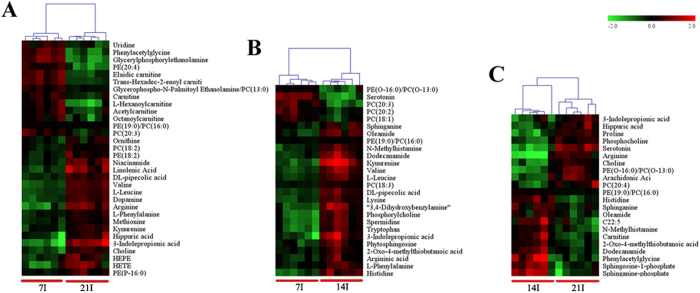
To further our understanding of the effects of T. gondii infection on host serum metabolism, we examined the changes in the chemical composition of serum extracts during different stages of the infection as defined by histopathology. As shown in Fig. 5 score plot from supervised OPLS-DA showed good discrimination between different infected animal groups in both positive and negative ion modes, which indicated that their metabolic profiles were distinct. Those significantly changed metabolites were then used to construct heat maps for unsupervised clustering. As shown in Fig. 6, heat maps of the differential metabolites detected in ESI+ mode showed a clear clustering for each group in agreement with the OPLS-DA results. Mice at 14 and 21 DPI were recovering from the acute infection, and exhibited the minimal difference in the number of differential metabolites (Fig. 6C). At 7 DPI mice would be soon developing an acute infection stage, exhibited the larger number of differential metabolites when compared with other two infected groups (Fig. 6A,B). We also constructed heat maps using differential metabolites detected in ESI- mode. Even though sample clusters overlapped slightly, most samples were clearly grouped into two differentiated clusters and subsequent statistic analysis revealed dramatic time-dependent changes in the number of differential metabolites (Fig. S6).
Figure 5. OPLS-DA score plot showing a clear separation between the infected serum samples at different time points after infection.
(A) The 7D infected group vs the 14D infected group (R2X = 0.782, R2Y = 1, Q2 = 0.953 ESI+; R2X = 0.717, R2Y = 1, Q2 = 0.946 ESI−); (B) The 21D infected group vs the 7D infected group (R2X = 0.433, R2Y = 0.997, Q2 = 0.952 ESI+; R2X = 0.517, R2Y = 0.996, Q2 = 0.954 ESI−); (C) The 21D infected group vs the 14D infected group (R2X = 0.604, R2Y = 0.988, Q2 = 0.93 ESI+; R2X = 0.539, R2Y = 0.957, Q2 = 0.808 ESI−). (a) ESI+, (b) ESI−. X axis is PC1, Y axis is PC2.
Figure 6. Heat map showing the significantly dysregulated metabolites identified between different infected groups in ESI+ mode.
Individual samples are separated using hierarchical clustering, with the dendrogram scaled to represent the distance between each branch. Heat maps show a clear separation of the metabolomic profile between different infected groups. Normalized signal intensities (log2 transformed and row adjustment) are visualized as a color spectrum and the scale from least abundant to highest ranges is from −2.0 to 2.0. Green color indicates low expression, and red color indicates high expression of the detected metabolites. (A) 7D infected group vs 21D infected group; (B) 7D infected group vs 14D infected group; (C) 14D infected group vs 21D infected group.
Identification of potential biomarkers
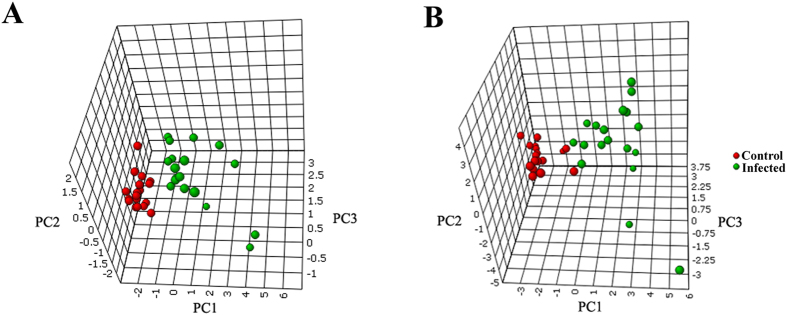
The potential biomarker metabolites that significantly contributed to the discrimination of infected mice from controls were identified by using the receiver operating characteristic (ROC) curve analysis in MetaboAnalyst 3.021. Firstly, univariate ROC curve analyses were applied to quantify the predictive performance of each potential biomarker. The sensitivity and specificity trade-offs were calculated for each selected metabolite using the area under the ROC curve (AUC). This analysis identified 5 significantly differential metabolites in ESI+ mode and 14 significantly differential metabolites in ESI- mode with AUC > 0.8, which were selected after standardization of data as shown in Table 2. 3D PCA models and heat maps were constructed using the marker metabolite intensities as variables. As shown in Fig. 7 and Fig. S7, the infected mice group and the control group were separated into two different regions.
Table 2. Potential marker metabolites detected in LC/MS chromatograms.
| Ion mode | Metabolites | Rt (min) | P-value | AUC | Log2 (FC) | Metabolic pathways |
|---|---|---|---|---|---|---|
| ESI (−) | Oleic Acid | 14.51 | 1.14E-03 | 0.827 | −0.67 | Fatty acid biosynthesis |
| ESI (−) | Eicosapentaenoic Acid | 14.29 | 1.31E-05 | 0.88 | −0.88 | Biosynthesis of unsaturated fatty acids |
| ESI (−) | Arachidonic Acid | 13.69 | 9.90E-06 | 0.889 | −0.83 | Arachidonic acid metabolism |
| ESI (−) | HOME | 13.58 | 5.84E-06 | 0.886 | −0.85 | Not known |
| ESI (−) | PC (15:0) | 12.45 | 6.75E-05 | 0.898 | 0.52 | Not known |
| ESI (+) | Glycerophospho-N-Palmitoyl Ethanolamine | 11.22 | 2.70E-03 | 0.836 | 0.27 | Not known |
| ESI (−) | PE (16:0) | 11.22 | 2.10E-04 | 0.867 | 0.32 | Not known |
| ESI (−) | Taurocholic acid | 8.05 | 1.01E-03 | 0.802 | 1.26 | Taurine and hypotaurine metabolism; bile secretion |
| ESI (−) | N-Acetyl-DL-tryptophan | 5.95 | 2.71E-07 | 0.963 | −1.94 | Not known |
| ESI (−) | L-Phenylalanine | 2.34 | 1.29E-04 | 0.843 | 0.33 | Aromatic amino acid metabolism |
| ESI (+) | Kynurenine | 2.27 | 1.54E-04 | 0.997 | 1.77 | Tryptophan metabolism |
| ESI (+) | Serotonin | 1.79 | 3.52E-10 | 0.975 | −1.69 | Tryptophan metabolism |
| ESI (−) | Fumaric acid | 1.36 | 1.12E-03 | 0.923 | −0.77 | TCA cycle |
| ESI (−) | Citric acid | 1.21 | 5.01E-05 | 0.855 | −0.62 | TCA cycle |
| ESI (−) | Glutathione, oxidized | 1.21 | 1.22E-03 | 0.824 | −0.87 | Glutathione metabolism; Methane metabolism |
| ESI (−) | Malic acid | 1.17 | 1.10E-02 | 0.883 | −0.69 | Not known |
| ESI (+) | Glycerophosphocholine | 0.81 | 8.48E-09 | 0.978 | −1.37 | Glycerophospholipid metabolism |
| ESI (−) | Cytidine | 0.81 | 4.01E-05 | 0.882 | −0.73 | Pyrimidine metabolism |
| ESI (+) | Choline | 0.78 | 6.00E-07 | 0.938 | −0.93 | Glycerophospholipid metabolism |
Figure 7. 3D plot showing clear separation between T. gondii infected samples and controls using PCA analysis in ESI+ mode.
(A) and ESI- mode (B).
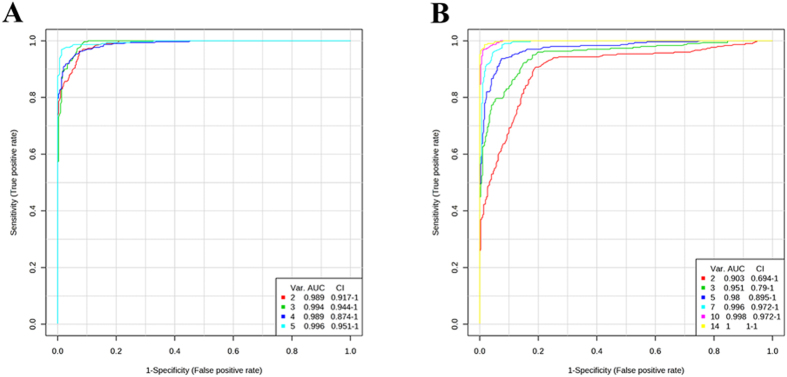
To evaluate the utility of metabolite combination for the diagnosis of T.gondii infection, multivariate exploratory ROC analysis was performed. ROC curves are generated by Monte-Carlo cross validation (MCCV) using balanced subsampling. Different biomarker modules were created through the built-in feature selections. As shown in Fig. 8, the AUC values obtained in this analysis were 0.996 (95% C.I. 0.951-1) and 1(95% C.I. 1-1) for all the 5 marker metabolites in ESI+ mode and 14 marker metabolites in ESI- mode, respectively (an ideal model would have an AUC of 1). Together, these results indicate that the indentified potential biomarkers, alone or in combination, can discriminate the infected samples from the controls with high accuracy and could be powerful indicators for Toxoplasmosis monitoring.
Figure 8. Comparisons of different matabolites panels based on ROC curves.
ROC curves are generated by Monte-Carlo cross validation (MCCV) using balanced subsampling. PLS-DA algorithm was selected as classification and feature ranking method. In each MCCV, two-thirds of the samples are used to evaluate the feature (metabolite) importance. Different panels of important features are then used to build classification models, which is validated on the one-third samples that were left out. The different models with specific feature numbers and their corresponding AUCs are shown on the figure. (A) Marker metabolites detected in ESI+ mode, (B) Maker metabolites detected in ESI- mode. Var. (variables) indicates the number of selected features.
Discussion
Host-pathogen interactions have been studied using several “omics” techniques, such as genomics, transcriptomics, and proteomics, and more recently metabolomics, a newly established omics’ methodology based on the analysis of small metabolites to study chemical changes in biological properties22. The use of these omics methodologies has revealed important information about many biological systems and has greatly contributed to the development of systems biology. In the present study we performed a LC-Q/TOF-MS-based untargeted metabolomic study to investigate the global effect of T. gondii infection on the serum metabolism of BALB/c mice. Our results show that T. gondii infection causes significant dynamic changes in the metabolite balance of the serum of T. gondii-infected mice and identified novel biomarkers with potential diagnostic value.
Fifteen metabolites detected in ESI+ mode and 7 metabolites in ESI- mode were found to vary during the 21 day of the infection period (Table 1). They represent perturbations in multiple pathways, such as pyrimidine metabolism, lipid metabolism and tryptophan metabolism23. Among these metabolites, kynurenine, phosphatidylethanolamine (PE) (18:0)/phosphatidylcholine (PC) (15:0) were increased, whereas, the level of choline, glycerophosphocholine, serotonin, cytidine, N-Acetyl-DL-tryptophan, arachidonic acid and eicosatrienoic acid were decreased. These infection-specific metabolic alterations are consistent with the current understanding of host-T. gondii interaction biology. Metabolic function is known to influence the activity of the immune system24. In this regard, T. gondii infection induces major immunological changes, that in some cases are linked to the production of amino acid metabolites, such as kynurenine (consistent with our finding), a product of indoleamine 2,3 dioxygenase (IDO) enzymatic degradation of tryptophan; a key antiparasitic mechanism to control parasite growth25. The induction of IDO by interferon-γ (IFN-γ) and some pro-inflammatory cytokines is associated with depleted plasma tryptophan (in agreement with our finding), which may interfere with brain 5-HT synthesis, and increased production of anxiogenic and depressogenic tryptophan catabolites26. Evidence showed that kynurenine might be involved in depression and cognitive deficits20,27,28, which explains the depressive and anxiety symptoms exhibited by the infected mice. Serotonin is another metabolite in tryptophan metabolism and its depletion is also associated with depression, and anxiety29. The exact mechanism of this behavioral manipulation is unknown, but parasites cysts to disturb dopamine metabolism has been suggested as one of the most appealing causes30. A previous study showed that infection of mice by T. gondii caused a 14% increase in whole-brain dopamine levels upon establishment of chronic infection31. In agreement with this finding our study showed a increased level of serum DA in the infected mice compared to the controls only at 21 DPI (Fig. 4C), around the beginning of the chronic infection32. This time-dependent differential expression of DA may explain the link between abnormal behavioral alterations and T. gondii infection.
A clear metabolites’ separation has been observed not only between infected mice and the corresponding controls, but also between different infected mouse groups throughout the course of the infection (Fig. 6). The alterations in the serum metabolic profile of T. gondii-infected mice paralleled the clinical course of the disease, where the significant changes in metabolites were detected in infected mice at 7 DPI, followed by restoration of the metabolic profile to a normal level as infection proceeds to the chronic stage, indicating a re-balance of the disturbed metabolic state coinciding with regaining apparently normal physical status.
Previous applications of LC-MS based unbiased metabolomic technologies has enabled researchers to identify biomarkers for various diseases, such as cancer33,34 and other types of disease35,36, and to investigate host-parasite interaction and metabolic alterations in trypanosomiasis, schistosomiasis and malaria in a high-throughput manner37,38,39. In agreement with previous studies, our results demonstrated the power of the untargeted LC-MS-based metabolomic’s approach in profiling the metabolic changes in serum from T. gondii-infected mice. We identified 19 infection-specific metabolites, 5 in ESI+ mode and 14 in ESI- mode, in the serum samples. PCA models and heat maps constructed based on those selected metabolites showed reasonable separations between infected and control groups. ROC analysis supported the robustness of the PCA models by cross validation, in which all ROC value were high. Among these compounds, the 5 detected in ESI+ mode, including kynurenine, serotonin, glycerophosphocholine and choline and N-Acetyl-DL-tryptophan, showed higher sensitivity and specificity (Fig. 8). These compounds play critical roles in mediating host-pathogen interaction as described above. Most of the metabolites identified in ESI- mode decreased in the infected group, including oleic acid, eicosapentaenoic acid, arachidonic acid (the main precursor of eicosanoid hormones), HOME, N-Acetyl-DL-tryptophan, fumaric acid, citric acid, glutathione, malic acid and cytidine, probably due to the increased metabolomic demands during infection. Overall, these findings provide insight into the pathophysiology of T. gondii infection and have the potential to improve toxoplasmosis diagnosis and management.
Methods
Ethics statement
All animal procedures were approved by Animal Ethics Committee of Lanzhou Veterinary Research Institute, Chinese Academy of Agricultural Sciences (Permit No. LVRIAEC2014-002). All experiments were performed in strict compliance with the requirements of the Animal Ethics Procedures and Guidelines of the People’s Republic of China.
Mice
Female BALB/c mice were purchased from Lanzhou University, China. All mice were bred and maintained under specific-pathogen-free (SPF) conditions in the experimental facility at Lanzhou University, where they received sterilized food and water ad libitum. All mice were kept in a temperature-controlled room (22 ± 0.5 °C) on reverse 12/12 h light/dark cycle. Mice were acclimated for about seven days prior to the start of the experiment and were weighed (weight >20 g) to establish a baseline for detecting any reduction in body weight caused by infection.
Parasite strain, its maintainance, and mouse infection
Toxoplasma gondii type II Prugniuad (Pru) strain was maintained in mice via oral inoculation of cysts in mice. Cysts used in this study were isolated from brain tissues of infected BALB/c mice 40 days post-infection (DPI). Following anesthetizing animals, the brains of infected mice were removed and homogenized under sterile conditions. Then, the number of cysts was counted and diluted to 100 cysts/ml in phosphate buffered saline solution (PBS, pH7.2). Mice (6–8 weeks old) were infected with freshly prepared 10 cysts of T. gondii Pru strain by oral gavage. Mock-infected (control) mice underwent the identical infection protocol but with plain PBS without any parasite cysts. All mice were monitored for mortality and morbidity throughout the course of infection (i.e. 21 DPI).
Confirmation of infection
Following anesthetizing animals, 6 mice from infected or control groups were sacrificed at 7, 14 and 21 DPI. Mice tissues, such as brain, blood, liver, spleen, lung, small intestine and kidney were collected and examined for the presence of T. gondii. Briefly, genomic DNA was extracted from these tissues using TIANamp Genomic DNA kit (TianGen™, Beijing, China) according to the manufacturer’s instructions. Then, a PCR targeting the T. gondii B1 gene was performed to detect infection using the specific primers (5′-AAC GGG CGA GTA GCA CCT GAG GAG-3′ and 5′-TGG GTC TAC GTC GAT GGC ATG ACA AC-3′)40. Positive control (DNA from parasites) and negative control (PBS) samples were included in each test. Infection was also confirmed by histopathological examination of brain and spleen collected from the mice after euthanasia. Tissue samples were fixed in 10% neutral buffered formalin solution for 2 weeks and then were dehydrated by gradually soaking in alcohol and xylene and embedded in paraffin. The paraffin-embedded specimens were cut into 5-μm sections, stained with hematoxylin-eosin (H&E), and examined under a digital optical microscope (Olympus, Tokyo, Japan).
Non-targeted metabolic profiling and spectral acquisition
The blood samples from different infection groups (7d, n = 6; 14d, n = 6; 21d, n = 6) and their corresponding control groups (n = 6) were prepared as described previously41. Blood was collected by retro-orbital bleed into Eppendorf tubes directly and allowed to clot for 30 min followed by centrifugation at 3000 g for 10 minutes at 4 °C to collect the serum fraction. Supernatants were frozen immediately at −80 °C and shipped on dry ice. A total of 100 μl serum sample was thawed on ice at 4 °C and then precipitated by a solvent of acetonitrile-water (7:3), treated with ultrasonic wave for 15 min. The mixture was centrifuged at 12,000 rpm for 15 min at 4 °C and then the supernatant was transferred to 1.5 ml polypropylene tube.
Metabolomic analysis was performed using an Agilent 1290 Infinity LC System coupled to an Agilent 6530 Q-TOF/MS (Agilent Corp.) (LC-Q/TOF-MS) equipped with an electrospray ionization (ESI) source. The separation of all samples was performed on a C18 column (Agilent Technologies, Santa, Clara, CA) (dimension 100 × 2.1 mm, 1.8 μm particle size, 100 Å pore size) with the column temperature maintained at 40 °C. The LC-MS system was run in a binary gradient solvent mode consisting of 0.1% (v/v) formic acid in water (solvent A) and 0.1% formic acid in acetonitrile (solvent B) and the flow rate was 0.4 ml/min. The linear gradient is described in Table 3.
Table 3. The gradient of mobile phase.
| Time(min) | Flow rate (mL/min) | A (%) | B (%) |
|---|---|---|---|
| 0 | 0.4 | 95 | 5 |
| 2 | 0.4 | 95 | 5 |
| 17 | 0.4 | 5 | 95 |
| 19 | 0.4 | 5 | 95 |
The sample injection volume was 4 μl. Sample analysis was carried out in both positive and negative ion modes. The mass scanning range was 50−1000 m/z. Nitrogen was used as the dry gas and cone gas with parameters described in Table 4. The mass spectrometry was operated in V optics mode and the data acquisition rate was set to 0.03 s, with interscan delay of 0.02 s. To ensure accuracy and reproducibility, LockSpray was used in all analyses and Leucine-enkephalin was selected as the lockmass for positive ([MH]+ = 556.2771) and negative ([MH]− = 554.2615) ion modes.
Table 4. Mass spectrometry parameters.
| Positive ion mode | Negative ion mode | |
|---|---|---|
| Capillary voltage | 4 kV | 3.4 kV |
| Sampling cone | 35 kV | 50 kV |
| Source temperature | 100 °C | 100 °C |
| Desolvation temprature | 350 °C | 300 °C |
| Cone gas flow | 50 L/h | 50 L/h |
| Desolvation gas flow | 600 L/h | 700 L/h |
| Extraction cone | 4 V | 4 V |
We used Quality control (QC) samples to assess the reproducibility and reliability of the LC-MS system. QC samples were prepared by mixing equal volumes (10 μl) from each serum sample as they were aliquoted for analysis. This “pooled” sample was used to provide a “mean” profile representing all the analytes encountered during the analysis42. The pooled “QC” sample was injected five times at the beginning of the run to ensure system equilibrium and then every 6 samples to further monitor the stability of the analysis43.
Data processing and statistics
Raw data were acquired by using LC-MS-Q-TOF MassHunter Workstation QTOF Acquisition software (B.03.01) (Agilent Technologies, Santa Clara, CA, USA) in an untargeted mode. LC-MS raw data file was converted into common format, and then directly processed by the XCMS toolbox (http://metlin.scripps.edu/xcms/)44. Peak picking, peak grouping and retention time correction were all involved in data pre-treatment, which was done through the XCMS software that was implemented with the freely available R programming language (v 2.13.1). Retention time (RT)-m/z data pairs were used to identify ion intensities of those detected peaks. The consistent variables (ion intensity information) were obtained by filtering peaks with 80% missing values and those with isotope ions from each group.
In order to remove the offsets and adjust the importance of high and low abundance metabolites to an equal level, the data was pre-processed by both mean-centering and variance-scaling prior to multivariate analysis. Then, the resulting three-dimensional matrix, which includes assigned peak indices (retention time-m/z pairs), sample names and variables, was further subjected to multivariate data analysis.
The resulting scaled datasets were imported into SIMCA-P + 11.0 (Umetrics, Umea, Sweden) where multivariate analyses such as principal components analysis (PCA) and orthogonal partial least-squares-discriminant analysis (OPLS-DA) were carried out to investigate and visualize the pattern of metabolite changes in an un-supervised and supervised manner, respectively. PCA was used to validate quality of the analytical system performance and to observe possible outliers. OPLS-DA was applied to obtain an overview of the complete data set and discriminate the variables that are responsible for variation between the groups. The quality of the models was evaluated with the relevant R2 and Q2 as well discussed elsewhere45. The differential metabolites were selected when the statistically significant threshold of variable influence on projection (VIP) values obtained from the OPLS-DA model was larger than 1.0. Meanwhile, the p values from a two-tailed Student’s t-test on the normalized peak areas were less than 0.0546. Log 2 fold change (FC) was used to show how these selected differential metabolites varied between groups. The dataset of selected differential metabolites was imported into MetaboloAnalyst 3.0 for heatmap generation and multivariate statistics. The areas (AUC) under the receiver operating characteristic curves (ROC) were constructed to evaluate the effectiveness of potential biomarkers. Results were considered significant when p value is less than 0.05.
Putative metabolites were first derived by searching the exact molecular mass data from redundant m/z peaks against the online HMDB (http://www.hmdb.ca/), METLIN (http://metlin.scripps.edu/) and KEGG (www.genome.jp/kegg/) databases. A specific metabolite was sieved out when a match with a difference between observed and theoretical mass was less than 10 ppm. Then, the metabolite molecular formula of matched metabolites was further identified by the isotopic distribution measurement47.
Additional Information
How to cite this article: Zhou, C.-X. et al. Metabolomic Profiling of Mice Serum during Toxoplasmosis Progression Using Liquid Chromatography-Mass Spectrometry. Sci. Rep. 6, 19557; doi: 10.1038/srep19557 (2016).
Supplementary Material
Acknowledgments
Project support was provided by the National Natural Science Foundation of China (Grant No. 31230073) to X.Q.Z. We thank BGI-Shenzhen for technical assistance.
Footnotes
Author Contributions X.Q.Z. and X.S. designed the research. C.X.Z., D.H.Z. and Y.Z. performed the research. D.H.Z. and H.M.E. contributed reagents/materials/analyses. C.X.Z. analyzed the data. C.X.Z., H.M.E. and X.Q.Z. wrote the paper.
References
- Weiss L. M. & Dubey J. P. Toxoplasmosis: A history of clinical observations. Int. J. Parasitol. 39, 895–901 (2009). [DOI] [PMC free article] [PubMed] [Google Scholar]
- Jones J. L., Kruszon-Moran D., Sanders-Lewis K. & Wilson M. Toxoplasma gondii infection in the United States, 1999–2004, decline from the prior decade. Am. J. Trop. Med. Hyg. 77, 405–410 (2007). [PubMed] [Google Scholar]
- Grigg M. E., Ganatra J., Boothroyd J. C. & Margolis T. P. Unusual abundance of atypical strains associated with human ocular toxoplasmosis. J. Infect. Dis. 184, 633–639 (2001). [DOI] [PubMed] [Google Scholar]
- Dubey J. History of the discovery of the life cycle of Toxoplasma gondii. Int. J. Parasitol. 39, 877–882 (2009). [DOI] [PubMed] [Google Scholar]
- Howe D. K. & Sibley L. D. Toxoplasma gondii comprises three clonal lineages: correlation of parasite genotype with human disease. J. Infect. Dis. 172, 1561–1566 (1995). [DOI] [PubMed] [Google Scholar]
- Yarovinsky F. Innate immunity to Toxoplasma gondii infection. Nat. Rev. Immunol. 14, 109–121 (2014). [DOI] [PubMed] [Google Scholar]
- Kafsack B. F. & Llinás M. Eating at the table of another: metabolomics of host-parasite interactions. Cell Host Microbe 7, 90–99 (2010). [DOI] [PMC free article] [PubMed] [Google Scholar]
- Zhou C. X. et al. Global metabolomic profiling of mice brains following experimental infection with the cyst-Forming Toxoplasma gondii. PLoS One 10, e0139635 (2015). [DOI] [PMC free article] [PubMed] [Google Scholar]
- Laliberte J. & Carruthers V. B. Host cell manipulation by the human pathogen Toxoplasma gondii. Cell. Mol. Life Sci. 65, 1900–1915 (2008). [DOI] [PMC free article] [PubMed] [Google Scholar]
- Tymoshenko S. et al. Metabolic needs and capabilities of Toxoplasma gondii through combined computational and experimental analysis. PLoS Comput. Biol. 11, e1004261 (2015). [DOI] [PMC free article] [PubMed] [Google Scholar]
- Leroux L.-P. et al. Parasite manipulation of the invariant chain (Ii/CD74) and the peptide editor H2-DM affects MHC-II antigen presentation during Toxoplasma gondii infection. Infect. Immun. 83, 3865–3880 (2015). [DOI] [PMC free article] [PubMed] [Google Scholar]
- Lagal V. et al. AMA1-deficient Toxoplasma gondii parasites transiently colonize mice and trigger an innate immune response that leads to long-lasting protective immunity. Infect. Immun. 83, 2475–2486 (2015). [DOI] [PMC free article] [PubMed] [Google Scholar]
- Nelson M. et al. Modulation of the host cell proteome by the intracellular apicomplexan parasite Toxoplasma gondii. Infect. Immun. 76, 828–844 (2008). [DOI] [PMC free article] [PubMed] [Google Scholar]
- Pittman K. J., Aliota M. T. & Knoll L. J. Dual transcriptional profiling of mice and Toxoplasma gondii during acute and chronic infection. BMC Genomics 15, 806 (2014). [DOI] [PMC free article] [PubMed] [Google Scholar]
- Kupferschmidt O. et al. Quantitative detection of Toxoplasma gondii DNA in human body fluids by TaqMan polymerase chain reaction. Clin. Microbiol. Infect. 7, 120–124 (2001). [DOI] [PubMed] [Google Scholar]
- Arantes T. P. et al. Toxoplasma gondii: Evidence for the transmission by semen in dogs. Exp. Parasitol. 123, 190–194 (2009). [DOI] [PubMed] [Google Scholar]
- Olszewski K. L. et al. Host-parasite interactions revealed by Plasmodium falciparum metabolomics. Cell Host Microbe 5, 191–199 (2009). [DOI] [PMC free article] [PubMed] [Google Scholar]
- Zhou B., Xiao J. F., Tuli L. & Ressom H. W. LC-MS-based metabolomics. Mol. Biosyst. 8, 470–481 (2012). [DOI] [PMC free article] [PubMed] [Google Scholar]
- Theodoridis G., Gika H. G. & Wilson I. D. LC-MS-based methodology for global metabolite profiling in metabonomics/metabolomics. TrAC Trend. Anal. Chem. 27, 251–260 (2008). [Google Scholar]
- Naz S., Vallejo M., García A. & Barbas C. Method validation strategies involved in non-targeted metabolomics. J. Chromatogr. A 1353, 99–105 (2014). [DOI] [PubMed] [Google Scholar]
- Xia J., Sinelnikov I. V., Han B. & Wishart D. S. MetaboAnalyst 3.0-making metabolomics more meaningful. Nucleic Acids Res. 43, W251–257 (2015). [DOI] [PMC free article] [PubMed] [Google Scholar]
- Zhang W., Li F. & Nie L. Integrating multiple ‘omics’ analysis for microbial biology: application and methodologies. Microbiology 156, 287–301 (2010). [DOI] [PubMed] [Google Scholar]
- Henderson J. F. & Paterson A. R. P. Nucleotide metabolism: an introduction. (Academic Press, 2014). [Google Scholar]
- Mathis D. & Shoelson S. E. Immunometabolism: an emerging frontier. Nat. Rev. Immunol. 11, 81–83 (2011). [DOI] [PMC free article] [PubMed] [Google Scholar]
- Silva N. M. et al. Expression of indoleamine 2, 3-dioxygenase, tryptophan degradation, and kynurenine formation during in vivo infection with Toxoplasma gondii: induction by endogenous gamma interferon and requirement of interferon regulatory factor 1. Infect. Immun. 70, 859–868 (2002). [DOI] [PMC free article] [PubMed] [Google Scholar]
- Leonard B. & Maes M. Mechanistic explanations how cell-mediated immune activation, inflammation and oxidative and nitrosative stress pathways and their sequels and concomitants play a role in the pathophysiology of unipolar depression. Neurosci. Biobehav. Rev. 36, 764–785 (2012). [DOI] [PubMed] [Google Scholar]
- Dantzer R., O’Connor J. C., Lawson M. A. & Kelley K. W. Inflammation-associated depression: from serotonin to kynurenine. Psychoneuroendocrinology 36, 426–436 (2011). [DOI] [PMC free article] [PubMed] [Google Scholar]
- Wonodi I. & Schwarcz R. Cortical kynurenine pathway metabolism: a novel target for cognitive enhancement in schizophrenia. Schizophr. Bull. 36, 211–218 (2010). [DOI] [PMC free article] [PubMed] [Google Scholar]
- Cai X. et al. Local potentiation of excitatory synapses by serotonin and its alteration in rodent models of depression. Nat. Neurosci. 16, 464–472 (2013). [DOI] [PMC free article] [PubMed] [Google Scholar]
- Prandovszky E. et al. The neurotropic parasite Toxoplasma gondii increases dopamine metabolism. PLoS One 6, e23866 (2011). [DOI] [PMC free article] [PubMed] [Google Scholar]
- Stibbs H. Changes in brain concentrations of catecholamines and indoleamines in Toxoplasma gondii infected mice. Ann. Trop. Med. Parasitol. 79, 153–157 (1985). [DOI] [PubMed] [Google Scholar]
- Ferguson D. & Hutchison W. An ultrastructural study of the early development and tissue cyst formation of Toxoplasma gondii in the brains of mice. Parasitol. Res. 73, 483–491 (1987). [DOI] [PubMed] [Google Scholar]
- Xiao J. F. et al. LC–MS based serum metabolomics for identification of hepatocellular carcinoma biomarkers in Egyptian cohort. J. Proteome Res. 11, 5914–5923 (2012). [DOI] [PMC free article] [PubMed] [Google Scholar]
- Peng J., Chen Y. T., Chen C. L. & Li L. Development of a universal metabolome-standard method for long-term LC–MS metabolome profiling and its application for bladder cancer urine-metabolite-biomarker discovery. Anal. Chem. 86, 6540–6547 (2014). [DOI] [PubMed] [Google Scholar]
- Huybrechts B., Martins J., Debongnie P., Uhlig S. & Callebaut A. Fast and sensitive LC-MS/MS method measuring human mycotoxin exposure using biomarkers in urine. Arch. Toxicol. 89, 1993–2005 (2014). [DOI] [PubMed] [Google Scholar]
- Xu D. D. et al. Discovery and identification of serum potential biomarkers for pulmonary tuberculosis using iTRAQ-coupled two-dimensional LC-MS/MS. Proteomics 14, 322–331 (2014). [DOI] [PubMed] [Google Scholar]
- Li J. V. et al. Metabonomic investigation of single and multiple strain Trypanosoma brucei brucei infections. Am. J. Trop. Med. Hyg. 84, 91–98 (2011). [DOI] [PMC free article] [PubMed] [Google Scholar]
- Balog C. I. et al. Metabonomic investigation of human Schistosoma mansoni infection. Mol. Biosyst. 7, 1473–1480 (2011). [DOI] [PubMed] [Google Scholar]
- Lakshmanan V. et al. Metabolomic analysis of patient plasma yields evidence of plant-like α-linolenic acid metabolism in Plasmodium falciparum. J. Infect. Dis. 206, 238–248 (2012). [DOI] [PMC free article] [PubMed] [Google Scholar]
- Hill D. E., Chirukandoth S., Dubey J., Lunney J. K. & Gamble H. Comparison of detection methods for Toxoplasma gondii in naturally and experimentally infected swine. Vet. Parasitol. 141, 9–17 (2006). [DOI] [PubMed] [Google Scholar]
- Wikoff W. R. et al. Metabolomics analysis reveals large effects of gut microflora on mammalian blood metabolites. Proc. Natl. Acad. Sci. USA. 106, 3698–3703 (2009). [DOI] [PMC free article] [PubMed] [Google Scholar]
- Zelena E. et al. Development of a robust and repeatable UPLC-MS method for the long-term metabolomic study of human serum. Anal. Chem. 81, 1357–1364 (2009). [DOI] [PubMed] [Google Scholar]
- Luan H. et al. Pregnancy-induced metabolic phenotype variations in maternal plasma. J. Proteome Res. 13, 1527–1536 (2014). [DOI] [PubMed] [Google Scholar]
- Smith C. A., Want E. J., O’Maille G., Abagyan R. & Siuzdak G. XCMS: processing mass spectrometry data for metabolite profiling using nonlinear peak alignment, matching, and identification. Anal. Chem. 78, 779–787 (2006). [DOI] [PubMed] [Google Scholar]
- Guo L. et al. Three plasma metabolite signatures for diagnosing high altitude pulmonary edema. Sci. Rep. 5, 15126; 10.1038/srep15126 (2015). [DOI] [PMC free article] [PubMed] [Google Scholar]
- Wiklund S. et al. Visualization of GC/TOF-MS-based metabolomics data for identification of biochemically interesting compounds using OPLS class models. Anal. Chem. 80, 115–122 (2008). [DOI] [PubMed] [Google Scholar]
- Xu Y. et al. Evaluation of accurate mass and relative isotopic abundance measurements in the LTQ-orbitrap mass spectrometer for further metabolomics database building. Anal. Chem. 82, 5490–5501 (2010). [DOI] [PubMed] [Google Scholar]
Associated Data
This section collects any data citations, data availability statements, or supplementary materials included in this article.


