Abstract
In metabolomics, a large number of small molecules can be detected in a single run. However, metabolomic data do not include the absolute concentrations of each metabolite. Generally, mass spectrometry analyses provide metabolite concentrations that are derived from mass peak intensities, and the peak intensities are strictly dependent on the type of mass spectrometer used, as well as the technical characteristics, options and protocols applied. To convert mass peak intensities to actual concentrations, calibration curves have to be generated for each metabolite, and this represents a significant challenge depending on the number of metabolites that are detected and involved in metabolome-based diagnostics. To overcome this limitation, and to facilitate the development of diagnostic tests based on metabolomics, mass peak intensities may be expressed in quintiles. The present study demonstrates the advantage of this approach. The examples of diagnostic signatures, which were designed in accordance to this approach, are provided for lung and prostate cancer (leading causes of mortality due to cancer in developed countries) and impaired glucose tolerance (which precedes type 2 diabetes, the most common endocrinology disease worldwide).
Keywords: metabolome, blood plasma, mass spectrometry, direct infusion, metabolic signature, diagnostics, quintile
Introduction
In metabolomics, a large number of small molecules (metabolites) can be detected in a single sample. In the case of bodily fluid samples, this capacity provides a significant potential for diagnostics (1). Correspondingly, the diagnostic capacity of blood plasma metabolome analyses has been confirmed in previous studies (2). The accumulation of diagnostic power from numerous metabolites also facilitates the development of powerful diagnostic tests. However, -omics sciences, including metabolomics, generally do not express the concentration of the detected substances in absolute values. For example, in the analysis of blood plasma samples, mass peak intensities are determined, and these are derived from the concentration of each metabolite in the plasma. In addition, these mass peak intensities are expressed in units which depend on the type, model and settings of the mass spectrometer used, as well as detector consumption, purity of the solutions used, the operating state of the ion source and ion transferring system, and the exact pH value of the samples. Therefore, fingerprints, patterns, barcodes and signatures, which have been successfully used in numerous metabolomic ‘case-control’ studies, are unsuitable for laboratory diagnostics. Furthermore, in ‘case-control’ studies, the samples are typically analyzed under the same conditions and are compared with each other. This avoids the requirement for determining the absolute concentrations of the metabolites involved. To convert mass peak intensities to actual concentrations, calibration curves have to be generated for each metabolite, and this represents a significant challenge depending on the number of metabolites that are detected.
Another consideration is the multivariable nature of any -omics dataset. Generally, metabolomic profiles consist of several variables that require conversion into one diagnostic score, and there are a number of ways to accomplish this (3). Diagnostics-related metabolomics studies, which are usually designed as ‘case-control’ studies, involve data processing (such as normalization, dimensionality reduction and sample classification), which is unsuitable for the use of metabolomic analysis as a laboratory diagnostic procedure.
The aim of the present study was to determine a way to overcome some of the aforementioned problems facing the development of metabolomics-based clinical tests. A direct infusion mass spectrometry (DIMS) approach is described for implementing an omics-based test. This approach is characterized by a single-stage data-retrieval procedure, which may serve as a prototype for clinical analyses. DIMS is the simplest metabolomics method that can express the diagnostic power of a metabolome in a metabolomic signature, and the disease-associated peak intensities can be expressed in calibration curve-independent units.
Materials and methods
Mass spectra datasets
The mass spectra datasets used in the study were obtained in previous metabolomics ‘case-control’ studies of stage II prostate cancer (4), stages I–IV lung cancer (5,6), and impaired glucose tolerance (IGT) (7). All the studies were approved by the ethical review committee. All the participants provided written informed consent for use of their blood samples for research purposes. In these studies, blood plasma samples from 30 control subjects and 40 patients with prostate cancer, 100 control subjects and 100 patients with lung cancer, and 30 control subjects and 20 patients with IGT were used to establish metabolomic signatures for each disease state. Briefly, venous blood samples were collected for mass spectrometry analysis prior to the morning meal of the patient and these were placed into individual glass tubes containing K2EDTA. These tubes were subsequently centrifuged at 1,600 × g for 15 min at room temperature. The resulting blood plasma samples were deproteinized with a mixture of water and methanol (1:1:8). After 15 min, the samples were centrifuged at 13,000 × g for 10 min. The resulting deproteinized supernatants were mixed with methanol containing 0.1% formic acid and each sample was subjected to mass spectrometry analysis by a hybrid quadrupole time-of-flight mass spectrometer (maXis or micrOTOF-Q, Bruker Daltonics, Billerica, MA, USA) equipped with an electrospray ionization (ESI) source. The mass spectrometer was set up to prioritize the detection of low molecular weight ions with a mass accuracy of 1–3 parts per million. Spectra were recorded in the positive ion charge detection mode. Ion metabolite masses were determined from the mass spectrum peaks obtained using the Data Analysis program. All the peaks above noise level (signal-to-noise ratio >1) were selected, and the metabolite ion masses were aligned (5).
To confirm the use of metabolomic signatures obtained with different mass spectrometers and the expression of data in quantiles, the threshold values of the lung cancer signature expressed in peak intensities were converted into quintiles using two nonintersecting sets (50 and 50) of the control samples. Two sets of quintiles were obtained and compared with each other.
All the calculations were performed using Matlab software (MathWorks, Natick, MA, USA).
Metabolomic signatures and diagnostic scoring
Metabolomic signatures were established using a list of ion masses strictly associated with each disease state [such as ions with an area under the curve (AUC) value >0.8, which exhibited an increase in concentration with prostate and lung cancers, and ions with an AUC value >0.7, which exhibited an increase in concentration with IGT, as well as ions with an AUC value >0.76, which exhibited a decrease in concentration with IGT]. For each metabolite ion, the threshold mass peak intensity was defined in order to separate positive and negative results for each disease. These threshold values were subsequently expressed in quintiles that were defined based on the control set of mass spectra. To define the threshold values that optimally separated positive and negative results for single metabolite ions in a signature and to obtain a final diagnostic score, receiver operating characteristic (ROC) curves were generated using the rocplot function of the Matlab program. If the intensity of a mass peak with a mass-to-charge (m/z) value of X was higher than that of Y quintiles for a disease state, the XY value was included in the signature. For metabolite ions that expressed a lower intensity m/z value for a disease state, these ion masses were underlined in the signature. For metabolite concentrations that were near the limit-of-detection, and therefore, potentially did not exhibit a valid distribution in the mass spectral data, these ions were not included in the signatures. Metabolite ions included in the metabolomic signatures were also subjected to diagnostic score calculations, and the diagnostic score represents the number of positive results (such as peak intensities that exceeded the threshold value) that were obtained for the peaks included in a signature.
Results and Discussion
Using DIMS
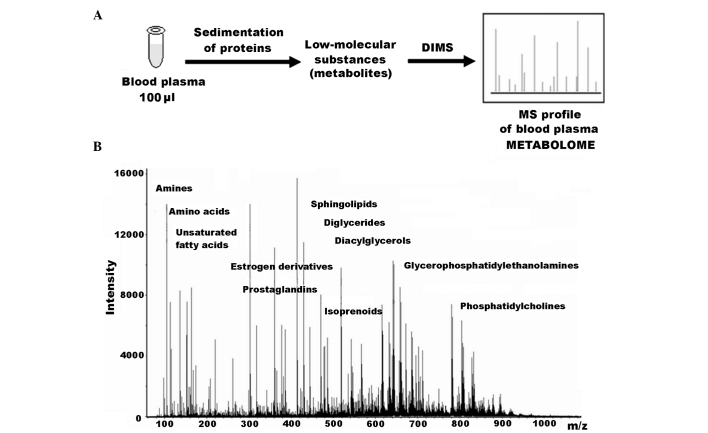
Numerous diagnostics-related metabolomics studies have employed DIMS (4–7), and it appears to be a method which can be optimized for metabolomics-based clinical tests. One particular advantage is that this method allows biological materials to be directly applied to the ionization source of a mass spectrometer without any preliminary separation steps (8,9). Consequently, a metabolome can be characterized without additional distortion being introduced into the samples as a result of separation methods. Thus, the mass spectrum obtained is directly representative of the sample's metabolome (Fig. 1). Additionally, DIMS provides an opportunity to compare mass spectrometric metabolic profiles obtained for the same type of sample in different laboratories, and this is a key requirement for implementing any omics-based testing in the clinic.
Figure 1.
Metabolome profiling of blood plasma by direct infusion mass spectrometry (DIMS). (A) Workflow for obtaining MS metabolome profile of blood plasma by DIMS. (B) Typical mass spectrum of human plasma metabolites. The mass spectrum was obtained following the direct injection of a deproteinized blood plasma sample into an electrospray ion source of a hybrid quadrupole time-of-flight mass spectrometer.
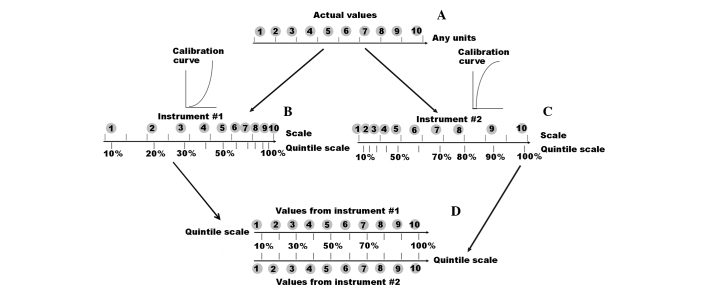
To be used in the field of medicine, DIMS data processing needs to provide a metabolomic signature that includes a set of variables, expressed with quintiles, which are indicative of a specific disease pattern. Within this system, if one variable is higher than another, then this difference is detected. Additionally, when the variables are assigned a range according to their values, this order is preserved independent of the instrument used (i.e. the order of variables cannot be changed). The latter point is the basis for establishing a metabolomic signature for diagnostics that can be adapted for different mass spectrometers. Quintiles are often used to set cut-off points for a given dataset. For example, a 0.3 quintile defines a threshold that separates 30% of the lower variables from the others, and this set of variables, as well as the other sets that are separated by quintiles, are non-alterable and independent of the measuring instrument used. Therefore, we propose that signatures should consist of m/z values for mass peaks, the intensities of the peaks involved should be associated with a particular disease state, the threshold values for the peaks should be expressed in quintiles, and the absolute values of the intensities for each peak should not be used (Fig. 2). As a result, the signature obtained would not depend on the conditions selected for each mass spectrometry analysis that is performed. Furthermore, a translation signature based on the mean of summation of a signature's metabolite ions (whose intensities surpass the established threshold values) represents a simple mathematical procedure, which would be suitable for laboratory diagnostics.
Figure 2.
Calibration curve-independent data presentation. (A) Any variable has an order of their actual values, and this order should be preserved independently from the instrument used. (B and C) Measurement instruments reflect these actual values in their own scale. Translation of these values into actual values is possible by means of calibration curve. (D) However, if a quintile-based scale is used, it allows presenting variable values in a calibration curve-independent manner that should overcome the main bottle-neck of omics-based tests.
In the sections that follow, diagnostic signatures are provided for lung cancer, prostate cancer (leading causes of fatality due to cancer in developed countries), and IGT (which precedes type 2 diabetes, the most common endocrinology disease worldwide).
Metabolomic signature for prostate cancer, m/zquintile: 300.220.96; 302.240.96; 303.241.00; 304.260.95; 305.260.95; 306.261.00; 318.230.93; 320.251.00; 321.240.88; 322.250.93; 330.260.88; 334.230.96; 336.240.88; 357.230.93
The accuracy for diagnosing stage II prostate cancer (adenocarcinoma) based on this signature was found to be 96% (specificity, 100%; sensitivity, 97%; AUC, 1.00). A diagnostic score of 7 units was identified as the threshold value for distinguishing a cancer versus a normal state.
Metabolomic signature for lung cancer, m/zquintile: 151.0750.87; 153.0240.92; 210.9350.70; 268.8910.64; 270.8880.87; 278.0880.76; 391.0860.80; 477.0870.81; 478.0910.86; 479.0850.74; 480.0890.63; 481.0910.73
The accuracy for diagnosing stage I–IV lung cancer based on this signature was found to be 88% (specificity, 99%; sensitivity, 77%; AUC, 0.93). A diagnostic score of 7 units was also identified as the threshold value for distinguishing a cancer versus a normal state.
This signature could also be used for risk assessment of lung cancer. For example, when the diagnostic score of this signature was <7, the odds ratio (OR) was the same in average and the value fluctuated ~30. For diagnostic scores of 8 and 9, the ORs were 217 and 313, respectively. For diagnostic scores ≥10, the ORs were infinity, according to the definition of OR. This unusual association between risk assessment and diagnostics appears to be based on the use of high OR values, which can be obtained using a metabolomic signature. Such high OR values allow one to predict with high probability that a patient already has the disease in question, thereby demonstrating the diagnostic and risk assessment capacity of this approach.
Metabolomic signature of IGT, m/zquintile: 133.0970.57; 135.0390.68; 149.0570.72; 165.0890.71; 175.1450.71; 177.1240.89; 178.9930.85; 181.0840.85; 200.9730.75; 204.9520.77; 211.0040.64; 223.0940.80; 228.9240.72; 239.0140.81; 248.2420.78; 250.0450.71; 256.1550.79; 256.2610.81; 263.0850.88; 272.9430.70; 278.2440.79; 280.2640.92; 282.2790.78; 284.2950.89; 296.2210.78; 297.2280.63; 302.2450.82; 310.8740.80; 312.3270.66; 324.2530.61; 366.8330.77; 367.1190.90; 376.8100.75; 434.8190.82; 494.7730.92; 114.8960.23; 116.8960.16; 122.9250.23; 124.9230.23; 139.9140.16; 152.0460.43; 172.8540.19; 238.8390.29; 248.8680.16; 249.8720.09; 250.8650.33; 256.9810.19; 260.8960.19; 298.7950.23; 304.7400.19; 306.8270.16. The AUC value for a diagnosis of IGT using this signature was 0.93. A diagnostic score of 22 units was identified as the threshold value for distinguishing IGT versus a normal state, and this score was associated with a maximum accuracy value of 90%, a sensitivity value of 90%, and a specificity value of 90% (7).
Stability of using a quintile-based scale
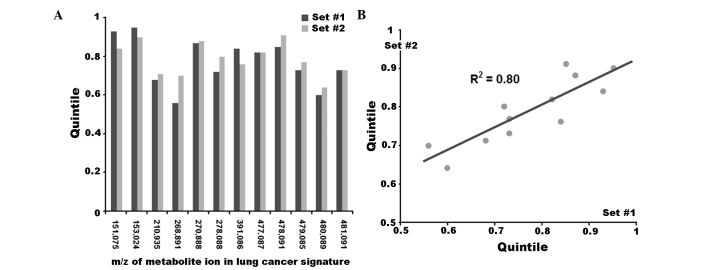
To demonstrate the stability of using a mass peak intensity scale expressed in quintiles, two independent sets of mass spectra should be used to define the scale marks (i.e. 0, 0.1 and 0.2 quintile), and these scale marks should be the same for the two sets. For a more robust demonstration of this approach, threshold values instead of scale marks were included in the lung cancer diagnostic signature in the present study. Thus, threshold values for the peaks of metabolite ions included in the signature were converted to quintiles using two nonintersecting sets of control mass spectra, with each set containing 50 mass spectra. When the quintile values were compared (Fig. 3), the resulting coefficient of determination (R2) for the linear regression was 0.80. This result confirmed the equivalence of the threshold values that were derived from different control sets.
Figure 3.
Stability of the threshold values, expressed in quintiles, which were included in a diagnostic signature of lung cancer. Quintile values were calculated using two nonintersecting sets of control samples. (A) Visual observation. (B) Linear approximation. R2-coefficient of determination for data linear approximation. It indicates that ~90% of the variation in set #2 is explained by the variables in set #1.
Accordingly, it is hypothesized that any set of mass spectra that is obtained for control blood plasma samples could be translated from a quintile-based scale into a peak intensity scale (or vice versa). Additionally, this would validate the use of diagnostic signatures obtained with different mass spectrometers, thereby overcoming the main limitation for using metabolomics in laboratory diagnostics.
Additional considerations for metabolomic signatures
It should be noted that the metabolomic signatures and identification results of the disease-associated metabolites that were determined in previous studies (4,6,7) and were used in the present study did not exactly match each other. This is due to the fact that it is not currently possible to identify all the metabolites in a metabolomic signature, particularly metabolites with low abundance that do not exhibit a clear isotopic pattern in a mass spectrum (thereby not allowing identification). Furthermore, the metabolite interference can potentially disturb the isotopic patterns in a mass spectrum, thereby leading to a situation where the isotope of the first metabolite (i.e. the reference molecular weight of the metabolite in the database) is not included in a metabolomic signature.
An additional consideration is that the diagnostic accuracy of a metabolomic signature may vary according to population. Thus far, the metabolomic signatures obtained have provided disease detection with outstanding accuracy. Such accuracy was achieved with the accumulation of diagnostic power from several metabolites, which were selected from a larger set of metabolites. However, such fitting of a signature may lead to its failure as a diagnostic in other populations. Due to the multivariable nature of metabolomic signatures, however, it is possible that different signatures for the same disease could be used, and this would compensate for the disadvantage of only using a single metabolomic signature. Ideally, this would provide a high diagnostic accuracy in all situations.
Acknowledgements
The present study was supported by the State Academies of Sciences (fundamental research program for 2013–2020) and Russian Academy of Science (grant ‘Metabolomics-based diagnostics of impaired glucose tolerance’).
References
- 1.Trifonova O, Lokhov P, Archakov A. Postgenomics diagnostics: Metabolomics approaches to human blood profiling. OMICS. 2013;17:550–559. doi: 10.1089/omi.2012.0121. [DOI] [PMC free article] [PubMed] [Google Scholar]
- 2.Gowda GA, Zhang S, Gu H, Asiago V, Shanaiah N, Raftery D. Metabolomics-based methods for early disease diagnostics. Expert Rev Mol Diagn. 2008;8:617–633. doi: 10.1586/14737159.8.5.617. [DOI] [PMC free article] [PubMed] [Google Scholar]
- 3.Katajamaa M, Oresic M. Data processing for mass spectrometry-based metabolomics. J Chromatogr A. 2007;1158:318–328. doi: 10.1016/j.chroma.2007.04.021. [DOI] [PubMed] [Google Scholar]
- 4.Lokhov PG, Dashtiev MI, Moshkovskii SA, Archakov AI. Metabolite profiling of blood plasma of patients with prostate cancer. Metabolomics. 2009;6:156–163. doi: 10.1007/s11306-009-0187-x. [DOI] [PubMed] [Google Scholar]
- 5.Lokhov PG, Kharybin ON, Archakov AI. Diagnosis of lung cancer based on direct-infusion electrospray mass spectrometry of blood plasma metabolites. Int J Mass Spectrom. 2012;309:200–205. doi: 10.1016/j.ijms.2011.10.002. [DOI] [Google Scholar]
- 6.Lokhov PG, Trifonova OP, Maslov DL, Archakov AI. Blood plasma metabolites and the risk of developing lung cancer in Russia. Eur J Cancer Prev. 2013;22:335–341. doi: 10.1097/CEJ.0b013e32835b3898. [DOI] [PubMed] [Google Scholar]
- 7.Lokhov PG, Trifonova OP, Maslov DL, Balashova EE, Archakov AI, Shestakova EA, Shestakova MV, Dedov II. Diagnosing impaired glucose tolerance using direct infusion mass spectrometry of blood plasma. PLoS One. 2014;9:e105343. doi: 10.1371/journal.pone.0105343. [DOI] [PMC free article] [PubMed] [Google Scholar]
- 8.Koulman A, Tapper BA, Fraser K, Cao M, Lane GA, Rasmussen S. High-throughput direct-infusion ion trap mass spectrometry: A new method for metabolomics. Rapid Commun Mass Spectrom. 2007;21:421–428. doi: 10.1002/rcm.2854. [DOI] [PubMed] [Google Scholar]
- 9.Lin L, Yu Q, Yan X, Hang W, Zheng J, Xing J, Huang B. Direct infusion mass spectrometry or liquid chromatography mass spectrometry for human metabonomics? A serum metabonomic study of kidney cancer. Analyst. 2010;135:2970–2978. doi: 10.1039/c0an00265h. [DOI] [PubMed] [Google Scholar]


