Abstract
Objective
To assess radiology utilization trends for emergency department (ED) patients from 1993 through 2012.
Methods
In this institutional review board-approved, retrospective study at a 793-bed tertiary care academic medical center, we reviewed radiology utilization from January 1, 1993 through December 31, 2012, during which time the number of ED patient visits increased from 48,000 to 61,000, and determined the number of imaging studies by modality (x-ray, sonography, CT, MRI, other) and associated relative value units (RVUs). We used linear regression to assess for trends in the number of imaging RVUs and imaging accession numbers, our primary and secondary outcomes, respectively.
Results
The total RVUs attributable to ED imaging per thousand ED visits increased 208% from 1993–2007 (p<0.0001) and then decreased 24.7% by 2012 (p<0.0019). The total number of imaging accession numbers per thousand ED visits increased 47.8%from 1993 until 2005(p=0.0003), then decreased 26.9% by 2012 (p<0.0001). CT RVUs per thousand ED visits increased 493% until 2007 (p<0.0001) and then decreased 33% (p<0.0001), MRI RVUs increased 2,475% until 2008 (p<0.0001) and then decreased 20.7% (p<0.032). Ultrasound RVUs increased 75.7% over the study period (p<0.0001) while x-ray RVUs decreased 28.1% (p=0.0009).
Conclusions
Following a period of substantial increase from 1993–2007, volume-adjusted ED imaging RVUs declined from 2007–2012, largely due to decreasing use of CT and MRI. Further studies are needed to determine the causes of this decline, which may include quality improvement activities, advocacy for appropriateness by leadership, concerns regarding radiation exposure and cost, and health IT interventions.
Introduction
The increasing use of imaging in the emergency department (ED) has garnered national attention. A number of studies have suggested that this increase, especially notable in the case of computed tomography (CT)(1,2), has not resulted in improved outcomes despite higher costs(3,4). However, imaging has resulted in improved outcomes for certain diseases(5,6) and these benefits must be weighed against costs and the potential harms of exposure to ionizing radiation(7,8). A number of strategies have been implemented to foster appropriate use of imaging in the ED, including the development of decision rules to define populations of patients for whom imaging is appropriate, clinical decision support at the time of ordering(9,10), and national quality measures for ED imaging(11).
Although a few recent studies have reported a decrease in imaging use(12,13), the preponderance of data, and opinion, asserts a significant and progressive increase, leading policy makers to propose interventions or incentives to reverse the perceived trend(1,2,14,15). These recent studies suggesting decreasing imaging use varied temporally and also had significantly different settings and methodology. Therefore, it is difficult to determine whether their conclusions would apply in a single study population over a longer time period.
Previous reports have described trends in the use of imaging in inpatients(16), but there are no long-term reports of trends in ED imaging. We hypothesized that imaging utilization has increased progressively in the ED over the last two decades and conducted an analysis of imaging use for ED patients from 1993 through 2012 at our institution.
Materials and Methods
Study Setting and Patients
This institutional review board-approved, retrospective observational study was performed at a 793-bed, tertiary and quaternary-care academic medical center. The hospital is an American College of Surgeons verified Level I trauma center. The ED had approximately 48,000 visits in the first year of the study period, increasing to 61,000 in the final year. All adult patients who presented to our ED from January 1, 1993 to December 31, 2012 were included, and we accessed administrative data to determine imaging use in these patients.
Data Collection
Imaging Studies
We collected data regarding imaging use from the institutional radiology information system (RIS; IDXrad v9, General Electric, Burlington, Vermont). Radiology studies were categorized by imaging modality into computed tomography (CT), magnetic resonance imaging (MRI), ultrasonography (US), conventional x-ray (XR), and others (interventional radiology, nuclear medicine, angiography, etc). We excluded studies that were not performed by radiologists, e.g., echocardiography and cardiac catherization. Only completed studies (studies that were performed) were counted, using a single unique examination identifier (accession number) as the unit of counting. All accession numbers that did not correspond to exams (such as those used for contrast injection, reconstruction, consultations, etc…) were removed. Both the total number of accession numbers and the associated global relative value units (RVUs) of each imaging study were recorded. In order to maintain consistency throughout the study period, we retrospectively applied the published RVUs for CY 2012 for each type of imaging study to the data from all 20 years.
Severity and Admission Data
We recorded the total number of patient visits to our ED per year, the median emergency severity index (ESI) per year, and distribution of patient dispositions (inpatient/observation unit admission vs. discharge) per year. We excluded patients who left before being seen or who left without completion of their treatment. The ESI is a validated ED triage algorithm used worldwide(17,18). It categorizes patients into one of five levels, based both on acuity and anticipated resource needs of each patient. Level 1 patients are the most severely ill and require immediate resuscitation for life-threatening illnesses or injuries. Level 2 patients require urgent, resource-rich care, and progressively less resource intensity is required for each level, with the lowest complexity patients designated Level 5. (19) To assess temporal changes in severity of disease of the ED patients, we calculated both the median ESI and also the proportion of ED patients admitted for each year. These data (ESI and admission rate) were only available in our electronic records for the final 10 years of our study (2003–2012).
Assessment of Trends in ED Imaging Utilization
Trends in ED imaging utilization were assessed by calculating the number of imaging study accession numbers per thousand ED visits for each year. Trends in ED imaging RVUs were similarly calculated to measure changes in radiology workload. We also evaluated trends in median ESI and admission rate for the last 10 years of our study (the period for which these data were available). We used linear regression analysis to assess whether time was a significant predictor of the number of imaging accession numbers per thousand ED patient visits. In order to account for ‘code bundling’ (e.g. combining of CT abdomen and pelvis studies when performed together, a Centers for Medicare and Medicaid Services [CMS] coding change in 2011), we also used linear regression to assess trends as measured by RVUs. In both of these, we used imaging utilization (i.e. number of imaging accession numbers per thousand ED patient visits, imaging RVU) as a continuous outcome variable and time (in years) as a continuous predictor variable. In addition, we determined whether median ESI or average admission rate changed over time in order to describe changes in our study population. A two-sided p-value of <0.05 indicated a statistically significant trend. All statistical analyses were performed with Statistical Analysis Software version 9.2 (SAS Institute Inc, Cary, NC).
Results
Patients
The number of annual ED patient-visits increased from 47,635 in 1993 to 60,957 in 2012 (28% increase; p=<0.001) (Figure 1); the median ESI level of 3 remained unchanged (indicating similar severity of illness) from 2003 to 2012 and admission rate increased by an absolute 4.4% from 2003 to 2012 (p=0.004) (Figure 2).
Fig. 1.
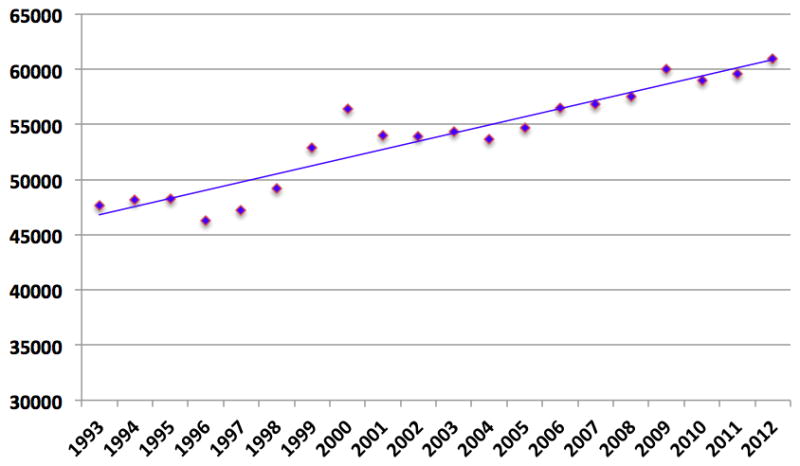
ED Patient Visits from 1993 to 2012
Fig. 2. Trends in ED ESI and Admission Rate from 2003–2012.
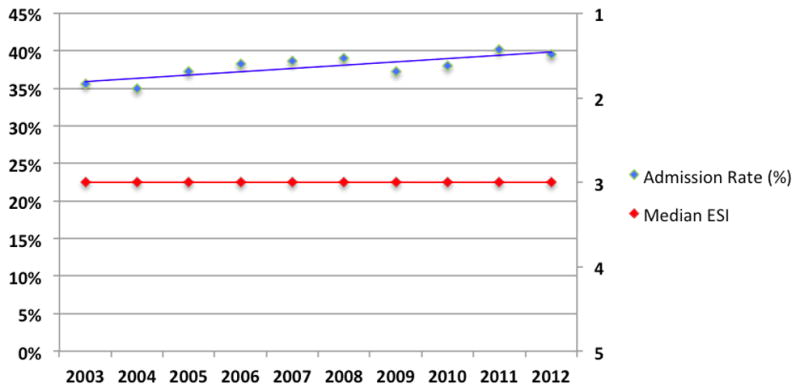
ESI=Emergency Severity Index (1=most severe, 5=least severe)
Imaging Utilization: Total Numbers
During the study period, a total of 1,058,661 imaging studies were performed during 1,077,057 patient visits in our ED (314,604 CTs; 48,791 MRIs; 68,090 US; 601,145 XRs; and 26,031 others). The total imaging RVUs increased 267% from 13,185 in 1993 to a peak of 48,474 in 2007 (beta coefficient: 2840.8, p<0.0001) and then decreased 19.2% to 39,167 (beta coefficient: −1965.2, p<0.0001). The total number of imaging accession numbers rose from 40,959 studies in 1993 to a peak of 68,178studies in 2007 (an increase of 66.5%, beta coefficient: 2588.2, p<0.0001), and then decreased 17.0% to 56,617 studies in 2012 (beta coefficient: −2508.3, p<0.0001). Annualizing from 1993 to 2012, the net effect is equivalent to a 5.6% increase in RVUs per year and a 1.6% increase in accession numbers per year over the 20-year study period, while visits increased at an annualized rate of 1.2%.
Imaging Utilization: Adjusted for ED Patient Visits
After adjusting for annual ED patient visits, overall imaging-related RVUs per thousand ED visits showed a sharp increase from 1993 to 2007, rising 208% from 276.8 per 1000 ED visits in 1993 to 852.8 in 2007 (beta coefficient: 47.3, p<0.0001) (Figure 3). After 2007, imaging-related RVUs per thousand ED visits declined steadily from 852.8 in 2007 to 642.5 in 2012 (a 24.7% decline; beta coefficient: −42.7, p=0.0019). The net effect over the entire study is an annual per-patient increase of 4.3%. Similarly, radiology use as measured by accession number per thousand ED visits increased from 859.9 studies per thousand ED visits in 1993 to 1270.8 in 2005 (a 47.8% increase; beta coefficient: 36.9, p =0.0003) and then declined to 928.8 (a 26.9% decline; beta coefficient: −51.9, p<0.0001). The net effect over the entire study is an annual per-patient increase in imaging accession numbers of 0.39%.
Fig. 3.
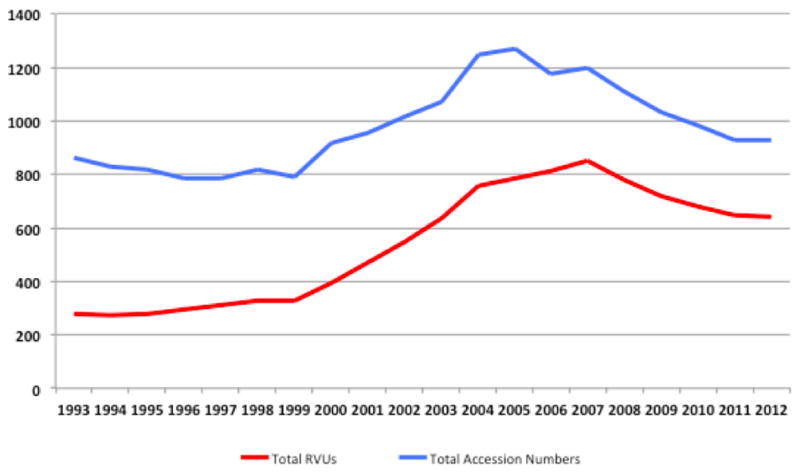
Overall Trends in ED Imaging per 1000 ED Visits by RVU and Accession Number
Imaging Utilization: By Study Modality and Adjusted for ED Patient Visits
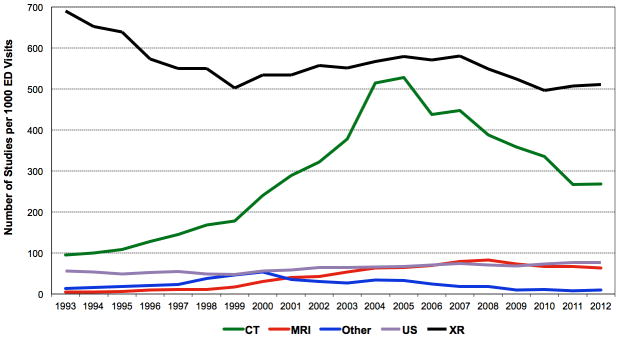
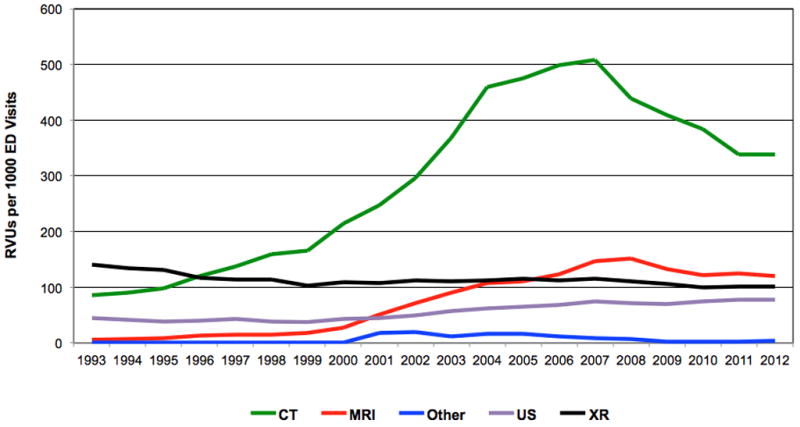
CT RVUs per thousand ED visits increased from 85.8 in 1993 to a peak of 508.6 in 2007 (a 493% increase; beta coefficient: 34.6, p<0.0001), and then declined to 338.8 in 2012 (a 33.4% decrease; beta coefficient: −33.5, p<0.0001, but a net 295% increase over 1993 levels, or 7.1% per year). CT accession numbers per thousand ED visits increased from 94.8 in 1993 to a peak of 527.7 in 2005 (a 457% increase; beta coefficient: 36.7, p<0.0001), and then declined to 268.0 in 2012 (a 49% decrease; beta coefficient: −36.2, p<0.0001, but a net 183% increase over 1993 levels, or 5.3% per year) (Figures 4 and 5).
Fig. 4. Trends in ED Imaging RVUs by Study Modality from 1993 to 2012.
ED = Emergency department
CT = Computed tomography
XR = X-ray
MRI = Magnetic resonance imaging
US = Ultrasonography
Fig. 5. Trends in ED Imaging Accession Numbers by Study Modality from 1993 to 2012.
ED = Emergency department
CT = Computed tomography
XR = X-ray
MRI = Magnetic resonance imaging
US = Ultrasonography
Similarly, MRI RVUs per thousand ED visits increased from 5.9 in 1993 to a peak of 151.9 in 2008 (a 2,475% increase; beta coefficient: 10.8, p<0.0001), and then declined to 120.6 in 2012 (a 20.7% decrease; beta coefficient: −7.1, p<0.0032, but a net 295% increase over 1993 levels, or 16.3% per year). MRI accession numbers per thousand ED visits increased from 4.5 in 1993 to 83.2 in 2008 (a 1,749%increase; beta coefficient: 5.9, p<0.0001), then declined to 63.8 in 2012 (a 23% decline; beta coefficient: −4.5, p=0.026, but a 1,318% increase over 1993 levels, or 14.2% per year).
The use of US per thousand ED visits showed a steady rise over the study period from 44.0 RVUs (and 56.4 accession numbers) in 1993 to 77.3 RVUs (and 76.2 accession numbers) in 2012 (75.7% and 35.1% increases, respectively; beta coefficient: 2.40 and 1.51, respectively, p<0.0001). These corresponded to annualized increases of 2.8% in RVUs and 1.5% in accession numbers.
Conversely, x-ray use per thousand ED visits showed a steady decline over the same time span, decreasing from 141.2 RVUs (and 690.5 accession numbers) in 1993 to 101.5 RVUs (and 510.4 accession numbers) in 2012 (28.1% and 26.1% declines, respectively; beta coefficient: −1.4 and −5.7, respectively, p=0.0009 and p=0.0012 respectively). These corresponded to annualized decreases of 1.6% in RVUs and 1.5% in accession numbers.
Discussion
After over a decade of increasing use by most measures, imaging utilization in the ED decreased for most modalities after 2007, contrary to our hypothesis that imaging utilization would have increased progressively throughout the entire study period. The radiology workload in the ED (as assessed by imaging-related RVUs) rose over 200% over the initial 15 years of the study and then declined 25% between 2007 and 2012. This decrease in imaging is even more significant because it occurred in the context of either stability or an increase in the severity of illness in the ED patient population (as measured by median ESI and by mean admission rate, respectively). The change was most notable for the use of CT and MRI; a 493% increase in CT RVUs and a 2,475% increase in MRI RVUs between 1993–2007 was followed by a 33% decline in CT and a 21% decline in MRI RVUs between 2007–2012. Although the use of US grew steadily 2 decades (RVUs increased 76%), plain film RVUs declined by 28% over the same period. Our findings also suggest that multi-planar imaging modalities (CT, MRI, ultrasound) continue to replace use of plain films in the ED.
Our results, which demonstrate an increasing use of ED imaging from 1993–2007, are similar to those of other studies that report ED imaging data from the same period(1,2). Similarly, the decrease in imaging use after 2007, characterized by a steady decline in CT, MRI, and XR RVUs, is consistent with a recent study of imaging use in pediatric EDs, which found that CT use decreased after 2008 while the use of alternative imaging modalities with less ionizing radiation exposure (specifically abdominal US instead of abdominal CT, and head MRI instead of head CT) increased(13). A 2012 study of imaging utilization nationwide in the Medicare population documented a similar decrease in imaging utilization after 2010(12). Interestingly, in that study, while overall imaging, along with inpatient imaging, hospital outpatient imaging, and private office imaging decreased, ED imaging in the Medicare population continued to increase through 2010. Understanding the reasons why our site-specific results, the first to use consistent methodology throughout a period of two decades demonstrating a decrease in imaging in the ED after a long period of progressive increase, differ from these Medicare data may help inform strategies to optimize the use of imaging in the ED.
One potential explanation for the decline in CT use is the well-publicized potential risk of cancer induced by ionizing radiation. Our observed RVU inflection point was in 2007, the same year that an influential study posited that up to 2% of malignancies in the U.S. could be attributable to ionizing radiation from medical imaging(20). A number of subsequent publications further increased the evidence and the controversy surrounding this assertion(7,8,21). Although it is possible that concern about ionizing radiation exposure contributed to the decline in use of CT it is unlikely to fully explain the decline, as the use of CT for inpatients at our institution continued to rise till 2009 and, in the current study, the use of non-ionizing MRI also declined after 2008(22). Another potential reason for the decline is the significant recent publicity about the cost of CT and MRI imaging, which may have also contributed to the decrease seen for both of these modalities(23). However, were these reasons the only explanations for the decrease in high-cost imaging seen in our study, we would have expected a similar decrease in the nationwide Medicare study discussed earlier; in contrast, ED imaging in that study (unlike imaging from other care settings) continued to increase into 2010(12). Another possible cause for the decline in utilization might have been the various bundling coding changes enacted by CMS. For example, in 2011 the payor required that abdomen and pelvis CTs be coded together when performed together. This effectively decreased the number of accession numbers and may have accounted for the greater apparent decrease in ED imaging utilization seen in 2011 in comparison to prior years, had we relied solely on accession numbers for our calculations. However, the continuing decline of ED imaging RVUs (Figure 3), confirms that the observed decrease in imaging is, in part, due to the decline in utilization of imaging and not simply the result of coding changes.
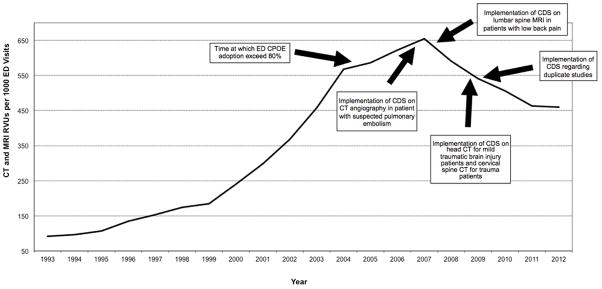
Another possible explanation is the significant focus placed at our institution on decreasing the inappropriate use of high cost imaging (CT and MRI) in our ED. In addition to education efforts, strong leadership endorsement of guideline-adherent imaging practices, the development of a strong Emergency Radiology Division that has fostered increased collaboration in decision making between emergency physicians and emergency radiologists, and regular review of trends in provider-specific imaging use, we have implemented a number of clinical decision support (CDS) tools and interventions into our computerized physician order entry (CPOE; Percipio, Medicalis Corporation, SF, CA) system. The run chart in Figure 6 demonstrates the time points at which specific interventions were introduced in our ED. The radiology CPOE system was introduced in our ED in the fall of 2003. However adoption did not exceed 80% until 2005, when we began to observe a decrease in radiology use. This trend continued in 2007, when we implemented CDS designed to advise providers as to the appropriate use of CT in patients with suspected pulmonary embolism (based on the Wells Criteria) (24). In 2008 we implemented a “duplicate decision support” intervention that informed providers of the presence of prior studies of the same body part with the same imaging modality within the prior 90 days. This intervention was associated with a 5%decline in repeat CT use(25). In 2009, we began importing imaging sent on discs with transferred patients; this led to a decrease of 17% in imaging use in this patient population(26). Additional CDS interventions have targeted guideline-adherent CT use in patients with minor traumatic brain injury and suspected cervical spine fracture, which may have further contributed to our continuing decrease in CT use. In addition to the CDS targeted towards CT appropriateness, CDS aimed at lumbar-spine MRI appropriateness, and attempts to limit repeat use of MRI in 2007, potentially contributed to the decrease in use of that modality seen after 2008.
Fig. 6. Timing of Illustrative Institutional Initiatives to Reduce Inappropriate High Cost Imaging (CT and MRI) in the ED.
CPOE = Computerized physician order entry system
CDS = Clinical decision support
ED = Emergency department
CT = Computed tomography
MRI = Magnetic resonance imaging
Our study has a number of limitations. We only evaluated the use of imaging performed by radiologists, and so we may be underestimating overall use of specific imaging modalities (although the vast majority of imaging in the ED is performed by radiology, a fact that was unchanged over the study period). For example, a number of bedside US examinations in our ED are performed by emergency physicians, and so we have likely underestimated the extent to which US use increased over the course of our study. We limited our study to imaging performed in the ED; some of the decrease might have been due to a deferral of imaging on admitted patients to the inpatient services. However, a study of inpatient imaging use at our institution found a similar decline, making this unlikely (22). In addition, our results are from a single center with over eight years of experience using health IT interventions with CDS targeting inappropriate use of imaging in the ED; it is possible that the implementation of CDS at a new institution might result in less robust initial results. We retrospectively applied the most recent RVUs for each imaging study to data from previous years in the study, which may have underestimated the decline in imaging given a trend in reduction of RVUs; however, this allowed us to establish a consistent scale with which we could assess the trends in radiology workload. Lastly, we could not evaluate any changes in the appropriateness of imaging use, nor could we isolate the factors responsible for the trends observed.
Conclusion
After over a decade of increasing imaging use in the ED, overall imaging RVUs decreased significantly between 2007–2012, in the context of static (as measured by median ESI) or increasing (as measured by admission rate) severity of disease in the ED. Computed tomography, MRI and US replaced XR use in the ED, as use of US continued to rise as use of XR continued its decline. While our data do not allow for causal determination, the decline in use of imaging since 2007 is likely due to a number of factors, including concerns regarding ionizing radiation exposure, increased scrutiny of high-cost imaging, culture change brought about by leadership advocacy for increased appropriateness in imaging, the use of CDS targeted interventions to improve the adherence to evidence-based imaging guidelines in the ED, direct importation of imaging for transferred patients, and CDS designed to decrease repeat imaging. Further studies of factors contributing to declines in ED imaging use should focus on use after 2007, as this correctly reflects modern practice and the impact of various more recent interventions and strategies to increase the appropriateness of ED imaging studies.
Acknowledgments
Funding Information and Acknowledgements: This study was funded by grant 1UC4EB012952-01 from the National Institute of Biomedical Imaging and Bioengineering. The funding source had no bearing on study design or data collection, analysis, or interpretation. The authors acknowledge and thank Ms. Laura E. Peterson, BSN, SM for editorial support.
References
- 1.Broder J, Fordham LA, Warshauer DM. Increasing utilization of computed tomography in the pediatric emergency department, 2000–2006. Emerg Radiol. 2007;14(4):227–32. doi: 10.1007/s10140-007-0618-9. [DOI] [PubMed] [Google Scholar]
- 2.Lee J, Kirschner J, Pawa S, Wiener DE, Newman DH, Shah K. Computed tomography use in the adult emergency department of an academic urban hospital from 2001 to 2007. Ann Emerg Med. 2010 Dec;56(6):591–6. doi: 10.1016/j.annemergmed.2010.05.027. [DOI] [PubMed] [Google Scholar]
- 3.Korley FK, Pham JC, Kirsch TD. Use of advanced radiology during visits to US emergency departments for injury-related conditions, 1998–2007. JAMA. 2010 Oct 6;304(13):1465–1471. doi: 10.1001/jama.2010.1408. [DOI] [PubMed] [Google Scholar]
- 4.Wiener RS, Schwartz LM, Woloshin S. Time trends in pulmonary embolism in the United States: evidence of overdiagnosis. Arch Intern Med. 2011 May 9;171(9):831–7. doi: 10.1001/archinternmed.2011.178. [DOI] [PMC free article] [PubMed] [Google Scholar]
- 5.Raja AS, Wright C, Sodickson AD, Zane RD, Schiff GD, Hanson R, et al. Negative Appendectomy Rate in the Era of CT: An 18-year Perspective1. Radiology. 2010 Aug 1;256(2):460–5. doi: 10.1148/radiol.10091570. [DOI] [PubMed] [Google Scholar]
- 6.Wildermuth S, Knauth M, Brandt T, Winter R, Sartor K, Hacke W. Role of CT Angiography in Patient Selection for Thrombolytic Therapy in Acute Hemispheric Stroke. Stroke. 1998 May 1;29(5):935–8. doi: 10.1161/01.str.29.5.935. [DOI] [PubMed] [Google Scholar]
- 7.Sodickson A, Baeyens PF, Andriole KP, Prevedello LM, Nawfel RD, Hanson R, et al. Recurrent CT, cumulative radiation exposure, and associated radiation-induced cancer risks from CT of adults. Radiology. 2009 Apr;251(1):175–84. doi: 10.1148/radiol.2511081296. [DOI] [PubMed] [Google Scholar]
- 8.Smith-Bindman R, Lipson J, Marcus R, Kim K-P, Mahesh M, Gould R, et al. Radiation dose associated with common computed tomography examinations and the associated lifetime attributable risk of cancer. Arch Intern Med. 2009 Dec 14;169(22):2078–86. doi: 10.1001/archinternmed.2009.427. [DOI] [PMC free article] [PubMed] [Google Scholar]
- 9.Raja AS, Ip IK, Prevedello LM, Sodickson AD, Farkas C, Zane RD, et al. Effect of computerized clinical decision support on the use and yield of CT pulmonary angiography in the emergency department. Radiology. 2012 Feb;262(2):468–74. doi: 10.1148/radiol.11110951. [DOI] [PMC free article] [PubMed] [Google Scholar]
- 10.Ip IK, Schneider LI, Hanson R, Marchello D, Hultman P, Viera M, et al. Adoption and Meaningful Use of Computerized Physician Order Entry With an Integrated Clinical Decision Support System for Radiology: Ten-Year Analysis in an Urban Teaching Hospital. Journal of the American College of Radiology. 2012 Feb;9(2):129–36. doi: 10.1016/j.jacr.2011.10.010. [DOI] [PubMed] [Google Scholar]
- 11.National Quality Forum. Proposed Imaging Efficiency Measures [Internet] [cited 2011 Nov 6]. Available from: http://www.qualityforum.org/projects/imaging_efficiency.aspx.
- 12.Levin DC, Rao VM, Parker L. The Recent Downturn in Utilization of CT: The Start of a New Trend? Journal of the American College of Radiology. 2012 Nov;9(11):795–8. doi: 10.1016/j.jacr.2012.05.023. [DOI] [PubMed] [Google Scholar]
- 13.Menoch MJA, Hirsh DA, Khan NS, Simon HK, Sturm JJ. Trends in Computed Tomography Utilization in the Pediatric Emergency Department. Pediatrics. 2012 Mar 1;129(3):e690–e697. doi: 10.1542/peds.2011-2548. [DOI] [PubMed] [Google Scholar]
- 14.Raja AS, Walls RM, Schuur JD. Decreasing use of high-cost imaging: the danger of utilization-based performance measures. Ann Emerg Med. 2010 Dec;56(6):597–9. doi: 10.1016/j.annemergmed.2010.09.013. [DOI] [PubMed] [Google Scholar]
- 15.Schuur JD, Raja AS, Walls RM. CMS selects an invalid imaging measure: déjà vu all over again. Ann Emerg Med. 2011 Jun;57(6):704–5. doi: 10.1016/j.annemergmed.2011.02.011. [DOI] [PubMed] [Google Scholar]
- 16.Khorasani R, Goel PK, Ma’luf NM, Fox LA, Seltzer SE, Bates DW. Trends in the use of radiology with inpatients: what has changed in a decade? AJR Am J Roentgenol. 1998;170(4):859–61. doi: 10.2214/ajr.170.4.9530023. [DOI] [PubMed] [Google Scholar]
- 17.Wuerz RC, Travers D, Gilboy N, Eitel DR, Rosenau A, Yazhari R. Implementation and Refinement of the Emergency Severity Index. Academic Emergency Medicine. 2001 Feb 1;8(2):170–6. doi: 10.1111/j.1553-2712.2001.tb01283.x. [DOI] [PubMed] [Google Scholar]
- 18.Wuerz RC, Milne LW, Eitel DR, Travers D, Gilboy N. Reliability and validity of a new five-level triage instrument. Acad Emerg Med. 2000 Mar;7(3):236–42. doi: 10.1111/j.1553-2712.2000.tb01066.x. [DOI] [PubMed] [Google Scholar]
- 19.(ESI)-Emergency Severity Index Algorithm [Internet] [cited 2013 Jul 15]. Available from: http://www.esitriage.org/algorithm.asp?LastClicked=algorithm.
- 20.Brenner DJ, Hall EJ. Computed tomography--an increasing source of radiation exposure. N Engl J Med. 2007;357(22):2277–84. doi: 10.1056/NEJMra072149. [DOI] [PubMed] [Google Scholar]
- 21.Berrington de Gonzalez A, Mahesh M, Kim KP, Bhargavan M, Lewis R, Mettler F, et al. Projected cancer risks from computed tomographic scans performed in the United States in 2007. Arch Intern Med. 2009;169(22):2071–7. doi: 10.1001/archinternmed.2009.440. [DOI] [PMC free article] [PubMed] [Google Scholar]
- 22.Shinagare AB, Abbett S, Hanson R, Seltzer S, Khorasani R. Inpatient imaging utilization: trends of the last decade. AJR. 2013 doi: 10.2214/AJR.13.10986. In press. [DOI] [PubMed] [Google Scholar]
- 23.Brook RH. The Role of Physicians in Controlling Medical Care Costs and Reducing Waste. JAMA. 2011 Aug 10;306(6):650–1. doi: 10.1001/jama.2011.1136. [DOI] [PubMed] [Google Scholar]
- 24.Wells PS, Anderson DR, Rodger M, Ginsberg JS, Kearon C, Gent M, et al. Derivation of a simple clinical model to categorize patients probability of pulmonary embolism: increasing the models utility with the SimpliRED D-dimer. Thromb Haemost. 2000 Mar;83(3):416–20. [PubMed] [Google Scholar]
- 25.Wasser EJ, Prevedello LM, Sodickson A, Mar W, Khorasani R. Impact of a Real-Time Computerized Duplicate Alert System on the Utilization of Computed Tomography. JAMA Intern Med. 2013 Apr;22:1–2. doi: 10.1001/jamainternmed.2013.543. [DOI] [PMC free article] [PubMed] [Google Scholar]
- 26.Sodickson A, Opraseuth J, Ledbetter S. Outside Imaging in Emergency Department Transfer Patients: CD Import Reduces Rates of Subsequent Imaging Utilization. Radiology. 2011 Apr 19;260(2):408–13. doi: 10.1148/radiol.11101956. [DOI] [PubMed] [Google Scholar]


