

Abstract
Background
Hypertension is an increasing problem in Southeast Asia, particularly in Bangladesh. Although some epidemiological studies on hypertension have been conducted in Bangladesh, the factors associated with hypertension in this nation remain unclear. We aimed to determine the factors associated with hypertension among the adults in Bangladesh.
Methods
We conducted a cross-sectional study using data from the nationally representative 2011 Bangladesh Demographic and Health Survey (BDHS). A total of 7,839 (3,964 women and 3,875 men) adults aged 35 years and older who participated in the survey was included. Hypertension was defined by a systolic blood pressure ≥ 140 mmHg and/or, diastolic blood pressure ≥ 90 mmHg and/or, receipt of an anti-hypertensive medication at time of the survey. The degree of association between the risk factors and the outcome was assessed by the odd ratio (OR) obtained from the bivariate and multivariable logistic regression models.
Results
The overall prevalence of hypertension was 26.4 %, and the prevalence was higher in women (32.4 %) than men (20.3 %). Study participants with the age group of 60–69 years had higher odds of having hypertension (AOR: 3.77, 95 % CI: 3.01–4.72) than the age group 35–39 years. Moreover, individuals who had higher educational attainment (AOR: 1.63, 95 % C.I: 1.25–2.14) and higher wealth status (AOR = 1.91, 95 % CI: 1.54–2.38) had higher odds of having hypertension than the individuals with no education and lower social status, respectively. The analysis also showed that high BMI (AOR: 2.19, 95 % C.I: 1.87–2.57) and having diabetes (AOR: 1.54, 95 % C.I: 1.31–1.83) were associated with the increasing risk of hypertension.
Conclusions
Our study shows that the risk of hypertension was significantly associated with older age, sex, education, place of residence, working status, wealth index, BMI, and diabetes. Moreover, hypertension is largely untreated, especially in rural settings. The health system needs to develop appropriate strategies including early diagnosis, awareness via mass media, and health education programs for changing lifestyles should be initiated for older age, wealthy, and/or higher educated individuals in Bangladesh. Moreover, area-specific longitudinal research is necessary to find out the underlying causes of regional variations.
Keywords: Hypertension, Non-communicable diseases, Body mass index (BMI), National survey, BDHS, Diabetes, Bangladesh
Background
Hypertension is one of the major non-communicable diseases (NCDs) in the world, which significantly contributes to the burden of cardiovascular diseases (CVDs), stroke, kidney failure, disability, and premature death [1–3]. It is also identified as a global disease burden and is ranked third as a cause of disability-adjusted life-years (DALYs) [4]. According to the World Health Organization (WHO), about 17 million deaths occur worldwide due to CVDs, of which hypertension alone accounts for 9.4 million deaths [5, 6], and 80 % of the CVD-related deaths occurred in the developing countries [7]. The global prevalence of hypertension is projected to increase from 26 % in 2000 to 29.2 % by 2025 [5], which will be approximately 29 % of the world’s population. Although hypertension is more prevalent in developed counties like USA [8], its prevalence is increasing in the low and middle-income countries (LMIC) [1]. Countries in Asia, especially Southeast Asia, are having an increasing burden of hypertension including CVDs [9–11]. According to the WHO, hypertension has become a significant health concern in the Asian region, affecting more than 35 % of the adult population [12]. The two fast-growing economies, India, and China, have a huge burden of hypertension and are projected to proliferate by 2025 [13]. Bangladesh, a developing country in South Asia, has been experiencing an epidemiologic transition from communicable diseases to NCDs [14]. In recent years, rapid urbanization, increased life expectancy, unhealthy diet, and lifestyle changes have led to an increase in the rate of CVD including hypertension in Bangladesh [15]. The prevalence of hypertension was first reported as 1.10 % in 1976 in Bangladesh [16]. A systematic review and meta-analysis of the prevalence of hypertension in the country among 6,430 adults for the period 1995 to 2009 was estimated to be 13.5 % with a 95 % confidence interval (CI) ranging from 12.7–14.2 % [17]. Another meta-analysis for the prevalence of CVDs and type 2 diabetes between 1995 to 2010 found the pooled prevalence of hypertension to be 13.7 % (CI:12.1 %–15.3 %) [18]. Moreover, there was a wide range of variation in the prevalence of hypertension reported by several studies ranging from 11 to 44 % [17–21]. Due to the lack of representative data, [14, 17, 22] these studies were small-scale, confined to urban - rural communities or some other specific groups (e.g. slum residents), which cannot provide sufficient information for Bangladesh at large [14, 16, 23–25]. Also, a substantial proportion of the population with hypertension remains undiagnosed and not treated properly due to lack of access to health care and high treatment costs. Thus, this study was intended to assess the factors associated with hypertension in the general adult population in Bangladesh.
Methods
Study population
Bangladesh, located in the northeastern part of South Asia is one of the most densely populated countries in the world (1,015 people per sqkm), with a population of nearly 149.8 million in 2011 [26]. For administrative purposes, the country has divided into seven regions: south (Barishal), southeast (Chittagong), central (Dhaka), west (Khulna), midwestern corner (Rajshahi), northwest (Rangpur), and east (Sylhet). Including the capital in Dhaka, these administrative regions possess different demographic, environmental, and economic structures [26, 27]. All household members of age 35 years and older from both rural and urban areas were eligible to participate in the study.
Data source
The Demographic Health Survey (DHS) was designed to collect data to monitor and evaluate population health and nutritional status of developing countries. In Bangladesh, this survey has been carried out continuously in three-year intervals since 1993 under the authority of the National Institute for Population Research and Training (NIPORT) of the Ministry of Health and Family Welfare. The data files are available at the DHS Program website [28]. The 2011 DHS was the first national survey in Bangladesh to incorporate the measurements of biomarker information including blood pressure and blood glucose measurements. For this study, we used the most recent available data of the 2011 Bangladesh Demographic and Health Survey (BDHS) including participants of age 35 years and older.
Sampling design and sample size
The 2011 BDHS used two-stage stratified cluster sampling from non-institutionalized households [27]. The sampling frame used for the survey was the complete list of enumeration areas (EA) covering the whole country of the most recent population census prepared by Bangladesh Bureau of Statistics (BBS) [26]. An EA is a geographic area covering on average 113 households. In the first stage, 600 EAs (207 urban, 393 rural) were selected with probability proportional to the EA size. In the second stage, a systematic sample of 30 households on average was selected with an equal probability from each EA to provide statistically reliable estimates of key demographic and health variables for the country as a whole, for urban and rural areas separately, and for each of the seven divisions. With this design, the survey selected 17,964 (11,754 Rural, 6,210 Urban) residential households. Among the selected households, 17,141 households were interviewed successfully [27]. For measuring biomarker information, a subsample (one in three of the 17,511 eligible households) was selected. In this subsample, all women and men aged 35 years and older were eligible to participate in the biomarker component, which included blood pressure measurements, testing for anemia, blood glucose testing, and height and weight measurements. This subsample included a total of 8,835 (4,524 men and 4,311 women) household members age 35 years and older from 83,731 household members [27]. Among these individuals, 92 % of women and 86 % of men participated in the blood pressure measurement, and 89 % of women and 83 % of men participated in the blood glucose measurement. After excluding missing data and non-responses, the final sample was 7,839. The sample design and sample selection process is presented in Fig. 1. The detailed survey procedure, study method, and questionnaires are available in the final report of the 2011 BDHS [27].
Fig. 1.
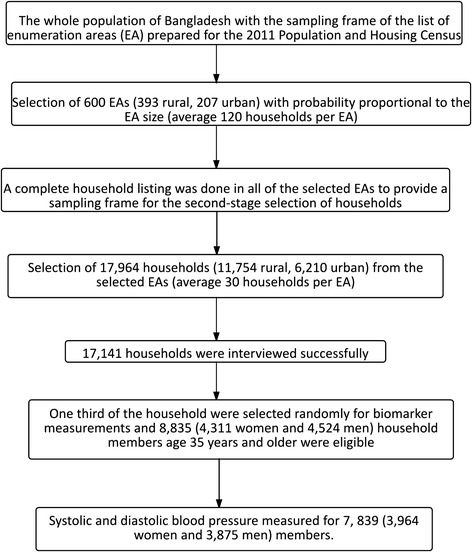
Sample method and sample size
Ethical issues and consent
The 2011 BDHS received ethical approval from ICF Macro Institutional Review Board, Maryland, USA and National Research Ethics Committee of Bangladesh Medical Research Council (BMRC), Dhaka, Bangladesh. Informed consent was obtained from each participant of the survey before enrolling in the survey by using the Introduction and Consent form of the survey. It was also explained that the information will be kept strictly confidential and will not be shared with anyone except members of the survey team. All of these information were de-identified before the analyses.
Outcome of interest
The outcome variable was having hypertension. The 2011 BDHS used the American Heart Association (AHA) guidelines for cut-off points for blood pressure measurements [29]. An individual was considered to have hypertension if systolic blood pressure (SBP) ≥ 140 mmHg (millimeters of mercury) and/or, diastolic blood pressure (DBP) ≥ 90 mmHg and/or taking anti-hypertensive medication during the survey. Pre-hypertension was defined by SBP ≥120 mmHg but < 140 mmHg and/or DBP ≥ 80 mmHg but < 90 mmHg and/or not taking anti-hypertensive medication at the time of survey [29]. Individuals with SBP ≤ 120 or DBP <80 mmHg or not taking anti-hypertensive medication were considered as non-hypertension [29]. For analytical purposes, we merged two groups (pre-hypertension and non-hypertension) together to make the variable dichotomous (person with hypertension versus no hypertension).
Risk factors
The following variables were used as risk factors: age, sex, marital status, working status, wealth index, place of residence, region of residence, body mass index, and diabetes. The wealth index was calculated by the BDHS using the principal component analysis ranging from poorest to richest levels [27]. The body mass index was categorized into two categories: normal (BMI ≤24.99), overweight and obese (BMI ≥30). Due to fewer frequencies, underweight and overweight BMI categories were re-coded. The re-coded BMI variable considered underweight with normal and overweight with obese categories. Diabetes was defined as having a fasting plasma glucose level ≥ 7.0 mmol/L and/or taking diabetes medication at the time of the survey. Any person having either fasting plasma glucose (mmol/ L) level between 6.0 to 6.9 and no diabetes medication at the time of the survey was defined as a pre-diabetic person. Similarly, any person having either fasting plasma glucose level below 6.0 mmol/L and not taking diabetes medication was defined as a diabetes free person [30]. For analytical purposes, we merged two groups (pre-diabetes and diabetes free) together to make the variable dichotomous.
Measurement of the disease
The 2011 BDHS used the LIFE SOURCE® UA-767 Plus Blood Pressure Monitor model; the automatic device included separate cuffs for measuring blood pressure in respondents with small, medium, and large arm circumferences. This model is one of the blood pressure monitors recommended for use by WHO. During the survey, blood pressure was measured and recorded by trained health technicians. Three measurements of both systolic and diastolic blood pressure were taken during the survey at approximately 10-minute intervals between measurements. The average of the second and third measurements was used to report respondents’ blood pressure values [27].
Statistical analyses
A series of statistical analyses, such as multivariable logistic regression, has been performed. Descriptive information for the selected variables was provided first. Then cross-tabulations (i.e. bivariate) were performed to compare the hypertension status across covariate categories. A chi-square test was performed to assess the proportional differences in hypertension status across the selected categorical variables. Bivariate and multivariable logistic regression models were used to identify the significant risk factors for hypertension. Initially, potential risk factors were assessed using bivariate logistic regression analysis; an arbitrary p - value of < 0.20 was used as criteria to include it in the multivariable logistic regression model to control confounding effects, and the results were statistically significant at p- value of ≤ 0.05. For the multivariable logistic regression models, we calculated the crude odds ratios (COR) and adjusted odds ratio (AOR) with 95 % confidence interval (CI) for each independent variable. Appropriate sample weights provided by the 2011 BDHS were used for analysis. All statistical procedures were performed using the Statistical Analysis System (SAS) 9.4 for Windows (SAS Institute Inc., Cary, NC, USA).
Results
A summary of the socioeconomic, demographic, and anthropometric characteristics of the hypertensive and non- hypertensive study participants is presented in Table 1. Among the 7,839 subjects, 49.4 % were male and 50.6 % were female. The median age (±SD) of the study participants was 49.0 (±13) years. The mean SBP (±SD) and DBP (±SD) was 118.95 (21.36) and 78.03 (11.89), respectively. It was observed that study participants with older age (60–69 years), higher education, and higher wealth status had higher percentage of having hypertension compared to the study participants with a younger age (35–39 years), no education, and poor wealth status, respectively. The majority of the hypertensive respondents came from the richest households (30.3 %) followed by richer households (22.2 %), and other wealth index categories had a similar proportion of having hypertension (around 14 %). Hypertension was significantly associated with high BMI and having diabetes. Moreover, hypertension significantly varied by geographic region, marital status, and employment status. The distribution of level of education, wealth status, body mass index (BMI), and diabetes status by place of residence is shown in Table 2. It is found that urban study participants had higher educational attainment (12.5 % vs. 3.4 %) and higher wealth status (50.7 % vs. 10.8 %) compared to rural study participants. Similar proportion was also found in BMI and diabetes status of the respondents: urban individuals had higher BMI (25.7 %) and a higher proportion of diabetes (16 %). Figure 2 shows the awareness and treatment status of the hypertensive respondents by place of residence and gender. It is found that awareness and treatment among urban males are more or less similar whereas, rural men and women are less aware of their status of hypertension, and they are less likely to take medication to lower the blood pressure. Table 3 shows the risk factors associated with hypertension from the multivariable logistic regression analysis, together with adjusted and crude odds ratios, and 95 % confidence intervals after adjusting for a number of important covariates. Study participants with older age, female gender, higher education, higher socioeconomic status, living in urban areas, overweight and obesity, and diabetes, were more likely to have hypertension. The risk of hypertension was significantly higher among the individuals aged 60 to 69 years (AOR = 3.77, 95 % CI: 3.01–4.72) and those aged 70 years and older (AOR = 4.17, 95 % CI: 3.24–5.36) compared to the individuals aged 35–39 years old. In addition, respondents with higher education had 63 % (AOR: 1.63, 95 % CI: 1.24–2.13) of a higher chance of having hypertension compared to the respondents with no education. The multivariable logistic regression also indicates that the richest individuals were more likely to have hypertension compared to the poorest individuals (AOR: 1.91 (95 % CI1.54–2.38). The urban study participants were 16 % (AOR: 1.16, 95 % C.I: 1.00–1.35) more likely to have hypertension compared to the rural respondents. The risk of hypertension was found to be significantly lower (AOR: 0.64, CI: 0.53–0.77) among employed individuals compared to those with no employment. There was a noticeable variation in risk of hypertension among seven administrative divisions of Bangladesh: the risk was 46 % higher among the individuals from Rangpur (AOR: 1.46, CI: 1.09–1.94) and 35 % higher among the individuals from Khulna (AOR: 1.35, 95 % CI: 1.02–1.79) division compared to the individuals from Barisal division. The odds of having hypertension among overweight and obese respondents was found to be 2.19 (95 % CI: 1.87–2.57) times higher compared to normal-weight respondents. For individuals with diabetes, the odds of having hypertension were 54 % (AOR: 1.54, 95 % CI: 1.31–1.83) higher than the individuals without diabetes.
Table 1.
Characteristic of the study participants by hypertension status, Bangladesh Demographic and Health Survey (BDHS), 2011
| Total | No hypertension | Hypertension | |||||
|---|---|---|---|---|---|---|---|
| Variables | n | % | n | % | n | % | |
| Age group | *** | ||||||
| 35–39 | 1477 | 18.8 | 1267 | 21.8 | 210 | 10.4 | |
| 40–44 | 1372 | 17.5 | 1096 | 18.8 | 276 | 13.7 | |
| 45–49 | 1213 | 15.5 | 923 | 15.8 | 290 | 14.4 | |
| 50–54 | 1053 | 13.4 | 777 | 13.3 | 276 | 13.7 | |
| 55–59 | 689 | 8.8 | 482 | 8.3 | 207 | 10.3 | |
| 60–69 | 1095 | 14.0 | 710 | 12.2 | 385 | 19.1 | |
| 70+ | 940 | 12.0 | 569 | 9.8 | 371 | 18.4 | |
| Sex | *** | ||||||
| Male | 3875 | 49.4 | 3122 | 53.6 | 753 | 37.4 | |
| Female | 3964 | 50.6 | 2701 | 46.4 | 1263 | 62.6 | |
| Marital status | *** | ||||||
| Currently married | 6595 | 84.1 | 5091 | 87.4 | 1504 | 74.6 | |
| Others | 1243 | 15.9 | 732 | 12.6 | 511 | 25.4 | |
| Education | ** | ||||||
| No education | 3724 | 47.5 | 2732 | 46.9 | 992 | 49.2 | |
| Primary education | 2560 | 32.7 | 1954 | 33.6 | 606 | 30.1 | |
| Secondary education | 1108 | 14.1 | 816 | 14.0 | 292 | 14.5 | |
| Higher education | 446 | 5.7 | 321 | 5.5 | 125 | 6.2 | |
| Working status | *** | ||||||
| No | 4073 | 52.0 | 2723 | 46.8 | 1350 | 67.0 | |
| Yes | 3762 | 48.0 | 3098 | 53.2 | 664 | 33.0 | |
| Wealth index | *** | ||||||
| Poorest | 1524 | 19.4 | 1237 | 21.2 | 287 | 14.2 | |
| Poorer | 1508 | 19.2 | 1182 | 20.3 | 326 | 16.2 | |
| Middle | 1551 | 19.8 | 1205 | 20.7 | 346 | 17.2 | |
| Richer | 1619 | 20.7 | 1172 | 20.1 | 447 | 22.2 | |
| Richest | 1637 | 20.9 | 1027 | 17.6 | 610 | 30.3 | |
| Place of residence | *** | ||||||
| Rural | 6009 | 76.7 | 4590 | 78.8 | 1419 | 70.4 | |
| Urban | 1829 | 23.3 | 1233 | 21.2 | 596 | 29.6 | |
| Division of residence | *** | ||||||
| Barisal | 464 | 5.9 | 350 | 6.0 | 114 | 5.7 | |
| Chittagong | 1334 | 17 | 1041 | 17.9 | 293 | 14.5 | |
| Dhaka | 2514 | 32.1 | 1834 | 31.5 | 680 | 33.7 | |
| Khulna | 1020 | 13 | 712 | 12.2 | 308 | 15.3 | |
| Rajshahi | 1136 | 14.5 | 867 | 14.9 | 269 | 13.3 | |
| Rangpur | 922 | 11.8 | 663 | 11.4 | 259 | 12.9 | |
| Sylhet | 449 | 5.7 | 357 | 6.1 | 92 | 4.6 | |
| Body mass index | *** | ||||||
| Normal | 6586 | 86.5 | 5088 | 89.8 | 1480 | 76.9 | |
| Overweight or obese | 1023 | 13.5 | 579 | 10.2 | 444 | 23.1 | |
| Diabetes status | *** | ||||||
| No | 6699 | 89.0 | 5074 | 90.9 | 1625 | 83.6 | |
| Yes | 825 | 11.0 | 506 | 9.1 | 319 | 16.4 | |
Notes: *** < 0.01, ** < 0.5, * < 0.1
Table 2.
Distribution of education, wealth status, body mass index (BMI), and diabetes status by place of residence, Bangladesh Demographic and Health Survey (BDHS), 2011
| Total | Urban | Rural | ||||
|---|---|---|---|---|---|---|
| Variables | n | % | n | % | n | % |
| Education | ||||||
| No education | 3537 | 44.8 | 867 | 33.5 | 2670 | 50.4 |
| Primary education | 2656 | 33.7 | 860 | 33.2 | 1796 | 33.9 |
| Secondary education | 1192 | 15.1 | 539 | 20.8 | 653 | 12.3 |
| Higher education | 502 | 6.4 | 323 | 12.5 | 179 | 3.4 |
| Wealth index | ||||||
| Poorest | 1403 | 17.8 | 199 | 7.7 | 1204 | 22.7 |
| Poorer | 1428 | 18.1 | 169 | 6.5 | 1259 | 23.8 |
| Middle | 1529 | 19.4 | 292 | 11.3 | 1237 | 23.3 |
| Richer | 1642 | 20.8 | 617 | 23.8 | 1025 | 19.3 |
| Richest | 1885 | 23.9 | 1312 | 50.7 | 573 | 10.8 |
| Body mass index | ||||||
| Normal | 6498 | 85.1 | 1864 | 74.3 | 4634 | 90.3 |
| Overweight or obese | 1142 | 14.9 | 644 | 25.7 | 498 | 9.7 |
| Diabetes status | ||||||
| No | 6663 | 88.3 | 2084 | 84 | 4579 | 90.5 |
| Yes | 879 | 11.7 | 397 | 16 | 482 | 9.5 |
Fig. 2.
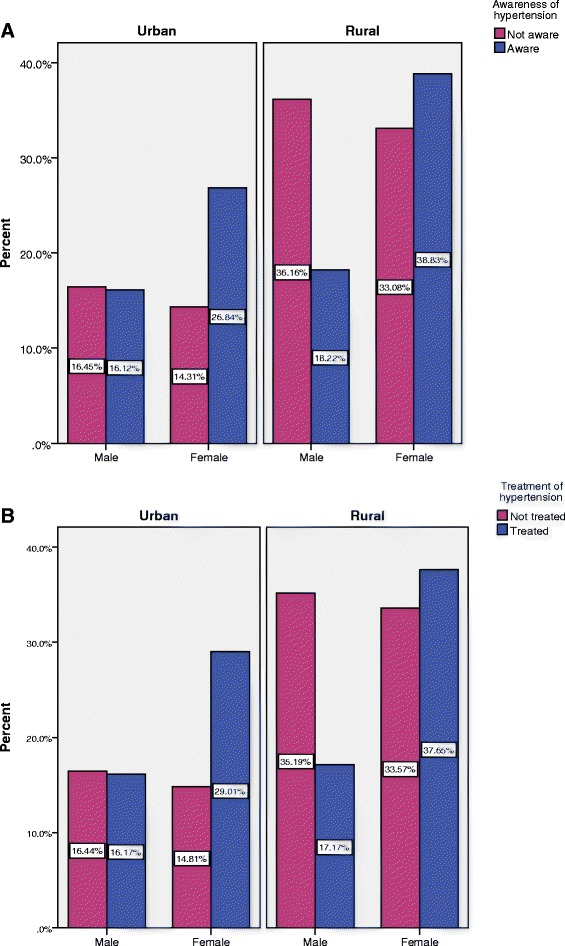
Awareness and treatment status of hypertension by sex and by place of residence, Bangladesh Demographic and Health Survey (BDHS), 2011
Table 3.
Bivariate and multivariable logistic regression analysis of factors associated with hypertension among adults in Bangladesh, Bangladesh Demographic and Health Survey (BDHS), 2011
| Variables | COR | CI | AOR | CI | ||
|---|---|---|---|---|---|---|
| Age group | ||||||
| 35–39 | Ref | Ref | ||||
| 40–44 | 1.43 | 1.17–1.75 | ** | 1.45 | 1.18–1.79 | ** |
| 45–49 | 1.88 | 1.54–2.30 | *** | 2.00 | 1.62–2.47 | *** |
| 50–54 | 2.00 | 1.63–2.46 | *** | 2.56 | 2.05–3.20 | *** |
| 55–59 | 2.51 | 2.01–3.14 | *** | 2.71 | 2.12–3.46 | *** |
| 60–69 | 3.09 | 2.54–3.76 | *** | 3.77 | 3.01–4.72 | *** |
| 70+ | 3.59 | 2.93–4.40 | *** | 4.16 | 3.24–5.36 | *** |
| Sex | ||||||
| Male | Ref | Ref | ||||
| Female | 1.93 | 1.74–2.15 | *** | 1.44 | 1.19–1.74 | ** |
| Marital status | ||||||
| Currently married | Ref | Ref | ||||
| Others | 2.29 | 2.00–2.62 | *** | 1.36 | 1.15–1.60 | *** |
| Education | ||||||
| No education | Ref | Ref | ||||
| Primary education | 1.16 | 1.03–1.31 | ** | 1.11 | 0.97–1.28 | |
| Secondary education | 1.17 | 0.99–1.38 | * | 1.35 | 1.12–1.63 | ** |
| Higher education | 1.27 | 1.00–1.60 | ** | 1.63 | 1.25–2.14 | *** |
| Working status | ||||||
| No | Ref | Ref | ||||
| Yes | 0.43 | 0.39–0.49 | *** | 0.64 | 0.53–0.77 | *** |
| Wealth index | ||||||
| Poorest | Ref | Ref | ||||
| Poorer | 1.21 | 1.01–1.46 | ** | 1.22 | 1.01–1.48 | ** |
| Middle | 1.28 | 1.07–1.54 | ** | 1.21 | 1.00–1.48 | ** |
| Richer | 1.69 | 1.42–2.01 | *** | 1.50 | 1.23–1.82 | *** |
| Richest | 2.61 | 2.20–3.09 | *** | 1.91 | 1.54–2.38 | *** |
| Place of residence | ||||||
| Rural | Ref | Ref | ||||
| Urban | 1.57 | 1.39–1.77 | *** | 1.16 | 1.00–1.35 | * |
| Division of residence | ||||||
| Barisal | Ref | Ref | ||||
| Chittagong | 0.90 | 0.69–1.17 | 0.72 | 0.54–0.96 | ** | |
| Dhaka | 1.16 | 0.91–1.48 | 1.04 | 0.84–1.36 | ||
| Khulna | 1.33 | 1.02–1.74 | ** | 1.35 | 1.02–1.79 | ** |
| Rajshahi | 1.01 | 0.77–1.32 | 1.07 | 0.81–1.43 | ||
| Rangpur | 1.23 | 0.93–1.60 | 1.46 | 1.09–1.94 | ** | |
| Sylhet | 0.82 | 0.59–1.13 | 0.75 | 0.52–1.06 | * | |
| Body mass index | ||||||
| Normal | Ref | Ref | ||||
| Overweight or obese | 2.65 | 2.30–3.04 | *** | 2.19 | 1.87–2.57 | *** |
| Diabetes status | ||||||
| No | Ref | Ref | ||||
| Yes | 1.99 | 1.71–2.32 | *** | 1.54 | 1.31–1.83 | *** |
COR Crude odds ratio, AOR Adjusted odds ratio
Notes: *** < 0.01, ** < 0.5, * < 0.1
Discussion
In this population-based, cross-sectional, and nationally representative study among the adults in Bangladesh, we found that older age, female, higher education, wealthier socioeconomic status, diabetes, and high BMI (overweight and obesity) were significant factors associated with hypertension, which is consistent with the previous studies in Bangladesh and other studies in developing countries [24, 31–37]. We also found that a significant proportion of rural adults was not aware of this disease. Study participants with age 60–69 years had higher odds of (AOR = 3.77) having hypertension than those of 35–39 years old. Moreover, we observed a significant positive association between increasing age and hypertension. Since age is an unmodifiable risk factor [38], in Bangladesh, the population age structure is changing due to the decline in fertility level and a steady increase in life expectancy. The number of old age population will increase rapidly, which will strengthen the risk of hypertension among older age population in the near future [39]. Therefore, other modifiable factors should be taken into consideration through intervention programs. For example, reducing weight and cutting fatty foods from daily meals could be an option. Moreover, respondent’s education and wealth status were positively associated with the risk of hypertension in our study. A similar positive correlation was also observed in the low and middle-income countries, whereas an inverse correlation was found in developed countries [24, 31]. More clearly, in low and middle income countries, individuals having higher education belong to the richest wealth quintile, which leads them to have luxurious lifestyles and consumption of more high-caloric foods. As a result, the body weight of individuals has increased, and their physical activity has decreased, which increase the likelihood of having hypertension [34, 40–44]. We found that the odds of having hypertension was higher among urban respondents, which is also consistent with other studies in Bangladesh [44] and India [45]. The main reason for this could be consumption of high junk food and less physical activity among the urban respondents [44, 46]. In addition, the rural people are more likely to be engaged in daily household and other labor-intensive activities that may keep them physically active, burn more calories and lead to lower BMI [47]. In our study, the highest risk (AOR: 1.47) of hypertension was observed in the northwestern part (Rangpur Division) of the country, whereas the lowest risk was found in the eastern part (Sylhet division). This variation could be influenced by more intake of raw salt, poverty, malnutrition, and dietary habits [48, 49]. Further study will be required to investigate the variation in different geographic regions of Bangladesh. We also found high BMI (overweight and obesity) and diabetes to be a significant factor associated with hypertension. Similar findings were found in a study in India and Bangladesh conducted by the WHO [50] and other recent studies [51]. Since the relationship between hypertension and BMI is well established [51], further study is needed to investigate the progression of BMI with diet and physical activity. Unplanned development in the urban areas has created an environment that is prohibitive and unsafe for physical activity [52]. Popularity of and increased access to fast food may also contribute to poorer diet quality, among the city’s affluent class [53]. Studies in some developed countries demonstrate that urbanization is one of the important factors of hypertension [54–56]; however, in our analysis, urbanization was not included due to limited data. Hypertension was found to be associated with diabetes. However, epidemiological studies and pathophysiological mechanism as well other studies in Bangladesh reported the coexistence of hypertension [39, 57].
Strengths and limitations
The major strengths of our study are the use of a nationally representative survey data with comprehensive information on hypertension, using anthropometric and demographic variables. Moreover, the measurements of hypertension were collected by trained and experienced health technicians using WHO-recommended methods rather self-reporting. Since DHS uses standard and valid data collection tools, the measurement error and bias is less in this study compared to other cross-sectional studies in Bangladesh. In spite of some good strengths, our study also has some limitations. The main limitation was that some other important factors of hypertension like diet, physical exercise, family history of hypertension, HDL- cholesterol level, smoking status, salt intake, and impact of urbanization were not included in the analysis as they are not available in the 2011 BDHS data. Moreover, the 2011 BDHS is a cross-sectional survey, and an individual’s blood pressure was taken in the survey for one day only. Therefore, we do not have longitudinal data for the factors associated with hypertension. Additionally, we only considered individuals of age 35 years and older to provide the biomarker information. Therefore, results of this study may not be extended to the younger age groups.
Conclusions
In this study, we found that there is a wide range of factors, which are significantly associated with hypertension among the adults (age ≥35 years) in Bangladesh. The findings demonstrate that individuals with older age, higher socioeconomic status, higher education, high BMI, and diabetes have a significant influence on the odds of having hypertension. Moreover, a significant proportion of the adult men and women are not aware of the consequence of this disease, and a small proportion of them are taking antihypertensive drugs. The implications of the findings are important since a large proportion of the population in Bangladesh are adults and if corrective actions are not taken, there will be unbearable health consequences. Since most of these factors associated with hypertension are modifiable and preventable, early diagnosis, preventive behavior, and taking policies can reduce the odds of having the disease. Therefore, the health system of the country needs to develop strategies to increase the required screening and diagnosis of the hypertension to both rural and urban areas. Comprehensive and integrated intervention programs should be implemented to make awareness so that the primary health care services go towards the primary prevention and management of the needs of older adults. These interventions may include changing lifestyle and food habits at the community level to reduce the future burden of the disease. Furthermore, longitudinal research is required to find out the underlying causes of risk of hypertension across the regions of Bangladesh.
Acknowledgement
We would like to thank MEASURE DHS and NIPORT for allowing us to use the data set. We also would like to thank Dr. M. Kabir, former professor of statistics, Jahangirnagar University, Dhaka, Bangladesh for his inspiration, suggestion, and assistance in all aspects. We wish to thank Dr. Tan Li, Assistant Professor, Department of Biostatistics, Robert Stempel College of Public Health & Social Work, Florida International University for his very helpful advice in revising the manuscript. We are also thankful to the editor and reviewers for their valuable comments and suggestion which led to significant improvements of the manuscript.
Abbreviations
- AHA
American Heart Association
- BBS
Bangladesh Bureau of Statistics
- BMI
Body mass index
- BMRC
Bangladesh Medical and Research Council
- CI
Confidence interval
- COR
Crude odds ratios
- CVD
Cardiovascular disease
- DALY
Disability adjusted life years
- DHS
Demographic Health Survey
- DBP
Diastolic blood pressure
- EA
Enumeration area
- ICF International
A Technology, Policy, and Management consulting services company
- LMIC
Low and middle-income countries
- NCD
Non-communicable diseases
- NIPORT
National Institute for Population Research and Training
- AOR
Adjusted odds ratio
- SBP
Systolic blood pressure
- USAID
U.S. Agency for International Development
- WHO
World Health Organization
Footnotes
Competing interests
The authors declare that they have no competing interests.
Authors’ contributions
MABC conceived the idea for the study, designed the research, analysis, and interpretation of data, drafted the manuscript, revised it critically for important intellectual content, and final approval of the version to be submitted; MJU helped statistical analysis, drafting manuscripts, revised the manuscript critically for important intellectual content, and final approval of the version to be submitted; RH revised the manuscript critically for important intellectual content, and final approval of the version to be submitted; BI handled supervision of overall work, revising it critically for important intellectual content, and final approval of the version to be submitted. All authors read and approved the final manuscript.
Contributor Information
Muhammad Abdul Baker Chowdhury, Email: mchow023@fiu.edu.
Md. Jamal Uddin, Email: jamal-sta@sust.edu.
Md. Rabiul Haque, Email: rabiuldps@du.ac.bd.
Boubakari Ibrahimou, Email: bibrahim@fiu.edu.
References
- 1.Alwan A, World Health Organization. Global status report on noncommunicable diseases 2010. 2011. Available at: http://apps.who.int/iris/bitstream/10665/44579/1/9789240686458_eng.pdf.
- 2.He J, Whelton PK. Epidemiology and prevention of hypertension. Medical Clinics of North America. 1997;81(5):1077–1097. doi: 10.1016/S0025-7125(05)70568-X. [DOI] [PubMed] [Google Scholar]
- 3.Whelton PK. Epidemiology of hypertension. The Lancet. 1994;344(8915):101–106. doi: 10.1016/S0140-6736(94)91285-8. [DOI] [PubMed] [Google Scholar]
- 4.Ezzati M, Lopez AD, Rodgers A, Vander Hoorn S, Murray CJL. Selected major risk factors and global and regional burden of disease. The Lancet. 2002;360(9343):1347–1360. doi: 10.1016/S0140-6736(02)11403-6. [DOI] [PubMed] [Google Scholar]
- 5.Lim SS, Vos T, Flaxman AD, Danaei G, Shibuya K, Adair-Rohani H, et al. A comparative risk assessment of burden of disease and injury attributable to 67 risk factors and risk factor clusters in 21 regions, 1990-2010: a systematic analysis for the Global Burden of Disease Study 2010. The Lancet. 2012;380(9859):2224–2260. doi: 10.1016/S0140-6736(12)61766-8. [DOI] [PMC free article] [PubMed] [Google Scholar]
- 6.World Health Organization. A global brief on hypertension: silent killer, global public health crisis: World Health Day 2013. 2013
- 7.Lozano R, Naghavi M, Foreman K, Lim S, Shibuya K, Aboyans V, et al. Global and regional mortality from 235 causes of death for 20 age groups in 1990 and 2010: a systematic analysis for the Global Burden of Disease Study 2010. The Lancet. 2012;380(9859):2095–2128. doi: 10.1016/S0140-6736(12)61728-0. [DOI] [PMC free article] [PubMed] [Google Scholar]
- 8.Olives C, Myerson R, Mokdad AH, Murray CJL, Lim SS. Prevalence, awareness, treatment, and control of hypertension in United States counties, 2001–2009. PLoS One. 2013;8(4):e60308. doi: 10.1371/journal.pone.0060308. [DOI] [PMC free article] [PubMed] [Google Scholar]
- 9.Singh RB, Suh IL, Singh VP, Chaithiraphan S, Laothavorn P, Sy RG, et al. Hypertension and stroke in Asia: prevalence, control and strategies in developing countries for prevention. J Hum Hypertens. 2000;14(10-11):749–764. doi: 10.1038/sj.jhh.1001057. [DOI] [PubMed] [Google Scholar]
- 10.Van Minh H, Byass P, Chuc NTK, Wall S. Gender differences in prevalence and socioeconomic determinants of hypertension: findings from the WHO STEPs survey in a rural community of Vietnam. J Hum Hypertens. 2005;20(2):109–115. doi: 10.1038/sj.jhh.1001942. [DOI] [PubMed] [Google Scholar]
- 11.Hoang VM, Byass P, Dao LH, Nguyen TK, Wall S. Risk factors for chronic disease among rural Vietnamese adults and the association of these factors with sociodemographic variables: findings from the WHO STEPS survey in rural Vietnam, 2005. Prev Chronic Dis. 2007;4(2):A22–2. [PMC free article] [PubMed] [Google Scholar]
- 12.Neupane D, McLachlan CS, Sharma R, Gyawali B, Khanal V, Mishra SR, et al. Prevalence of hypertension in member countries of South Asian Association for Regional Cooperation (SAARC): systematic review and meta-analysis. Medicine 2014;93(13):e74. [DOI] [PMC free article] [PubMed]
- 13.Kearney PM, Whelton M, Reynolds K, Muntner P, Whelton PK, He J. Global burden of hypertension: analysis of worldwide data. The Lancet. 2005;365(9455):217–223. doi: 10.1016/S0140-6736(05)70151-3. [DOI] [PubMed] [Google Scholar]
- 14.Islam AK, Majumder AA. Hypertension in Bangladesh: a review. Indian Heart J. 2012;64(3):319–323. doi: 10.1016/S0019-4832(12)60096-0. [DOI] [PMC free article] [PubMed] [Google Scholar]
- 15.Joshi P, Islam S, Pais P, Reddy S, Dorairaj P, Kazmi K, et al. Risk factors for early myocardial infarction in South Asians compared with individuals in other countries. JAMA. 2007;297(3):286–294. doi: 10.1001/jama.297.3.286. [DOI] [PubMed] [Google Scholar]
- 16.Malik A. Congenital and acquired heart diseases. Bangladesh Med Res Council Bull. 1976;11:14. [PubMed] [Google Scholar]
- 17.Moniruzzamani AT, Rahmani S, Acharyyai A, Islami FA, Ahmedi MSAM, Zamanii MM. Regional Health Forum. 2013. Prevalence of hypertension among the Bangladeshi adult population: a meta-analysis; p. 15. [Google Scholar]
- 18.Saquib N, Saquib J, Ahmed T, Khanam MA, Cullen MR. Cardiovascular diseases and type 2 diabetes in Bangladesh: a systematic review and meta-analysis of studies between 1995 and 2010. BMC Public Health. 2012;12:434. doi: 10.1186/1471-2458-12-434. [DOI] [PMC free article] [PubMed] [Google Scholar]
- 19.Karar ZA, Alam N, Streatfield PK. Epidemiological transition in rural Bangladesh, 1986-2006. Global Health Action. 2009;2. [DOI] [PMC free article] [PubMed]
- 20.Alamgir AKM, Ali SMK, Haque K. Extra salt intake as determinant of high blood pressure. Chest Heart J. 2009;33:127–133. [Google Scholar]
- 21.Moni MA, Rahman MA, Haque MA, Islam MS, Ahmed K. Blood pressure in relation to selected anthropometric measurements in senior citizens. Mymensingh medical journal: MMJ. 2010;19(2):254–258. [PubMed] [Google Scholar]
- 22.Zaman MM. Prevalence of hypertension in a Bangladeshi adult population. J Hum Hypertens. 1999;13:547–549. doi: 10.1038/sj.jhh.1000838. [DOI] [PubMed] [Google Scholar]
- 23.Rahman MM, Gilmour S, Saito E, Sultana P, Shibuya K. Self-reported illness and household strategies for coping with health-care payments in Bangladesh. Bulletin of the World Health Organization, 91(6):449-458 [DOI] [PMC free article] [PubMed]
- 24.Chow CK, Teo KK, Rangarajan S, Islam S, Gupta R, Avezum A, et al. Prevalence, awareness, treatment, and control of hypertension in rural and urban communities in high-, middle-, and low-income countries. JAMA. 2013;310(9):959–968. doi: 10.1001/jama.2013.184182. [DOI] [PubMed] [Google Scholar]
- 25.Zaman MM, Choudhury SR, Ahmed J, Yoshiike N, Numan SM, Islam MS, et al. Plasma lipids in a rural population of Bangladesh. European Journal of Cardiovascular Prevention & Rehabilitation. 2006;13(3):444–448. doi: 10.1097/01.hjr.0000216544.61690.6b. [DOI] [PubMed] [Google Scholar]
- 26.Bangladesh Bureau of Statistics (BBS). Bangladesh population and housing census 2011. Dhaka, Bangladesh: Bangladesh Bureau of Statistics, Government of the People’s Republic of Bangladesh; 2012.
- 27.National Institute of Population Research and Training (NIPORT), Mitra and Associates, and ICF International. Bangladesh Demographic and Health Survey 2011. Dhaka, Bangladesh and Calverton Maryland, USA: NIPORT, Mitra and Associates, and ICF International; 2013.
- 28.MEASURE DHS. Demographic and Health Surveys [www.dhsprogram.com/] [Accessed on November, 2015]
- 29.American Heart Association [www.heart.org] [Accessed on November, 2015]
- 30.World Health Organization. Definition and diagnosis of diabetes mellitus and intermediate hyperglycemia: report of a WHO/IDF consultation. Geneva: World Health Organization (WHO); 2006. http://www.who.int/diabetes/publications/Definition%20and%20diagnosis%20of%20diabetes_new.pdf.
- 31.Basu S, Millett C. Social Epidemiology of Hypertension in Middle-Income Countries Determinants of Prevalence, Diagnosis, Treatment, and Control in the WHO SAGE Study. Hypertension. 2013;62(1):18–26. doi: 10.1161/HYPERTENSIONAHA.113.01374. [DOI] [PubMed] [Google Scholar]
- 32.Shihab HM, Meoni LA, Chu AY, Wang NY, Ford DE, Liang KY, et al. Body mass index and risk of incident hypertension over the life course: the Johns Hopkins Precursors Study. Circulation. 2012. CIRCULATIONAHA-112. doi:10.1161/CIRCULATIONAHA.112.117333. [DOI] [PMC free article] [PubMed]
- 33.Kowal P, Arokiasamy P, Ridaura RL, Yong J, Minicuci N, Chatterji S. Hypertension in developing countries. The Lancet. 2012;380(9852):1471. doi: 10.1016/S0140-6736(12)61840-6. [DOI] [PubMed] [Google Scholar]
- 34.Mayega RW, Makumbi F, Rutebemberwa E, Peterson S, A–stenson C-G, Tomson G, et al. Modifiable socio-behavioural factors associated with overweight and hypertension among persons aged 35 to 60 years in eastern Uganda. PLoS One. 2012;7(10) doi: 10.1371/journal.pone.0047632. [DOI] [PMC free article] [PubMed] [Google Scholar]
- 35.Gupta R, Deedwania PC, Achari V, Bhansali A, Gupta BK, Gupta A, et al. Normotension, prehypertension, and hypertension in urban middle-class subjects in India: prevalence, awareness, treatment, and control. Am J Hypertens. 2013;26(1):83–94. doi: 10.1093/ajh/hps013. [DOI] [PubMed] [Google Scholar]
- 36.Malekzadeh MM, Etemadi A, Kamangar F, Khademi H, Golozar A, Islami F, et al. Prevalence, awareness and risk factors of hypertension in a large cohort of Iranian adult population. J Hypertens. 2013;31(7):1364. doi: 10.1097/HJH.0b013e3283613053. [DOI] [PMC free article] [PubMed] [Google Scholar]
- 37.van de Vijver SJM, Oti SO, Agyemang C, Gomez GB, Kyobutungi C. Prevalence, awareness, treatment and control of hypertension among slum dwellers in Nairobi, Kenya. J Hypertens. 2013;31(5):1018–1024. doi: 10.1097/HJH.0b013e32835e3a56. [DOI] [PubMed] [Google Scholar]
- 38.Lee S-H, Kim Y-S, Sunwoo S, Huh B-Y. A retrospective cohort study on obesity and hypertension risk among Korean adults. J Korean Med Sci. 2005;20(2):188–195. doi: 10.3346/jkms.2005.20.2.188. [DOI] [PMC free article] [PubMed] [Google Scholar]
- 39.Chowdhury MAB, Uddin MJ, Khan HMR, Haque MR. Type 2 diabetes and its correlates among adults in Bangladesh: a population based study. BMC Public Health. 2015;15(1):1070. doi: 10.1186/s12889-015-2413-y. [DOI] [PMC free article] [PubMed] [Google Scholar]
- 40.Bernabe-Ortiz A, Benziger CP, Gilman RH, Smeeth L, Miranda JJ. Sex differences in risk factors for cardiovascular disease: the PERU MIGRANT study. PLoS One. 2012;7(4):e35127. doi: 10.1371/journal.pone.0035127. [DOI] [PMC free article] [PubMed] [Google Scholar]
- 41.Khan RJ, Stewart CP, Christian P, Schulze KJ, Wu L, Leclerq SC, et al. A cross-sectional study of the prevalence and risk factors for hypertension in rural Nepali women.(Research article)(Report) BMC Public Health. 2013;13:55. doi: 10.1186/1471-2458-13-55. [DOI] [PMC free article] [PubMed] [Google Scholar]
- 42.Gupta R, Deedwania PC, Sharma K, Gupta A, Guptha S, Achari V, et al. Association of educational, occupational and socioeconomic status with cardiovascular risk factors in Asian Indians: a cross-sectional study. PLoS One. 2012;7(8):e44098. doi: 10.1371/journal.pone.0044098. [DOI] [PMC free article] [PubMed] [Google Scholar]
- 43.Neuman M, Kawachi I, Gortmaker S, Subramanian SV. Urban-rural differences in BMI in low-and middle-income countries: the role of socioeconomic status. Am J Clin Nutri. 2013;ajcn-045997. http://ajcn.nutrition.org/content/early/2013/01/02/ajcn.112.045997.full.pdf+html. [DOI] [PMC free article] [PubMed]
- 44.Islam MZ, Akhtaruzzaman M, Lamberg-Allardt C. Nutritional status of women in Bangladesh: comparison of energy intake and nutritional status of a low income rural group with a high income urban group. Asia Pac J Clin Nutr. 2004;13(1):61–68. [PubMed] [Google Scholar]
- 45.Shetty PS. Nutrition transition in India. Public Health Nutr. 2002;5(1a):175–182. doi: 10.1079/PHN2001291. [DOI] [PubMed] [Google Scholar]
- 46.Griffiths P, Bentley M. Women of higher socio-economic status are more likely to be overweight in Karnataka, India. Eur J Clin Nutr. 2005;59(10):1217–1220. doi: 10.1038/sj.ejcn.1602228. [DOI] [PubMed] [Google Scholar]
- 47.Rahman M, et al. Behavioural risk factors of non-communicable diseases in Bangladesh. Report submitted to WHO, Dhaka; 2006.
- 48.Bangladesh Bureau of S . Statistics Division, Dhaka: Ministry of Planning, Government of Bangladesh. 2010. Household Income and Expenditure Survey. [Google Scholar]
- 49.Haseen F. Change in food and energy consumption among the ultra poor: is the poverty reduction programme making a difference? Asia Pac J Clin Nutr. 2007;16(1):58–64. [PubMed] [Google Scholar]
- 50.Hypertension Study G. Prevalence, awareness, treatment and control of hypertension among the elderly in Bangladesh and India: a multicentre study. Bull World Health Organ. 2001;79(6):490. [PMC free article] [PubMed] [Google Scholar]
- 51.Khanam MA, Lindeboom W, Razzaque A, Niessen L, Milton AH. Prevalence and determinants of pre-hypertension and hypertension among the adults in rural Bangladesh: findings from a community-based study. BMC Public Health. 2015;15(1):203. doi: 10.1186/s12889-015-1520-0. [DOI] [PMC free article] [PubMed] [Google Scholar]
- 52.Alam MJB, Alam MJB, Rahman MH, Khan SK, Munna GM. Unplanned urbanization: Assessment through calculation of environmental degradation index. International Journal of Environmental Science & Technology. 2006;3(2):119–130. doi: 10.1007/BF03325915. [DOI] [Google Scholar]
- 53.Islam N, Ullah GM. Factors affecting consumers’ preferences on fast food items in Bangladesh. J Appl Bus Res (JABR). 2010;26(4). doi:http://dx.doi.org/10.19030/jabr.v26i4.313.
- 54.Mathenge W, Foster A, Kuper H. Urbanization, ethnicity and cardiovascular risk in a population in transition in Nakuru, Kenya: a population-based survey. BMC Public Health. 2010;10(1):569. doi: 10.1186/1471-2458-10-569. [DOI] [PMC free article] [PubMed] [Google Scholar]
- 55.Joshi MD, Ayah R, Njau EK, Wanjiru R, Kayima JK, Njeru EK, et al. Prevalence of hypertension and associated cardiovascular risk factors in an urban slum in Nairobi, Kenya: A population-based survey. BMC Public Health. 2014;14(1):1177. doi: 10.1186/1471-2458-14-1177. [DOI] [PMC free article] [PubMed] [Google Scholar]
- 56.Walker RW, McLarty DG, Kitange HM, Whiting D, Masuki G, Mtasiwa DM, et al. Stroke mortality in urban and rural Tanzania. The Lancet. 2000;355(9216):1684–1687. doi: 10.1016/S0140-6736(00)02240-6. [DOI] [PubMed] [Google Scholar]
- 57.Abebe SM, Berhane Y, Worku A, Getachew A. Prevalence and Associated Factors of Hypertension: A Crossectional Community Based Study in Northwest Ethiopia. 2015. [DOI] [PMC free article] [PubMed] [Google Scholar]