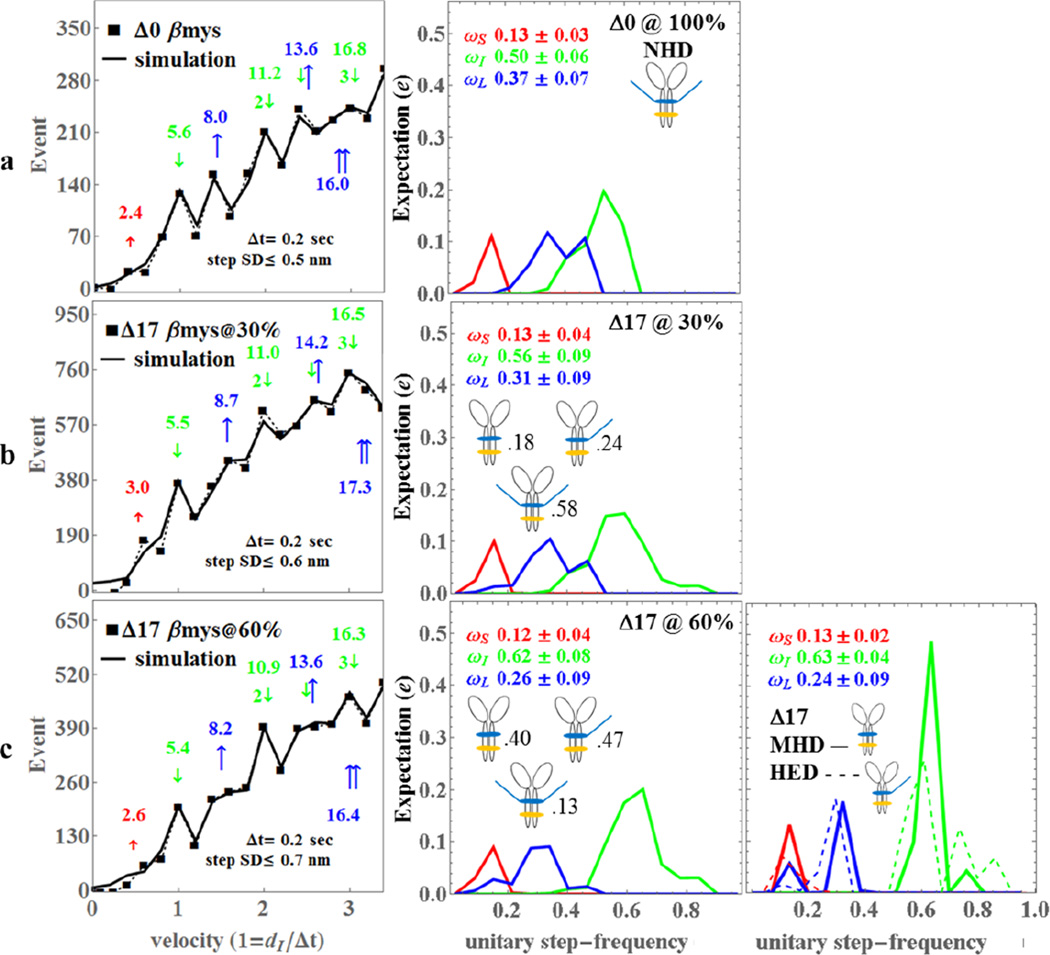
Figure 3.
The Qdot assay event-velocity histogram (left most column) and the unitary step-frequency expectations (middle and right columns) for porcine Δ0 (row a), Δ17βmy@30% with 30% of the vELC’s truncated at residue 17 (row b), and Δ17βmy@60% with 60% of the vELC’s truncated at residue 17 (row c). Left column rows a-c: The event-velocity histogram for unitary step-size data (■ and dashed line) and simulation (solid line) at the low velocity end. Step-sizes correspond to the short (↑red), intermediate (↓green), and long, (↑blue) steps with associated numeric values in nm. Middle column rows a-c: Step-frequency expectation corresponds to the short (red), intermediate (green), and long (blue) step-sizes with numeric mean values ωS, ωI, and ωL ± standard deviation. Step-frequency expectations are derived from simulation of event-velocity histogram data as described in METHODS. Relative fractions of NHD, HED, and MHD are indicated next to their icon. Right column row c: Step-frequency expectations for pure species MHD (truncated vELC homodimer, solid lines) and HED (1 truncated and 1 native vELC heterodimer, dashed lines) are derived as explained in METHODS. Numeric mean values ωS, ωI, and ωL ± standard deviation represent the pure MHD species only. An independent experimental event-velocity histogram was obtained from each of 10–12 acquisitions × 3 separate protein preparations or 30–36 acquisitions for each isoform (Δ0, Δ17@30%, and Δ17@60%). The 30–36 best fitting independent simulations of these data were the basis for the standard deviation estimates indicated in the figure.

