Abstract
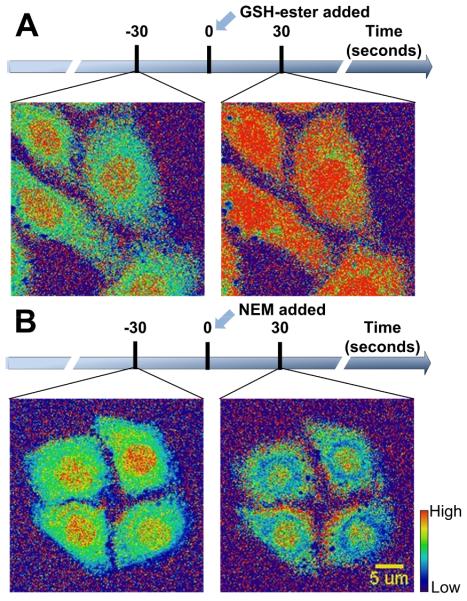
Density functional theory (DFT) was applied to study the thermodynamics and kinetics of reversible thiol-Michael addition reactions. M06-2X/6-31G(d) with the SMD solvation model can reliably predict the Gibbs free energy changes (ΔG) of thiol-Michael addition reactions with an error of less than 1 kcal·mol−1 compared with the experimental benchmarks. Taking advantage of this computational model, the first reversible reaction-based fluorescent probe was developed that can monitor the changes in glutathione levels in single living cells.
Michael addition reactions have recently gained increasing interest in many different fields, including bioconjugation chemistry, design of irreversible small molecule inhibitors, and development of molecular imaging probes.1-3 An example of a Michael addition commonly used for bioconjugation is the thiol-maleimide reaction. This reaction is considered one of the “click” reactions due to its fast reaction rate and aqueous compatibility.1 Some investigational and approved drugs, including afatinib and neratinib, also contain a Michael acceptor moiety, which can irreversibly react with the cysteine residue in the active site to achieve inhibition of the targeted proteins.2 In addition, taking advantage of the reversibility of thiol Michael addition reactions, our group recently reported the first fluorescent probe for quantitative glutathione (GSH) imaging in living cells.3
Due to the broad applications of thiol-Michael addition reactions, it is highly desirable to improve our understanding of the reaction mechanisms and predict the reactivities between thiols and Michael acceptors using computational chemistry.4-6 A generally accepted reaction mechanism for thiol-Michael addition begins with deprotonation of the thiol, followed by conjugate addition of the thiolate to the β-position of the Michael acceptor to form an enolate (Scheme 1). Houk and co-workers tested a series of density functional theory (DFT) based methods to calculate the activation energies and Gibbs free energies of the conjugate additions of MeSH to six α,β–unsaturated ketones and concluded that M06-2X, along with two other DFT methods, gives results within 1 kcal·mol−1 of the CBS-QB3 benchmark values.6 It should be noted that despite the fact that the B3LYP DFT functional has been widely used in computational chemistry, it predicted the energies of thiol Michael additions with substantial inaccuracies.6 Rowley and co-workers suggested that range-separated DFT functionals can improve the accuracy in calculating the energies of thiol Michael additions.5 In both Houk and Rowley’s studies, the accuracies of the DFT methods were compared to high level ab initio calculations as benchmarks instead of experimental values. Rosenker et al. studied the energetics of thiol addition and elimination reactions to bicyclic enones in organic solvents using 1H NMR and DFT calculations and found excellent agreement between experiments and theory.4 Flanagan et al. measured the addition reaction kinetics between a series of acrylamides and GSH in phosphate buffers (pH 7.4) and found that the calculated activation energies are well correlated with the measured reaction rates (R2 = 0.915).7 However, due to the low propensity of thiol elimination from the adducts for the bicyclic enones and the acrylamides, the reverse reactions were not investigated and the equilibrium constants of these reactions cannot be accurately measured.
Scheme 1.
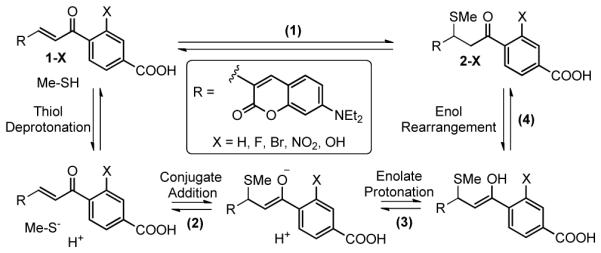
A general scheme for the mechanism of thiol-Michael addition reactions. Compounds 1-X are the GSH probes investigated in this study.
In our previous development of GSH probe ThiolQuant Green (TQG), we identified TQG, which had an appropriate equilibrium constant Kd when reacting with GSH. Unfortunately, both the forward and reverse reaction rates between TQG and GSH are slow; thus, the probe only allows one-point measurements and is unsuitable for following the changes in GSH levels in single cells.3 Our goal in this study is two-fold: to evaluate the accuracies of DFT calculations in predicting the equilibrium constants and reaction kinetics for thiol-Michael addition reactions in aqueous environment using experimental values as benchmarks; and to accelerate the reaction rate of our GSH probe through systematic structural variation and apply the newly developed probe to monitor GSH level changes in single cells for the first time.
A series of TQG analogs were synthesized (1-X, Scheme 1). All the GSH probes showed absorption maxima around 488 nm (representative spectra of 1-OH are shown in Figure 1). Upon reacting with GSH in a phosphate-buffered saline at pH 7.4 (PBS), the absorption and fluorescence peaks of these GSH probes shift hypsochromically (Figure 1). The equilibrium constants between the probes 1-X and GSH were measured by incubating the probes with a series of concentrations of GSH (0.1-80 mM) in PBS under anaerobic conditions for 24 h to ensure equilibrium had been established. It should be noted that due to the reversible nature of the reactions, the ratiometric spectrometric changes of these probes are GSH concentration-dependent instead of time-dependent as we demonstrated previously.3 The Kd values for the reaction between the probes 1-X and GSH were calculated based on the corresponding absorption changes in different concentrations of GSH solutions (Supporting Information (SI), Figure S1). As shown in Table 1, the Kd values are in the range of 0.25−1.43 mM (please refer to the SI for the detailed procedure to calculate the Kd values).
Figure 1.
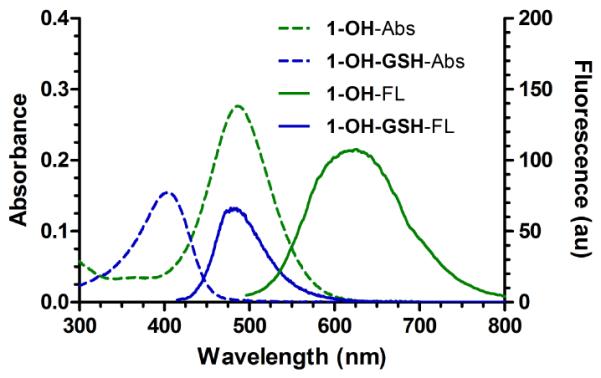
UV-Vis and fluorescence spectra of GSH probe 1-OH (λex = 485 nm) and 1-OH-GSH (λex = 405 nm) in PBS. The spectra of 1-OH-GSH were obtained by measuring the mixture of 1-OH (15 μM) and GSH (80 mM) in PBS.
Table 1.
Experimental and calculated thermodynamic and kinetic parameters for GSH probes 1-Xa
| experiments |
calculations |
||||||
|---|---|---|---|---|---|---|---|
| X | K d b | k f c | k r d | ΔGe | ΔG1e | ΔG2e | ΔG3e |
| H | 0.42 | 0.052 | 4.7 | −4.7 | −4.9 | −2.6 | −35.5 |
| F | 0.51 | 0.10 | 11.5 | −4.6 | −4.4 | −3.1 | −34.4 |
| Br | 1.35 | 0.15 | 35.7 | −4.0 | −4.8 | −3.2 | −34.4 |
| NO2 | 1.43 | 0.18 | 46.6 | −3.9 | −4.0 | −5.0 | −34.1 |
| OH | 0.25 | 1.29 | 6050 | −5.0 | −4.7 | −6.0 | −30.0 |
Kd, kf and kr are the dissociation equilibrium constant, the second-order forward reaction rate constant, and the first-order reverse reaction rate constant of reaction 1 in Scheme 1, respectively.
Units are in mM.
Units are in M−1s−1.
Units are in 10−6 s−1.
Units are in kcal·mol−1. Refer to Scheme S3 in the SI for definitions of ΔG1, ΔG2 and ΔG3.
In order to calculate the Kd values, we employed the M06-2X DFT method following Houk’s previous work.4,6. To simplify the calculations, methylthiol was used to substitute GSH. The Gibbs free energies of thiol-Michael addition reactions (reaction 1 in Scheme 1) were initially calculated by optimizing the geometries of reactants and products in the gas phase with frequency analyses at the M06-2X/6-31G(d) level of theory. Unfortunately, we found that the calculated ΔG in the gas phase (−8.38 kcal·mol−1) deviated significantly from the experimental values in water (−3.97 kcal·mol−1) and concluded that the solvation energies are important to accurately predict the energies of Michael addition reactions. We reoptimized all the reactant and product structures in water using the same DFT functional with the SMD solvation model. As shown in Table 1, accounting for the solvation energies resulted in the calculated Gibbs free energies ΔG1 in excellent agreement with the experimental values ΔG. In Houk’s study, most of the experimental ΔG values for thiol-enone MA reactions were estimated to be ≤−4.6 kcal·mol−1 due to the sensitivity limit of NMR measurements, which renders it impossible to evaluate the accuracy of the calculated ΔG values.4 In our study, all the model reactions were carefully chosen in order to provide precisely measurable ΔG values. It should be noted that the calculated ΔG for 1-Br related reactions has the largest error (0.8 kcal·mol−1), which could be due to the relatively small basis set used. We attempted to re-calculate the bottom-of-well electronic energies using a large basis set 6-311G(2d,p) and other DFT methods at the M06-2X/6-31G(d) geometries and found that the calculated ΔG values have large deviation from the experimental benchmarks (refer to SI for details). Therefore, we concluded that M06-2X/6-31G(d) with the SMD solvation model can reliably predict the Gibbs free energy changes of MA reactions, at least in water, with an error of less than 1 kcal·mol−1 (Table 1).
We also measured the kinetic parameters of both forward and reverse thiol-Michael addition reactions. The forward reaction rate constants kf were determined by monitoring the time-dependent absorption changes of the GSH probes 1-X (479 nm) and the GSH adducts 1-X-GSH (405 nm) when reacting with GSH in PBS (SI, Figure S2). The pseudo first-order rate constants kf' were calculated based on a mono-exponential global fitting of the decay and growth of the absorbance at 479 and 405 nm, respectively. The second order rate constants kf were calculated based on kf' (Table 1). The reverse reaction rate constants kr were measured using preequilibrated mixtures of 1-X and GSH with addition of 5,6-dihydro-2H-pyran-2-one as a GSH scavenger to initiate the retro-Michael addition process (SI, Figure S2). The first order rate constants kr were calculated based on a mono-exponential global fitting of the decay and growth of the absorbance at 405 and 479 nm, respectively (Table 1). It is interesting to note that a faster forward reaction rate is always associated with a faster reverse reaction rate (Table 1).
Precisely predicting the solution-phase reaction rates using computational chemistry is non-trivial due to the difficulty of predicting absolute free energies of solvation for ions and inaccurate estimation of the pre-exponential factors in the Arrhenius equation.8 In other studies, the M06-2X functional has been applied to compare the energy barriers of different reaction pathways and to predict the kinetic isotope effects.9 We attempted to locate the transition state structures of the MA reactions using M06-2X/6-31G(d) with the SMD solvation model, but to no avail. This may be because the attack of the thiolate on the enones has a very small enthalpy barrier, resulting in difficulty in identifying the transition state on the potential energy surface. Based on the Hammett’s linear free-energy relationship, a more exothermic reaction in the rate determining step (RDS) has a lower activation energy barrier. Previous studies established that thiolate conjugate addition (reaction 2 in Scheme 1) is the RDS in MA reactions.6 Therefore, in order to qualitatively compare the reaction rates between the GSH probes, we calculated the Gibbs free energy changes (ΔG2 in Table 1) for the thiolate conjugate addition reactions. Plotting ΔG2 versus log kf afforded a fair linear relationship (SI, Figure S3, R2 = 0.84). Among the GSH probes investigated, compound 1-OH shows the fastest forward reaction rate. This may be due to the hydrogen bonding between the hydroxyl and the carbonyl groups, which stabilizes the enolate intermediate (SI, Figure S4).10 Regarding the reverse reactions, the enolate intermediate should be formed based on the principle of microscopic reversibility. Thurlar and co-workers provided computational analysis for the reaction mechanisms of α,β-elimination of esters and thioesters to support a stepwise first-order elimination from a conjugate base (E1cB) mechanism.11 Based on our computational data, we found that plotting –ΔG3 versus log kr, but not –ΔG1, –ΔG2, or –ΔG4, afforded an excellent linear relationship (SI, Figure S5, R2 = 0.97), which demonstrates that the formation of the enolate intermediates is the RDS for retro-Michael addition reactions and supports an E1cB mechanism.
With the extensive theoretical and experimental investigation of MA reactions, we identified 1-OH as an improved GSH probe that has faster kinetics than TQG. As in our previous study, we applied acetoxymethyl (AM) ester to facilitate cell uptake of the probe, which is designated as 1-OH-AM (Figure 2). The procedure to apply 1-OH-AM for GSH measurements in cells is similar to that for TQG. As shown in Figure 3, HeLa cells were incubated with 1-OH-AM (1 μM) for 30 min and imaged using a confocal micro-scope with both 405 and 488 nm excitations. The ratiometric images (Figure 3D) were generated by dividing the fluorescence intensity values for the 405 nm channel (Figure 3A) by the 488 nm channel (Figure 3B) at each corresponding pixel. The ratio values are proportional to the GSH concentrations.
Figure 2.

Chemical Structures of GSH probe (1-OH) and its cell-permeable form (1-OH-AM).
Figure 3.
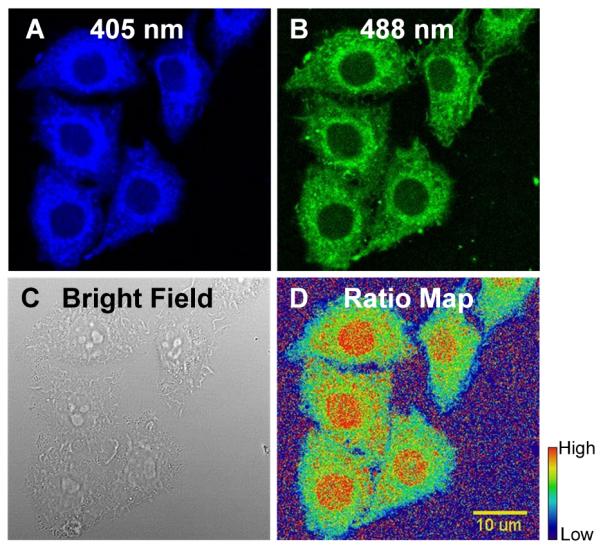
Confocal images and ratio map of HeLa cells stained with 1-OH-AM. Fluorescent images were acquired with (A) λex = 405 nm, λem = 418-495 nm; and (B) λex = 488 nm, λem = 499-695 nm. (C) Bright field image. (D) The ratio map was calculated by dividing the fluorescence intensity values for the 405 nm channel by the 488 nm channel at each corresponding pixel. The ratio values are proportional to the GSH concentrations. In the rainbow scale bar, red and blue represent high and low GSH concentrations, respectively.
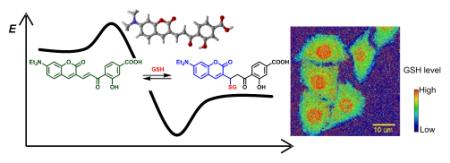
Taking advantage of the reaction reversibility and fast reaction kinetics of 1-OH, we were able to observe the GSH level changes in single cells for the first time. To illustrate the ability of 1-OH to monitor GSH dynamics, a GSH-ester solution (100 μM) was added to the imaging plate to transiently increase the intracellular level of GSH and the same cells were imaged again. Based on the ratiometric images in Figure 4A, we observed an increase in the GSH level in all cells imaged as expected. In a similar experiment, an N-ethylmaleimide (NEM) solution (100 μM) was used as a GSH scavenger and a decrease in the ratio was observed in accordance with the GSH concentration decrease (Figure 4B). Therefore, 1-OH-AM can be a powerful tool to monitor the GSH level changes in single cells upon biological stimulation.
Figure 4.
Time-lapsed ratiometric imaging of the changes of GSH levels in single cells. While HeLa cells were imaged under a confocal microscope, (A) GSH-ester (100 μM) and (B) NEM (100 μM) were added to the culture medium to induce increase and decrease of GSH levels, respectively. The ratiometric images shown are 30 seconds before and after inducing the changes of GSH levels. In the rainbow scale bar, red and blue represent high and low GSH concentrations, respectively.
It should be noted that GSH probes based on irreversible reactions or reversible reactions with inappropriate Kd in aqueous environment12-14 can only reflect the difference in GSH levels in bulk cell lysates or in different cells, but cannot follow the GSH level changes in an individual cell. Furthermore, due to the sluggish reverse reaction rate of TQG, it only allows one-point measurements and is unsuitable for following the changes in GSH levels in single cells.3 Kim et al. reported a GSH probe with a similar structure but without the aqueous solubilizing carboxylic acid group.10 We synthesized Kim’s GSH probe and found it has little aqueous solubility. Kim et al. measured the second-order rate constant between his probe and β-mercaptoethanol to be 6.98×10⁻² M−1s−1, which is only ~5% of the reaction rate for 1-OH. Therefore, due to the hydrophobicity of Kim’s GSH probe, it reacts very slowly with GSH both in the forward and reverse reactions and cannot be used to monitor the GSH level changes in single cells.
In summary, we evaluated a small library of TQG analogs and identified 1-OH as an improved GSH probe that allows for the monitoring of changes in GSH levels in single cells. We extensively measured the thermodynamic and kinetic parameters for the reactions between GSH and the probes, which can serve as experimental benchmarks to evaluate the accuracy of computational methods. We found that M06-2X/6-31G(d) with the SMD solvation model can precisely predict the Gibbs free energy changes for the Michael addition reactions with an error within 1 kcal·mol−1 when compared with the experimental benchmarks. We also discovered that the reaction kinetics of the Michael addition reactions can be qualitatively predicted based on the Gibbs free energy changes of the thiolate conjugate addition reactions. Although this strategy cannot accurately predict the reaction rates, it serves as a convenient method for qualitatively comparing the reaction kinetics of Michael addition reactions without locating the transition states. In addition, our calculations support an E1cB mechanism for the retro-Michael addition reaction, in which the formation of the enolate anions is the RDS. Therefore, this study not only provided a convenient computational method to predict the thermodynamics and kinetics of Michael addition reactions, but also developed the first probe that can monitor GSH level changes in single cells, which is expected to be a powerful tool in redox biology studies.
Supplementary Material
ACKNOWLEDGMENT
This work was supported in part by the National Institutes of Health (R01-GM115622 to JW), the Welch Foundation (Q-1798 to JW), Cancer Prevention and Research Institute of Texas (CPRIT R1104 to JW), the start-up funding from Baylor College of Medicine (to JW), the Texas Advanced Computing Center (TACC) for computational resources, and the Optical Imaging and Vital Microscopy core at Baylor College of Medicine.
Footnotes
Supporting Information
Experimental details for organic synthesis, computational studies, and cell imaging studies. This material is available free of charge via the Internet at http://pubs.acs.org.
REFERENCES
- 1.Saito F, Noda H, Bode JW. ACS Chem Biol. 2015;10:1026. doi: 10.1021/cb5006728. [DOI] [PubMed] [Google Scholar]
- 2.Zhang X, Munster PN. Expert Opin Pharmacother. 2014;15:1277. doi: 10.1517/14656566.2014.913570. [DOI] [PubMed] [Google Scholar]
- 3.Jiang X, Yu Y, Chen J, Zhao M, Chen H, Song X, Matzuk AJ, Carroll SL, Tan X, Sizovs A, Cheng N, Wang MC, Wang J. ACS Chem Biol. 2015;10:864. doi: 10.1021/cb500986w. [DOI] [PMC free article] [PubMed] [Google Scholar]
- 4.Rosenker CJ, Krenske EH, Houk KN, Wipf P. Org Lett. 2013;15:1076. doi: 10.1021/ol400094k. [DOI] [PubMed] [Google Scholar]
- 5.Smith JM, Jami Alahmadi Y, Rowley CN. Journal of Chemical Theory and Computation. 2013;9:4860. doi: 10.1021/ct400773k. [DOI] [PubMed] [Google Scholar]
- 6.Krenske EH, Petter RC, Zhu Z, Houk KN. J Org Chem. 2011;76:5074. doi: 10.1021/jo200761w. [DOI] [PubMed] [Google Scholar]
- 7.Flanagan ME, Abramite JA, Anderson DP, Aulabaugh A, Dahal UP, Gilbert AM, Li C, Montgomery J, Oppenheimer SR, Ryder T, Schuff BP, Uccello DP, Walker GS, Wu Y, Brown MF, Chen JM, Hayward MM, Noe MC, Obach RS, Philippe L, Shanmugasundaram V, Shapiro MJ, Starr J, Stroh J, Che Y. J Med Chem. 2014;57:10072. doi: 10.1021/jm501412a. [DOI] [PubMed] [Google Scholar]
- 8.Marenich AV, Olson RM, Kelly CP, Cramer CJ, Truhlar DG. Journal of Chemical Theory and Computation. 2007;3:2011. doi: 10.1021/ct7001418. [DOI] [PubMed] [Google Scholar]
- 9.Zhao Y, Truhlar DG. Chemical Physics Letters. 2011;502:1. [Google Scholar]
- 10.Kim GJ, Lee K, Kwon H, Kim HJ. Org Lett. 2011;13:2799. doi: 10.1021/ol200967w. [DOI] [PubMed] [Google Scholar]
- 11.Kim Y, Mohrig JR, Truhlar DG. J Am Chem Soc. 2010;132:11071. doi: 10.1021/ja101104q. [DOI] [PubMed] [Google Scholar]
- 12.Chan J, Dodani SC, Chang CJ. Nat Chem. 2012;4:973. doi: 10.1038/nchem.1500. references therein. [DOI] [PMC free article] [PubMed] [Google Scholar]
- 13.Yin C, Huo F, Zhang J, Martinez-Manez R, Yang Y, Lv H, Li S. Chem Soc Rev. 2013;42:6032. doi: 10.1039/c3cs60055f. references therein. [DOI] [PubMed] [Google Scholar]
- 14.Jung HS, Chen X, Kim JS, Yoon J. Chem Soc Rev. 2013;42:6019. doi: 10.1039/c3cs60024f. references therein. [DOI] [PubMed] [Google Scholar]
Associated Data
This section collects any data citations, data availability statements, or supplementary materials included in this article.


