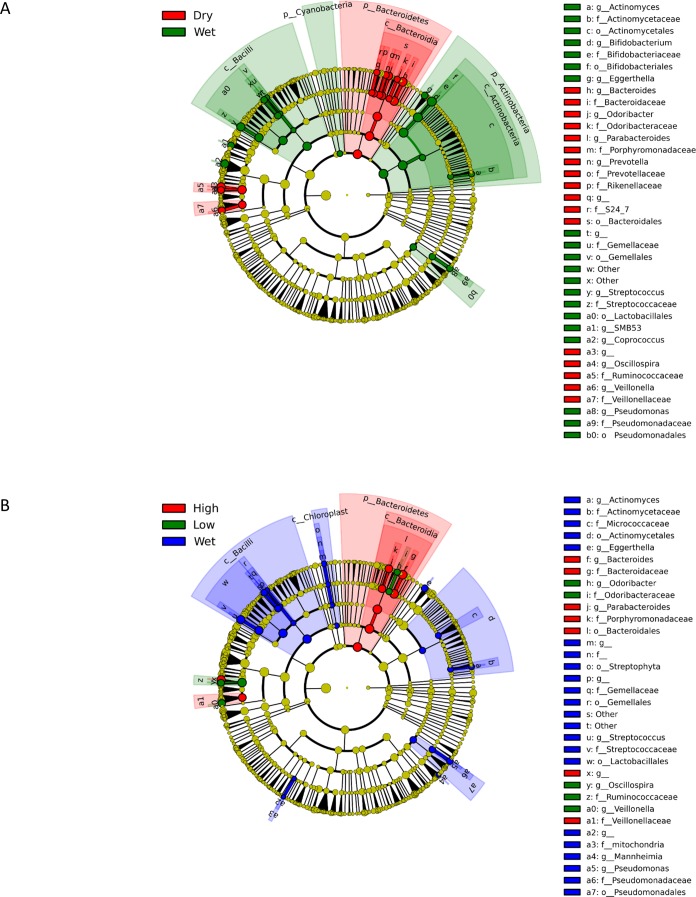
Figure 3. Cladograms representing the taxa enriched under various treatments.
(A) shows the differential features of wet and dry (both high- and low-mass) replicates in an all-against-all comparison (classes = wet and dry; subclasses = wet, high, and low). (B) shows the results separated by high-mass and low-mass as well (classes = wet, high, and low) in a one-against-all comparison.

