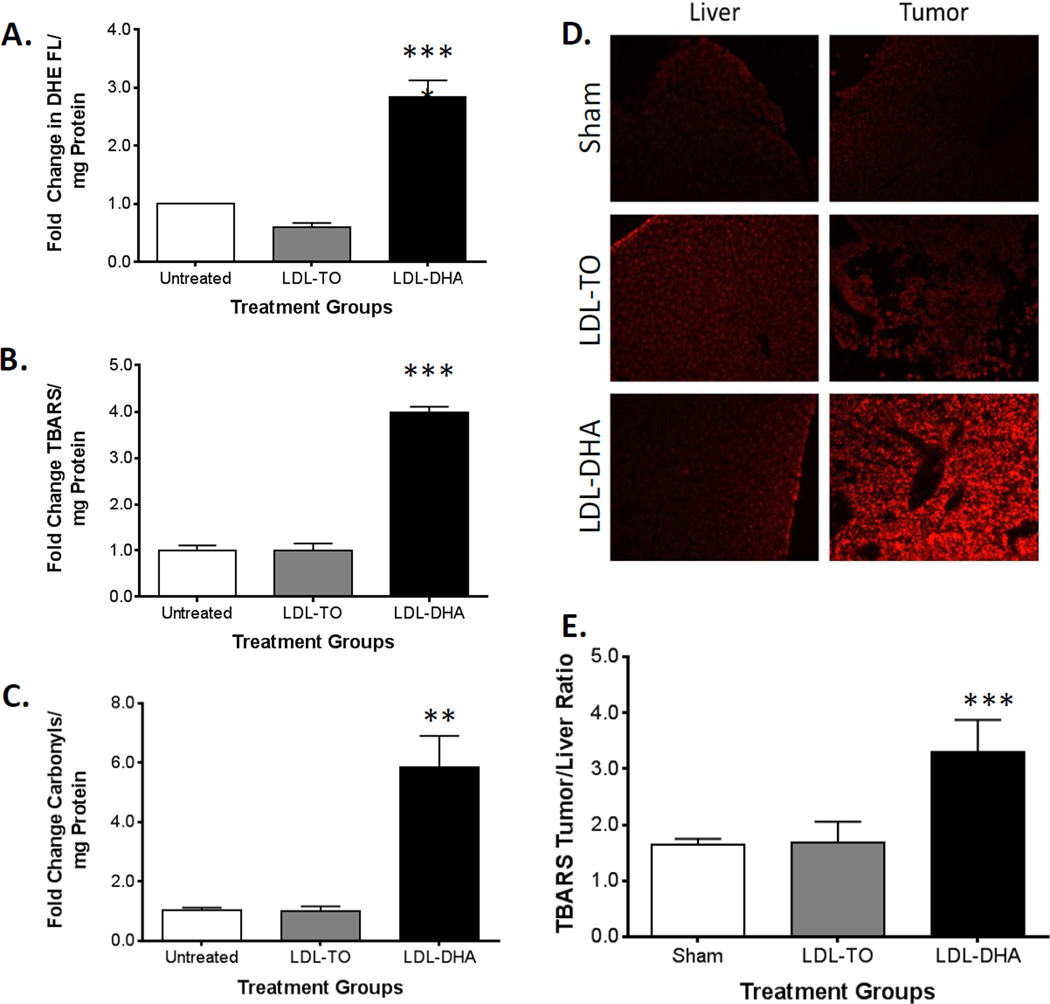
Figure 5. LDL–DHA increases oxidative stress in vitro and in vivo.
Measures of oxidative stress in H4IIE cell after LDL–DHA treatment. (A) Superoxide ROS levels were measured by dihydroethidium fluorescence intensity per mg of cell protein. (B) The TBARS assay measured lipid peroxide levels per mg of cell protein. (C) Protein carbonyls (mg of cell protein) were detected as 2,4-dinitrophenylhydrazine derivatives. All assays were measured in H4IIE cells at Baseline and 48 hours after 40 µM LDL-TO or 40 µM LDL–DHA treatment. Data for the assay are normalized to the untreated control to yield fold change and expressed as mean ± SEM. In vivo superoxide and lipid peroxide levels in HCC 3 days after Sham and HAI treatment of LDL nanoparticles (2 mg/kg). (D) Dihydroethidium fluorescence imaging of tissues was performed at 20× with Texas Red filter (λex= 596). (E) TBARS reading in liver and H4IIE tumor samples. The data are expressed as a ratio of tumor to liver (mean ± SEM) for each treatment group (B). *, P ≤ 0.05; **, P ≤ 0.01; ***, P ≤ 0.001; ****, P ≤ 0.0001 versus untreated or sham groups.

