

Abstract
Zoledronate (Zol) is a third-generation bisphosphonate that is widely used as an anti-resorptive agent for the treatment of cancer bone metastasis. While there is preclinical data indicating that bisphosphonates such as Zol have direct cytotoxic effects on cancer cells, such effect has not been firmly established in the clinical setting. This is likely due to the rapid absorption of bisphosphonates by the skeleton after intravenous (i.v.) administration. Herein, we report the reformulation of Zol using nanotechnology and evaluation of a novel nanoscale metal-organic frameworks (nMOFs) formulation of Zol as an anticancer agent. The nMOF formulation is comprised of a calcium zoledronate (CaZol) core and a polyethylene glycol (PEG) surface. To preferentially deliver CaZol nMOFs to tumors as well as facilitate cellular uptake of Zol, we incorporated folate (Fol)-targeted ligands on the nMOFs. The folate receptor (FR) is known to be overexpressed in several tumor types, including head-and-neck, prostate, and non-small cell lung cancers. We demonstrated that these targeted CaZol nMOFs possess excellent chemical and colloidal stability in physiological conditions. The release of encapsulated Zol from the nMOFs occurs in the mid-endosomes during nMOF endocytosis. In vitro toxicity studies demonstrated that Fol-targeted CaZol nMOFs are more efficient than small molecule Zol in inhibiting cell proliferation and inducing apoptosis in FR-overexpressing H460 non-small cell lung and PC3 prostate cancer cells. Our findings were further validated in vivo using mouse xenograft models of H460 and PC3. We demonstrated that Fol-targeted CaZol nMOFs are effective anticancer agents and increase the direct antitumor activity of Zol by 80 to 85% in vivo through inhibition of tumor neovasculature, and inhibiting cell proliferation and inducing apoptosis.
Keywords: Cancer, Chemotherapy, Zoledronate, Folate-Targeted Nanoscale Metal-Organic Frameworks, Drug Delivery
Graphical abstract

1. Introduction
Zoledronate (Zol) is a third-generation nitrogen-heterocycle-containing bisphosphonate [1-9]. It is widely used as an anti-resorptive agent to prevent cancer metastases in bones [1-9]. Unlike the first-generation bisphosphonates (e.g. etidronate), Zol inhibits bone resorption by directly inhibiting farnesyl diphosphate synthase (FPPS), a key enzyme of the mevalonate pathway. The inhibition of FPPS suppresses geranylation and farnesylation of several key proteins, which in turn activates the production of cell signaling molecules to stop osteoclastic activities [1-9]. Interestingly, in vitro studies also demonstrated that FPPS inhibition can decrease cell proliferation and migration, as well as induce apoptosis [1, 10]. In addition, a number of in vitro and clinical studies demonstrated that Zol efficiently inhibits basic fibroblast growth factor (bFGF) and vascular endothelial growth factor (VEGF) signaling, thus inhibiting blood vessel growth in a tumor [11, 12]. A recent clinical trial in early-stage breast cancer patients showed that adjuvant bisphosphonate treatment reduced not only the chance of cancer metastasis in bones, but also reduced the probability of getting secondary cancers [13], which could be related to the direct cytotoxic effects of Zol [5]. However, clinical translation of Zol as a cytotoxic agent is challenging. Small-molecule Zol has a short circulation half-life (105 min), and its maximum plasma concentration is only about 1 μM (10 - 100 times lower than that required to kill cancer cells in vitro) at recommended dosing [9]. Biodistribution studies indicated that about 55% of i.v.-administrated Zol is rapidly taken up by the skeleton and that the remaining Zol undergoes renal clearance without metabolism [9]. Therefore, high concentrations of Zol is difficult to achieve due to its toxicity.
One strategy to enable the use of Zol as a cytotoxic agent is to utilize nanoscale metaloragnic framework (nMOF) drug delivery. nMOF drug-delivery systems can enhance Zol's biodistribution to tumors and potentially improve its direct anticancer effect [14-17]. Previous reports using liposomes to deliver Zol did indeed show improved pharmacokinetics and biodistribution [16]. However, the drug loading of these Zol-encapsulated liposomes are relatively low (< 10 wt%) [16]. In addition, Zol-encapsulated liposomes only showed moderated antitumor activity in various tumor xenograft models [14-16]. Therefore, we aimed to develop a novel and more effective nMOF formulation of Zol that can be utilized as a cytotoxic agent.
Herein, we reported the fabrication of a new bioresorbable sub-100nm diameter pH-responsive calcium zoledronate (CaZol) nMOF as a potential cytotoxic anticancer agent. We incorporated a targeting ligand, folate (Fol), to facilitate tumor uptake of the CaZol nMOFs because the folate receptor (FR) is frequently overexpressed on tumors. More than two thirds of head-and-neck cancer, prostate cancer, and small and non-small cell lung cancer (SNSCLC) upregulate FR [18]. The cellular uptake and intracellular Zol release mechanisms of these new actively targeted lipid-coated nMOFs have been investigated. The direct anticancer activities (e.g., the ability to inhibit cell proliferation, and the ability to induce cell apoptosis) of small-molecule Zol, non-targeted CaZol nMOFs and Fol-targeted CaZol nMOFs were compared using fast-growing H460 NSCLC and slowing-growing PC3 prostate cancer cell lines [18-20]. The tumor uptake and biodistribution of the Fol-targeted and non-targeted CaZol nMOFs have been investigated in xenograft tumor-bearing mice. Finally, the direct anticancer activities of small-molecule Zol, non-targeted, and Fol-targeted CaZol nMOFs were quantitatively investigated in H460 and PC3 xenograft tumor murine models. Further histopathological studies were performed to investigate the mechanism action of these novel CaZol nMOFs.
2. Materials and Methods
2.1. Materials
Calcium chloride dihydrate (ReagentPlus, ≥ 99.0%), zoledronic acid monohydrate (≥98%), sodium hydroxide (BioXtra, ≥ 98%), cyclohexane (ACS reagent, ≥ 99%), 1-hexanol (anhydrous, > 99%), Triton X-100 (BioXtra), Igepal CO-520, ethanol (ACS reagent, 200 proof, ≥ 99.5%), chloroform (ACS agent, ≥ 99.8%), and Fura-2 pentakis(acetoxymethyl) ester (Fura-2AM) were purchased from Sigma-Aldrich (St. Louis, MO). Dioleoylphosphatydic acid (DOPA); 1,2-dioleoyl-3-trimethylammonium-propane (DOTAP); 1,2-distearoyl-sn-glycero-3-phosphoethanolamine-N-[folate(polyethylene glycol)-2000] (DSPE-PEG2000-Folate); 1,2-distearoyl-sn-glycero-3-phosphoethanolamine-N-[poly(ethylene glycol)2000] (DSPE-PEG 2000); 25-[N-[ (7-nitro-2-1,3-benzoxadiazol-4-yl)methyl]amino]-27-norcholesterol (NBD-labeled cholesterol); and cholesterol were purchased from Avanti Polar Lipids, Inc. (Alabaster, AL). Double-deionized (HPLC grade, sub-micron filtered) were purchased from Fischer Scientific (Hampton, NH). Dulbeco's phosphate buffer saline (0.1 M, PBS) was purchased from Gibco by Life Technologies (Carlsbad, CA).
2.2. Characterization
2.2.1. nMOF Characterization
2.2.1.1. Transmission Electron Microscopy
TEM images were recorded using a Zeiss TEM 910 Transmission Electron Microscope operated at 80 kV (Carl Zeiss Microscopy, LLC, Thornwood, NY) in Microscopy Services Laboratory Core Facility at the UNC School of Medicine. Prior to TEM imaging, concentrated nMOF samples were diluted with chloroform (for the hydrophobic DOPA-coated CaZol nMOFs) or deionized water for the hydrophilic CaZol nMOFs and Fol-targeted liposomes. 5 μL of each diluted sample was mixed with 5 μL of 4 % uranyl acetate aqueous solution before being added to a 400 mesh carbon filmed copper grid via a pipette. Excess nMOF dispersion was removed by filter paper at the edge of copper grid. For the liposome sample, diluted liposomes (5 μL) were mixed with 50 μL of 4 % uranyl acetate aqueous solution before being added to a 400 mesh carbon filmed copper grid via a pipette. Excess nMOF dispersion was removed by filter paper at the edge of copper grid. The recorded TEM images were processed using ImageJ (NIH). Number-average diameter (Dn) was determined based on the average diameter of at least 150 particles from a representative TEM image.
2.2.1.2. Nanoparticle Trackling Analysis
The mean number-average diameter (Dn) and particle concentrations of hydrophilic CaZol nMOFs and liposomes were determined by a nMOF-tracking analysis method recorded on a Nanosight NS500 instrument (Malvern, Inc.).
2.2.1.3. Dynamic Light Scattering and Aqueous Electrophoresis Studies
All nMOF dispersions were diluted to 5 μg/mL prior to the nMOF tracking analysis. Intensity-average diameter (Dh, also known as hydrodynamic diameter) and mean zeta potential (mean ζ) of nMOF dispersions were determined by dynamic light scattering and an aqueous electrophoresis method using a Zetasizer Nano ZS Instrument (Malvern, Inc.). All measurements were based on the average of 3 separate measurements.
2.2.1.4. Thermogravimetric Analysis
Thermogravimetric analysis (TGA) was performed in a TA Instrument Q500 Thermogravimetric Analyzer. The analysis was performed from 20 to 800 °C operated at a heating rate of 20 °C per min in air during which the sample was equilibrated at 100 °C for 10 min prior heat up to 800 °C. This avoid the residual moisture interfere the measurement.
2.2.1.5. Infrared spectroscopy
Infrared spectroscopy was conducted using a Nicolet iS10 FT-IR spectrometer equipped with an Attenuated Total Reflectance (ATR) accessory in Nanomedicines Characterization Core Facility in the School of Medicine at the UNC School of Medicine. The spectral resolution was 4 cm-1 and 128 scans were averaged per spectrum.
2.2.1.6. Energy-dispersive X-ray spectroscopy
Energy-dispersive X-ray spectroscopy (EDS) was performed in a Hitachi S-4700 Field Emission Scanning Electron Microscopy (FE SEM) equipped with an Oxford instruments, INCA PentaFET x3 EDS detector in Analytical and Nanofabrication Laboratory in the Department of Chemistry at the University of North Carolina at Chapel Hill. The sample was prepared by drying a drop of sample onto a carbon tape on a SEM copper grid. FE SEM was conducted at 15 kV.
2.2.1.7. X-ray photoelectron spectroscopy
X-ray photoelectron spectroscopy (XPS) was performed by drying a dilute nMOF sample onto a silicon wafer at room temperature. XPS analysis was conducted using Kratos Axis Ultra DLD X-ray Photoelectron Spectrometer in Analytical and Nanofabrication Laboratory in the Department of Chemistry at the University of North Carolina at Chapel Hill. The XPS spectrometer was equipped with a monochromatic Al X-ray source operating at 6 mA and 15 kV at less than 10-8 torr. The step size was 0.5 eV for the survey spectra (pass energy = 160 eV) and 0.05 eV for high-resolution core-line spectra (pass energy = 80 eV).
2.2.1.8. X-ray Powder Diffraction
X-ray powder diffraction spectrum of dried nMOF sample was recorded using a Rigaku Multiflex Powder Diffractometer in the X-Ray Facility in the Department of Chemistry at the University of North Carolina at Chapel Hill.
2.2.2. Solid content and drug loading determination
The solid content of the DOPA-coated CaZol nMOF dispersion (dispersed in chloroform) was determined by the gravimetric method. Zol loading in the DOPA-coated CaZol nMOFs was determined by a well-documented ultraviolet-visible spectroscopic method. Briefly, 100 μL of the nMOF dispersion with a known weight was dried in a pre-weighted glass vial under a vacuum for 12 h. The solid content of the nMOF dispersion was determined by comparing the weight of the dried vial containing the dried nMOFs and the weight of an empty vial. The dried nMOFs were digested with 500 μL of 0.2 M hydrochloric acid at 20 °C for 24 h. The concentration of Zol in the solution was determined by comparing the absorbance at 215 nm with that of 5 different Zol standards in 0.2 M hydrochloric acid.[17]
Zol loading in the PEGylated lipid-coated nMOF aqueous dispersion was determined using a similar spectroscopic method. Briefly, 100 μL of the nMOF dispersion (with known weight) was freeze-dried in a pre-weighted glass vial. The solid content of the nMOF dispersion was determined by comparing the weight of the dried vial containing the dried nMOFs to the weight of an empty vial. The dried nMOFs were digested with 250 μL of 0.4 M hydrochloric acid at 20 °C for 24 h and mixed with 250 μL of ethanol prior to spectroscopic measurements. The concentration of Zol in the solution was determined by comparing the absorbance at 215 nm with that of 5 different Zol standards in 0.2 M HCl (with 50% ethanol by volume).[17]
2.3. Synthesis
2.3.1. Preparation of hydrophobic DOPA-coated CaZol nMOFs
Hydrophobic DOPA-coated CaZol nMOFs were prepared using the water-in-oil reverse microemulsion method. Sodium zoledronate was prepared in situ by dissolving zoledronate in a NaOH aqueous solution containing the equivalent of 4 moles of NaOH. Bisphosphonate- and calcium-based microemulsions were first prepared. The bisphosphonate-based microemulsion was prepared by mixing (at 800 rpm) 1 mL of 50 mM Zol (in 200 mM NaOH) with 80 mL of a desired oil phase containing 3.2 mL of 20 mM DOPA (in chloroform) at 20 °C for 30 min. The calcium-based microemulsion was prepared by mixing (at 800 rpm) 1 mL of 500 mM CaCl2 solution with 80 mL of the desired oil phase at 20 °C for 30 min. The two microemulsions were combined and stirred (at 800 rpm) at 20 °C for another 30 min, and 160 mL of ethanol was added and stirred at 20 °C for another 20 min to break the emulsion. The resulting dispersion was purified by centrifugation (at 4,500 g for 3 h) and redispersion. At the end of each cycle, the pallets were redispersed in a minimum amount of chloroform and precipitated into an excess amount of ethanol. The centrifugation-redispersion cycle was repeated another 4 times. At the end of the purification cycle, the pallets were resuspended into 5 mL of chloroform. The organic dispersion was centrifuged at 2,000 g for 5 min to remove CaZol NMOFs and aggregated NMOFs that were not fully DOPA-coated. The supernatant containing well-dispersed, DOPA-coated CaZol NMOFs were stored at −20 °C before further use.
[Note: The oil phases used in the preparation of the DOPA-coated CaZol nMOFs were based on different volume ratios (1:0, 2:1, 1:1, 1:2, 0:1 v/v) of the Igepal CO-520-based and the Triton X-100-based oils. The Igepal CO-520-based oil contains 71:29 v/v of cyclohexane and Igepal CO-520 (as surfactant). The Triton X-100-based oil contains 75:15:10 v/v/v of cyclohexane, Triton X-100 (surfactant) and 1-hexanol (co-surfactant).]
2.3.2. Fabrication of active-targeted lipid coating (outer lipid leaflet) onto DOPA-coated CaZol nMOFs
The active-targeted outer lipid leaflet was fabricated onto the hydrophobic DOPA-coated CaZol nMOFs via an optimized film rehydration method. To create the outer leaflet, 1mL of the DOPA-coated CaZol nMOFs was mixed with 400 μL of 20 mM cholesterol, 400 μL of 20 mM DOTAP and 200 μL of Fol-targeted DSPE-PEG2000. The mixture was dried in a vacuum at 20 °C for 18 h. The resulting film was rehydrated with 2 mL of warm deionized water (90 °C) via bath-type sonication (5 min) to facilitate the self-assembly of the outer lipid leaflet. The nMOFs were purified by ultrafiltration (4 times at 3,000 g for 15 min) using an Amicron Ultra ultrafiltration membrane filter with a 100,000 nominal molecular weight cutoff to remove excess lipids.
Non-targeted CaZol nMOFs were prepared using an identical method, except a non-targeted DSPE-PEG2000 was used instead of a Fol-targeted DSPE-PEG2000. Similarly, fluorescent NBD-labeled CaZol nMOFs were prepared using NBD-labeled cholesterol instead of non-labeled cholesterol.
2.3.3. Synthesis of bulk CaZol MOFs
Bulk CaZol MOFs were synthesized using hydrothermal synthesis method, as previous reported [17].
2.3.4. Synthesis of drug-free Fol-targeted liposomes
Drug-free Fol-targeted liposomes were prepared using the as mentioned film rehydration method in the absence of DOPA-coated CaZol nMOFs. Briefly, 400 μL of 20 mM cholesterol, 400 μL of 20 mM DOTAP and 200 μL of Fol-targeted DSPE-PEG2000 were mixed and dried under vacuum at 20 °C for 18 h. The resulting film was rehydrated with 2 mL of warm deionized water (90 °C) via bath-type sonication (5 min) to facilitate the self-assembly of the outer lipid leaflet. The drug-free liposomes were used without further purification.
2.4. Drug release studies
2.4.1. In vitro drug release study
The in vitro drug-release profiles of Fol-targeted CaZol nMOFs were recorded under sink conditions. nMOF solutions at a concentration of 50 μg/mL were split into Slide-A-Lyzer MINI dialysis microtubes (Pierce, Rockford, IL) with a molecular cutoff of 10 kDa and subjected to dialysis against large excess of phosphate buffer saline (500 μL of nMOF dispersion per 1 L of 0.1 M PBS) with gentle stirring at 37 °C. The pH was either 7 or 5. At the indicated time, 20 μL of the solution was removed from the microtubes and digested with 20 μL 0.8 M HCl at 20 °C for 24 h and mixed with 40 μL ethanol prior to the spectroscopic measurement. The concentration of Zol in the solution was determined by comparing the absorbance at 215 nm with that of 5 different Zol standards in 0.2 M HCl in 0.1 M PBS (with 50% ethanol by volume). All measurements were performed in triplicate.
2.4.2. Intercellular drug release study
A total of 1 × 10⁴ cells of H460 or PC3 cells in complete culture media (free of phenol red) were plated separately in 8-well culture slides (Fischer) at 37 °C for 24 h before the intercellular drug-release study. The cells were first washed 3 times with PBS before being incubated with diluted Fura-2AM (1 mM of Fura-2AM in DMSO was diluted 200-fold into PBS) at 37 °C for 1 h. The cells were washed 3 times with PBS to remove excess Fura-2AM. The Fura-2-loaded cells were treated with Fol-targeted CaZol nMOFs containing 5 μM encapsulated Zol or PBS (control) at 37 °C. After the desired incubation period (t = 0 min, 30 min or 2 h), the cells were washed 3 times with PBS and fixed with 4% (by volume) neutral-buffered formalin. Fluorescein images were recorded at an excitation wavelength of 362 nm and emission wavelength of 512 nm (the red channel, which is proportional to the amount of free Fura-2 inside the cells), and an excitation wavelength of 362 nm and emission wavelength of 512 nm (the green channel, which is proportional to the amount of Fura-2-Ca complex formed due to the Ca2+ released from the CaZol nMOFs). The fluorescence intensity recorded at each channel was quantified using ImageJ (NIH).
2.5. In vitro studies
2.5.1. Cell Culture
H460 non-small lung cancer cells and PC3 prostate cancer cells were obtained from American Type Culture Collection (ATCC). H460 cells were cultured using RPMI-1640 medium supplemented with 10 % (v/v) FBS, 2 mM glutamine, 1.5 g/L sodium bicarbonate, 10 mM HEPES buffer (Corning), 1 mM sodium pyruvate, 1 % (v/v) penicillin/streptomycin and 4.5 g/L glucose (Sigma). PC3 cells were cultured in a 1:1 mixture of DMEM and Ham's F-12 medium (Gibco) supplemented with 10 % (v/v) FBS and 1 % (v/v) penicillin/streptomycin (Sigma). The cell density of trypsinized cancer cells were determined by an Orflo Moxi Z Mini Automated Cell Counter (Orflo, Ketchum, ID). Phenol red-free culture media were used in all fluorescent imaging studies.
2.5.2. In vitro cellular uptake study
A total of 1 × 10⁴ H460 or PC3 cells were plated in a 96-well fluorescent imaging plate (Greiner) for 24 h prior to the application of NBD-labeled non-targeted or Fol-targeted CaZol nMOFs containing 5 μM of encapsulated Zol.‖ ‖ At the desired time, the nMOFs were removed, washed 3 times with PBS, and fixed with 4% (by volume) of neutral-buffered formalin. The uptake of Rhod-labeled PEG-PLGA nMOFs was determined via a 96-well plate reader (Infinite® 200 Pro, Tecan i-control) using an excitation wavelength of 485 nm and an emission wavelength of 535 nm. The fluorescent imaging study was performed in an 8-well culture slide (Fischer). A total of 1 × 10⁴ H460 or PC3 cells were plated in an 8-well culture slide (Fischer) for 24 h prior to the application of NBD-labeled Fol-targeted or non-targeted CaZol nMOFs containing 5 μM of encapsulated Zol (100 μL per well). After being incubated for 30 min, the nMOFs were removed, washed 3 times with PBS, and fixed with 4% (by volume) of neutral-buffered formalin, then 4′,6-diamidino-2phenylindole (DAPI/Antifade solution; EHD Millipore, Billerica, MA) was added to label the nucleus. The cell culture slide was imaged on a Zeiss 710 Spectral CLSM in the Microscopy Services Laboratory Core Facility at the UNC School of Medicine.
2.5.3. In Vitro Cytotoxicity Studies
2.5.3.1. MTS Cell Proliferation Assay
In vitro toxicities of small-molecule and encapsulated Zol were evaluated using a cell viability assay. In a 96-well plate, 1 × 10⁴ H460 or PC3 cells were plated 24 h prior to treatment with drug-free Fol-targeted liposomes, small-molecule Zol, non-targeted CaZol nMOFs, and Fol-targeted CaZol nMOFs. Cancer cells were treated with different concentrations of small-molecule or nanoformulation Zol at 37 °C for 2 h. The cells were washed with PBS and allowed to grow in complete cell culture media for 72 h. Cell viability (proliferation) was then analyzed using a 23-(4,5-dimethylthiazol-2-yl)-5-(3-carboxymethoxyphenyl)-2-(4-sulfophenyl)-2H-tetrazolium (MTS) assay according to manufacturer (Promega) instructions. The absorbance at 492 nm (which directly reflects cell viability) was recorded using a 96-well plate reader (Infinite® 200 Pro, Tecan i-control).
2.5.3.2. Early-Stage Apoptosis Assay
Early-stage apoptosis (programmed cell death) in H460 and PC3 cells after in vitro treatment with PBS (control), small-molecule Zol, non-targeted CaZol nMOFs, Fol-targeted CaZol nMOFs was quantified using rhodamine-B-labeled caspase 3 (active) antibodies (Abcam, MA). A total of 1 × 10⁴ H460 or PC3 cells were plated in an 8-well culture slide (Fischer) for 24 h prior to the application of PBS (control), 5 μM of small-molecule Zol, NBD-labeled Fol-targeted or non-targeted CaZol nMOFs containing 5 μM of encapsulated Zol (100 μL per well) for 2 h. The cells were washed 3 times with PBS and incubated with complete culture media (free of phenol red) at 37 °C for 12 h before staining with the Rhod-B-labeled caspase 3 antibody according to manufacturer instructions. The stained cells were imaged on a Zeiss 710 Spectral CLSM in the Microscopy Services Laboratory Core Facility at the UNC School of Medicine.
2.6. In vivo studies
2.6.1. Drug dosing calculation
Zol is a well-established chemotherapy drug. The MTD of Zol in humans was found to be 0.13 mg/kg (8 mg for a 60-kg adult) [21, 22]. The MTD of Zol in mice was estimated using the MTD of Zol in humans and the well-documented human-to-mouse drug dosage conversion factor (12) [23]. Thus, the MTD of Zol in mice is equal to the human-to-mouse dosage conversion factor times the MTD of Zol in human (12 × 0.13 mg/kg ≈ 1.6 mg/kg). The calculated MTD of Zol in mice is comparable with previous in vivo toxicity studies performed with tumor-free mice.
2.6.2. In Vivo Tumor Uptake and Biodistribution Study
The tumor uptake and biodistribution of i.v. administered, NBD-labeled CaZol nMOFs were determined by the standard ex vivo fluorescence imaging method. Xenograft tumors were inoculated in the left flank of male athymic nude mice (6–7 weeks old, 29–30 g; UNC Animal Services Core, Chapel Hill, NC) by subcutaneous injection of 1 × 10⁶ H460 or PC3 cells in 200 μL of a 1:1 (by volume) mixture of serum-free RPMI-1640 (for H460 cells) or a 1:1 mixture of DMEM and Ham's F-12 medium/Matrigel solution. Either 10 (for H460 xenograft tumor-bearing mice) or 14 (for PC3 xenograft tumor-bearing mice) days after tumor inoculation, each mouse was given a tail-vein i.v. injection of NBD-labeled non-targeted CaZol nMOFs or NBD-labeled Fol-targeted CaZol nMOFs containing 1.6 mg/kg of encapsulated Zol. After 48 h, all mice were euthanized by overdose of carbon dioxide. The xenograft tumor, liver, kidney, spleen, heart, and lung were immediately preserved for an ex vivo biodistribution study via IVIS Kinetic Imaging System equipped with an excitation filter of 465 nm and an emission filter of 535 nm in Small Animal Imaging Facility at UNC School of Medicine. All imaging parameters were kept constant for the whole imaging study. Region-of-interest values were recorded using Living Image software as photon flux (also known as radiance) in total photon count per centimeter-squared per steradian (p s-1 cm-2 Sr-1). In the control study, tumor-free Nu mice were given a tail-vein i.v. injection of NBD-labeled Fol-targeted CaZol nMOFs containing 1.6 mg/kg of encapsulated Zol. After 48 h, all mice were euthanized, and the xenograft tumor, liver, kidney, spleen, heart, and lung were immediately preserved in the same manner.
2.6.3. In Vivo Toxicity Study
The in vivo toxicity of small-molecule and encapsulated Zol were evaluated in healthy, tumor-free CD1 mice. In the in vivo study, 10-week-old male CD1 mice (Charles River Laboratory, Durham, NC) were given a tail-vein i.v. injection with 200 μL PBS, drug-free Fol-targeted liposomes, 1.6 mg/kg of small-molecule Zol, or either non-targeted CaZol nMOFs or Fol-targeted CaZol nMOFs containing 1.6 mg/kg of encapsulated Zol. Four days after i.v. injection, each mouse was anesthetized via subcutaneous injection of 100 μL of ketamine hydrochloride/xylazine hydrochloride solution (Sigma; St. Louis, MO). Circulating blood (about 0.6 mL) was collected directly from the heart; 100 μL of each whole-blood sample was stored in an EDTA-coated tube at 5 °C prior to the blood toxicity study in the Animal Clinical Laboratory Core Facility at the UNC Medical School. A 400-μL portion of each whole-blood sample was transferred to a microcentrifuge tube and stored at room temperature for 20 min before being centrifuged at 3,000 g for 5 min to separate the red blood cells from the plasma. The isolated plasma was stored at 5 °C before being submitted to the Animal Clinical Laboratory Core Facility at the UNC Medical School for hepatotoxicity studies.
2.6.4. In Vivo Anticancer Efficiency
Xenograft tumors were inoculated in the left flanks of male athymic nude mice (6–7 weeks old, 28–30 g; UNC Animal Services Core, Chapel Hill, NC) by subcutaneous injection of 1 × 10⁶ H460 or PC3 cells in 200 μL of a 1:1 (by volume) mixture of serum-free RPMI-1640 (for H460 cells) or a 1:1 mixture of DMEM and Ham's F-12 medium/Matrigel solution. After 10 days (for the H460 xenograft tumor) or 14 days (for the PC3 xenograft tumor), the mice were randomly distributed into 5 groups (5 mice per group) for different treatments. Prior to treatment, all mice were ear-tagged, their initial tumor volumes (Vi) were measured by a caliper, and their average body weights were recorded. In treatment, all mice received a single tail-vein i.v. administration of either 200 μL PBS (control group), drug-free (“empty”) Fol-targeted liposomes,# 0.8 mg/kg (half of the MTD) of small-molecule Zol, or 0.8 mg/kg (half of the MTD) of encapsulated Zol (from either non-targeted CaZol nMOFs or Fol-targeted CaZol nMOFs). Tumor volume was measured every 2 to 3 days with a caliper. Tumor volumes were calculated by measuring two perpendicular diameters with a caliper and using the formula V = 0.5 × a × b2, where a and b are the larger and smaller diameters, respectively. The initial tumor volume (Vi) for H460 and PC3 xenograft tumors was found to be 90 ± 7 and 83 ± 5 mm3, respectively. Tumor growth in the different treatment modalities was monitored until the large diameter increased to above 20 mm or the volume increased to above 50 times its initial volume, at which point the animal was euthanized by overdose of carbon dioxide. [N.B. # administered the same amount of lipid coating as in the Fol-targeted CaZol nMOFs; i.e., each mouse received i.v. administration of 200 μL of 245 μg/mL drug-free Fol-targeted liposomes.]
The average growth delay (AGD) and enhancement factor (EF) of each treatment group were defined and calculated according to a well-documented method [24, 25]. Briefly, AGD is the difference between the number of days it took the tumor in the treated group to grow to 40 times (for H460 tumor) or 30 times (for PC3 tumor) its initial volume and the time it took the tumor in the untreated control group (administered with PBS only) to reach the same size. The EF of drug-free Fol-targeted liposomes, non-targeted CaZol nMOFs, and Fol-targeted CaZol nMOFs is the ratio of the AGD of a particular treatment group to the AGD of the treatment group treated with small-molecule Zol.
2.6.5. Tumor Histology
Xenograft tumors were inoculated in the left flanks of male athymic nude mice (6–7 weeks old, 28–30 g; UNC Animal Services Core, Chapel Hill, NC) by subcutaneous injection of 1 × 10⁶ H460 or PC3 cells in 200 μL of a 1:1 (by volume) mixture of serum-free RPMI-1640 (for H460 cells) or a 1:1 mixture of DMEM and Ham's F-12 medium/Matrigel solution. After 10 days (for the H460 xenograft tumor) or 14 days (for the PC3 xenograft tumor), the mice were randomly distributed into 16 groups (3 per group) for different treatments. In treatment, all mice received a single tail-vein i.v. administration of either 200 μLPBS (control group), drug-free (“empty”) Fol-targeted liposomes, 0.8 mg/kg (half of the MTD) of small-molecule Zol, or 0.8 mg/kg (half of the MTD) of encapsulated Zol (from either non-targeted CaZol nMOFs or Fol-targeted CaZol nMOFs). Tumor volume was measured every 2 to 3 days with a caliper.
Mice were euthanized by overdose of carbon dioxide 4 days after treatment. The tumors were collected and fixed in 4% neutral-buffered formalin for 2 days at 5 °C and then in 70% ethanol at 5 °C for another 2 days before being submitted to the Animal Histopathology Core Facility at UNC Medical School for sectioning. CD31, PCNA and caspase-3 immunohistochemistry stains were performed using biological tissue automatic staining machines in the Translational Pathology Lab at the UNC Medical School. Antibodies (CD31 from Abcam, Cambridge, MA; PCNA from Cell Signaling Technology, Danvers, MA; caspase-3 from Cell Signaling Technology, Danvers, MA) were diluted to the desired concentrations in accordance with the manufacturers' instructions before immunohistochemistry stains were conducting using automatic staining machines. All immunohistochemistry stain slides used Hoechst stain to label the nuclei. CD-31-stained tumor sections were imaged using an Olympus IX 81 Inverted Wide-Field Light Microscope in the Microscopy Services Laboratory at the UNC Medical School. PCNA- and caspase-3-stained tumor sections were imaged on a Zeiss 710 Spectral CLSM in the Microscopy Services Laboratory Core Facility at the UNC School of Medicine. Confocal fluorescent images were processed using ImageJ (NIH).
2.7. Statistical Analysis
Quantitative data were expressed as mean ± SEM. The analysis of variance was completed using a one-way ANOVA in Graph Pad Prism 6 software pack. p < 0.05 was considered statistically significant.
3. Results
3.1. Synthesis and Characterization of Fol-Targeted CaZol nMOFs
Fol-targeted CaZol nMOFs were synthesized in two steps (Fig. 1). Hydrophobic DOPA-coated CaZol nMOFs were synthesized via the water-in-oil reverse microemulsion method (mFig. 1) [27]. Zol was converted to sodium zoledronate (Na4Zol) in situ prior to the preparation of a bisphosphonate-based microemulsion. Amphiphilic lipid DOPA was added to the bisphosphonate-based microemulsion as a surfactant to stabilize the microemulsion and the resulting nMOFs. Combining two microemulsions led to the formation of DOPA-coated CaZol nMOFs due to inter-micellar exchange [27]. By adjusting the volume ratio of Igepal CO-520-based and Triton X-100-based oil phases, spherical DOPA-coated CaZol nMOFs varying from 10 to 100 nm in diameter were successfully synthesized (Fig. 2a). As shown in the transmission electron microscopy (TEM) images (Fig. 2a) and intensity-average diameter (Dh) curves determined by the dynamic light scattering (DLS) technique (Fig. S1), the particle diameter and polydispersity of the DOPA-coated CaZol nMOFs increased with the Triton X-100-based oil volume fraction. Small nMOFs coexisted with larger but less spherical sub-100nm diameter nMOFs when the Igepal CO520-to-Triton X100 system volume ratio increased to above 1:2 (Fig. 2a). This is because the water-to-surfactant molar ratio (Tables S1-S3) decreases with the inter-micellar exchange rate between two microemulsions. A higher exchange rate between micelles yields a larger number of smaller particles, but a slower exchange rate between micelles leads to the formation of fewer nuclei and results in fewer large particles and more polydisperse particles [28], Previous in vivo studies revealed that 50 to 100nm diameter monodisperse PEGylated lipid-coated CaP nMOFs are ideal for tumor uptake after systemic administration (i.e., i.v. administration) due to the enhancement permeability and retention (EPR) effect [27, 29]. Thus further studies focus on the DOPA-coated CaZol nMOFs prepared using a 1:1 v/v of Igepal CO-520/Triton X-100-based oil phases with a mean Dn of 57nm and a mean Dh of 68nm (polydispersity index, PDI = 0.152).
Fig. 1.
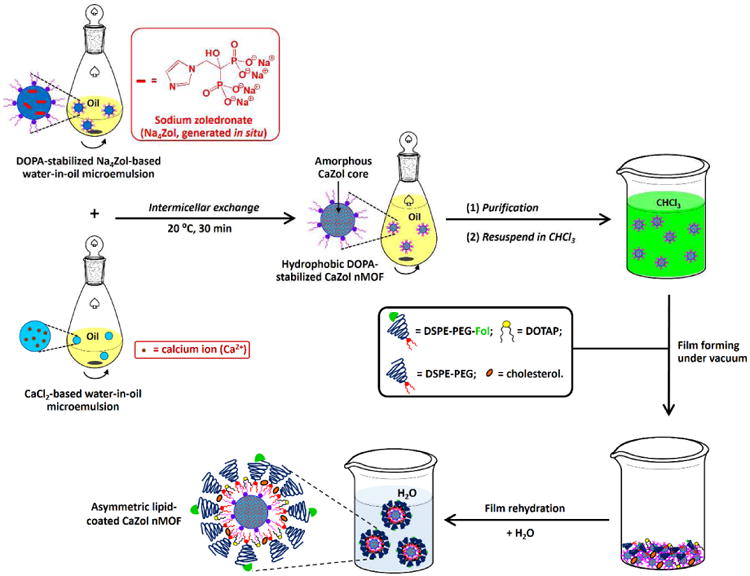
Synthesis of Fol-targeted CaZol nMOFs. Hydrophobic DOPA-coated CaZol nMOFs were prepared via the water-in-oil microemulsion method. The hydrophilic Fol-targeted lipid-coating was fabricated onto the hydrophobic DOPA-coated CaZol nMOFs via the film rehydration method. Table S4 shows the chemical structures of lipids in the inner and outer lipid leaflets of the Fol-targeted CaZol nMOFs.
Fig. 2.

Characterization of hydrophobic DOPA-coated CaZol nMOFs. (a) TEM images recorded for DOPA-coated CaZol nMOFs prepared using oils with different volume ratios of Igepal-based and Triton-based oil systems. The Igepal-based oil system is composed of a 71:29 v/v of cyclohexane and Igepal CO-520. The Triton-based oil is composed of a 75:15:10 v/v/v of cyclohexane, Triton X-100, and 1-hexanol. The diameters of the CaZol nMOFs increase as the volume fraction of the Triton-based oil phase increases. The pink arrow highlights the small, irregularly shaped CaZol nMOFs. (b) TGA curves recorded for (i) DOPA, (ii) CaZol bulk powder, and (iii) DOPA-coated CaZol nMOFs. It was calculated that the DOPA-coated CaZol nMOFs contained 12.7wt% of garfted DOPA.‡ (c) An energy-dispersive X-ray spectrum recorded for DOPA-coated CaZol nMOFs. The inset table summarizes the bulk composition of the DOPA-coated CaZol nMOFs. (d) (i) XPS survey spectrum recorded for DOPA-coated CaZol nMOFs. The inset table summarizes the surface composition of the DOPA-coated nMOFs. (N.B. # the C and N bands are affected by the background of carbon tape used to hold the powders for the EDS study.) (ii) P 2p core-line spectrum recorded for the DOPA-coated CaZol nMOFs. The strong P 2p band can be attributed to the P atoms in the DOPA (stabilizer) and Zol (core of the nMOF). (iii) N 1s core-line spectrum recorded for the DOPA-coated CaZol nMOFs. The strong N 1s band can be attributed to the N atom in Zol's imidazole ring. (e) Assigned ATR FT-IR spectra recorded for (i) DOPA, (ii) deprotonated Zol (Na4Zol), and (iii) dried DOPA-coated CaZol nMOFs. [N.B. ‡ By comparing the wt% of bulk CaZol and DOPA-coated CaZol nMOFs remained at 800°C, the amount of grafted DOPA in the DOPA-coated CaZol nMOFs = 100wt% – (wt% of the DOPA-coated CaZol nMOFs remained at 800°C)/(wt% of the bulk CaZol MOFs remained at 800°C) = 100wt% - (100.0wt% - 41.4wt%)/(100.0wt% - 32.9wt%) = 12.7 wt %]
The selected hydrophobic DOPA-coated CaZol nMOFs were further characterized by complementary characterization techniques. An X-ray powder diffraction (XRD) study indicated the DOPA-coated CaZol nMOFs have a broad and diffused diffraction band centered at 2θ = 24° (Fig. S2). Thermal analysis revealed that the DOPA-coated CaZol nMOFs contained 12.7wt% of grafted DOPA (Fig. 2b). Elemental microanalysis via energy-dispersive X-ray spectroscopy (EDS) revealed that the DOPA-coated CaZol nMOFs contained 11.7mol% Ca atoms and 8.5mol% P atoms (with a Ca/P molar ratio of 1.4); EDS revealed trace amount (0.5mol%) of Cl atoms, but no sodium atoms (Fig. 2c). The EDX and XRD studies indicated that the CaZol nMOFs are structurally similar to the amorphous hydroxyapatite in bone [30]. X-ray phototelectron spectroscopy (XPS) revealed that the surface of the CaZol nMOFs contain 2.1mol%, 6.7mol%, and 7.0mol% of N, Ca, and P atoms (Fig. 2d), respectively. The surface Ca/P molar ratio is approximately 1, suggesting that all phosphate groups from DOPA and Zol on the surface of the nMOFs have been deprotonated and coordinated to Ca2+. The high surface P/N molar ratio of 3.3 confirmed that nitrogen-free DOPA is on the surface of the nMOFs. Fourier transform infrared (FTIR) spectroscopy further confirmed the structure of the DOPA-coated CaZol nMOFs. The FTIR spectrum of the DOPA-coated CaZol nMOFs (Fig. 2e) showed a characteristic C-N stretching band at 1570 cm-1, a broad C=C stretching band at 1430 cm-1 due to the imidazole ring in Zol, a very strong and broad P=O stretching band at 1150 cm-1 and a P-O stretching band at 1070 cm-1 due to the deprotonated phosphate groups from DOPA and Zol [31]. In addition, a vibration band can be observed at 1740 cm-1, and it can be attributed to the C=O stretching from the ester group of the adsorbed DOPA. The drug loading of the DOPA-coated CaZol nMOFs was found to be 76wt %, using UV-visible spectroscopy method [17].
Polyethylene glycol (PEG) grafting density and surface lipids composition directly affect the colloidal stability, pharmacokinetics and biodistribution of PEGylated nMOFs [32, 33]. A Fol-targeted outer lipid leaflet composite of cholesterol (Chol), 1,2-dioleoyl-3-trimethylammonium-propane (DOTAP), 1,2-distearoyl-sn-glycero-3-phosphoethanolamine-N-(methoxy(polyethylene glycol)-2000) (DSPE-PEG2000) and 1,2-distearoyl-sn-glycero-3-phosphoethanolamine-N-(folate(polyethylene glycol)-2000) (DSPE-PEG200-Fol) was engineered onto the surface of the hydrophobic DOPA-coated CaZol nMOFs via the film rehydration method (Fig. 1 and Table S4). During the film rehydration process, the preassembled DOPA-based inner lipid aids the self-assembly of the outer lipid leaflet [27]. Small amphiphilic lipids (cholesterol and DOTAP) were added to engineer the outer lipid leaflet to fill the spaces between the larger PEGylated lipids, preventing their dissociation from the nMOFs [27, 33]. Non-targeted CaZol nMOFs were prepared using an identical method except pure non-targeted DSPE-PEG was used to prepare the PEGylated outer lipid coating. Fluorescent CaZol nMOFs were prepared using the same method except 7-nitro-2,1,3-benzoxadiazol-4-yl (NBD)-labeled cholesterol was used instead of unlabeled cholesterol to prepare the outer lipid leaflet.
The successful fabrication of an outer Fol-targeted lipid leaflet was confirmed by TEM, DLS and the nanoparticle tracking analysis (NTA) methods. The TEM image of the Fol-targeted CaZol nMOFs shows a characteristic core-shell structure (Fig. 3a) because lipids have lower electron densities than CaZol. The diameter of the Fol-targeted CaZol nMOFs is significantly smaller than that of Fol-targeted liposomes prepared in the absence of DOPA-coated CaZol nMOFs (Fig. 3a), suggesting the successful fabrication of asymmetric lipid-coated CaZol nMOFs rather than the formation of the CaZol nMOF-encapsulated liposomes. DLS measurement (Fig. 3b) revealed that the mean Dh (and PDI) of the CaZol nMOFs increased from 68nm (PDI = 0.152) to 112nm (PDI = 0.186) upon fabrication of the outer lipid leaflet due to the presence of long hydrated PEG chains in the outer lipid leaflet. However the mean Dh of the nMOFs is significantly smaller than that of the Fol-targeted liposomes (mean Dh = 156 nm, PDI = 0.231; Fig. 3b). An NTA study indicated that the mean Dn of Fol-targeted CaZol nMOFs (115 nm, Fig. 3c) was significantly smaller than that of Fol-targeted liposomes prepared in the absence of DOTA-coated CaZol nMOFs. In addition, the NTA study indicated that the number of particle formed in the presence of DOPA-coated CaZol nMOFs was about twice that of the Fol-targeted liposomes (Fig. 3c). This indicates that the CaZol nMOFs are stabilized by an asymmetrical layer of lipids rather than encapsulating inside Fol-targeted liposomes. An aqueous electrophoresis study confirmed the presence of anionic DSPE-PEG-Fol on the surface of the CaZol nMOFs with a mean zeta potential (ζ) of -12.3 mV (in 1mM NaCl, pH 7) that was much lower than a near-zero mean ζ of + 0.2 mV (in methanol) recorded for the DOPA-coated CaZol nMOFs. Thermal analysis indicated the Fol-targeted CaZol nMOFs contained approximately 32.3 wt% of outer lipid coating (Fig. 3d). A further UV-visible spectroscopic study revealed that the Fol-targeted CaZol nMOFs encapsulated 50.6 wt% Zol.
Fig. 3.
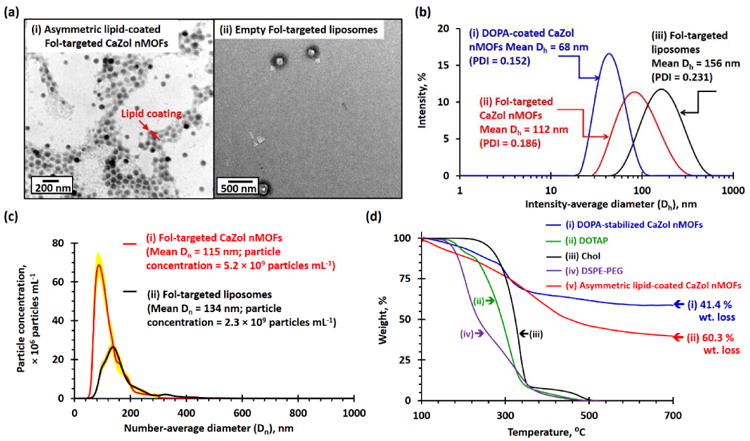
Characterization of Fol-targeted PEGylated CaZol nMOFs. (a) TEM images recorded for (i) asymmetric lipid-coated Fol-targeted CaZol nMOFs and (ii) Fol-targeted liposomes prepared in the absence of DOPA-coated CaZol nMOFs. (b) Number-average diameter (Dn) distribution curves recorded for 5 μg/mL of (i) Fol-targeted CaZol nMOFs and (ii) Fol-targeted liposomes prepared in the absence DOPA-coated CaZol nMOFs, as determined by the NTA method. Calculations showed that 5 μg/mL of the Fol-targeted nMOFs contain 5.2 × 10⁹ particles per mL and that 5 μg/mL of Fol-targeted liposomes contain 2.3 × 10⁹ particles per mL. Thus, the average weight of each Fol-targeted CaZol nMOF is 9.6 × 10⁻¹⁶ g, and the average weight of each Fol-targeted liposome is 2.2 × 10⁻¹⁵ g. (c) Intensity-average diameter (Dh) distribution curves recorded for (i) DOPA-coated CaZol nMOFs (dispersed in chloroform), (ii) Fol-targeted CaZol nMOFs, and (iii) Fol-targeted liposomes prepared in the absence of DOPA-coated CaZol nMOFs. (d) TGA curves recorded for (i) DOPA-coated CaZol nMOFs, (ii) DOTAP, (iii) cholesterol (Chol), (iv) DSPE-PEG, and (v) asymmetric, lipid-coated Fol-targeted CaZol nMOFs. It was calculated that the Fol-targeted CaZol nMOFs contained 32.3wt% of outer lipid coating.‡ [N.B. ‡ By comparing the wt% of DOPA-coated CaZol NPs and Fol-targeted CaZol nMOFs remained at 800°C, the amount of outer Fol-targeted lipid coating in the Fol-targted CaZol nMOF = 100wt% – (wt% of the Fol-targeted CaZol nMOFs remained at 800°C)/(wt% of the Fol the DOPA-coated CaZol nMOFs remained at 800°C) = 100wt% – (100.0wt% -60.3wt%)/(100.0wt% - 41.4wt%) = 32.3wt%]
3.2. Cellular Uptake and Endosomal Escape of the Fol-Targeted CaZol nMOFs
Poor cellular uptake of long circulation PEGylated nMOFs caused a major challenge in nanomedicine [32, 34]. More than two-thirds of NSCLC, ovary and prostate tumors have overexpressed folate receptors [18]. The introduction of Fol ligands to the PEGylated CaZol nMOFs provides a unique opportunity to enhance the uptake of the CaZol nMOFs. A time-dependent cellular uptake study indicated that H460 and PC3 cells took up about 22% and 12%, respectively, of the incubated NBD-labeled Fol-targeted CaZol nMOFs after being incubated for 2h, respectively, which are about 5 to 6 times more than that of non-targeted CaZol nMOFs (Fig. S3a). The confocal fluorescence images of the H460 and PC3 cells (Fig. S3b) recorded 2h after being incubated with the NBD-labeled Fol-targeted CaZol nMOFs confirmed with fluorescence that the Fol-targeted nMOFs were rapidly internalized into the cancer cells and equally distributed in the cytoplasm.
Amorphous calcium phosphates (e.g., bones) have good chemical stability under physiological conditions but rapidly decompose at acidic environments [30]. A time-dependent DLS study confirmed that the Fol-targeted CaZol nMOFs establish excellent colloidal stability and a high-ionic-strength physiological buffer under physiological conditions (37°C, pH 7; Fig. S4). A quantitative drug release study indicated that an insignificant amount (less than 5%) of the encapsulated Zol was released from the Fol-targeted CaZol nMOFs under sink conditions at pH 7 (0.1M PBS, 37 °C; Fig. 4a). The rate of Zol release significantly increased when the pH of the PBS decreased to 5 (that of the endosome; Fig. 4a) due to the protonation of Zol (pKa1 = 5.9) [35]. At pH 5, approximately half of the encapsulated Zol was released from the particles in the first 3.5h and nearly all of the encapsulated Zol was released in 24h (Fig. 4a) [36]. The pH-dependent study indicates the optimized nMOF preparation conditions and the strong chelating character of fully deprotonated Zol significantly improved the stability of the CaZol nMOFs at physiological pH (pH 7) and prolonged drug release in acidic environments (e.g., inside endosomes) compared with other calcium phosphate-based drug delivery systems [27, 29, 37, 38].
Fig. 4.

Drug-release mechanism of Fol-targeted CaZol nMOFs. (a) In vitro drug-release kinetics of Fol-targeted CaZol nMOFs under sink conditions at pH 7.0 and pH 5.0 (in 0.1 M PBS at 37 °C). Insert shows chemical structure of deprotonated Zol in CaZol nMOF. pKa of Zol = 5.9, 8.3[35]. (b) Fluorescence images of Fura-2-loaded PC3 cells recorded (i) immediately, (ii) 30 min, and (iii) 2 h after being incubated with 1 μM of Fol-targeted CaZol nMOFs; and recorded (iv) after incubation in 0.1 M PBS for 2 h (control) at an excitation wavelength of 362 nm and an emission wavelength of 512 nm (the red channel, which is proportional to the concentration of free Fura-2) and an excitation wavelength of 362 nm and an emission wavelength of 512 nm (the green channel, which is proportional to the concentration of the Fura-2-Ca complex due to the Ca2+ released from the CaZol nMOFs). Bar chart summarizing the ratio of fluorescence intensities at 478 nm and 505 nm, which is proportional to the concentration of unbound Fura-2. (Fig. S3 shows the intracellular release of free Ca2+ ions from Fol-targeted CaZol nMOFs in the H460 lung-cancer cell line.) (c) Cartoon shows the cellular uptake, intercellular Ca2+ and Zol release mechanism of CaZol nMOFs and the formation of the Fura-2-Ca complex.
The intracellular Zol release mechanism was utilized in H460 and PC3 cells loaded with Fura-2. Fura-2 is an intracellular calcium indicator that, upon binding free intracellular Ca2+ and forming a stable Fura-2-Ca complex [29, 39], blue-shifts its emission band from 512 nm (upon excitation at 362 nm, in the “red” channel) to 505 nm (upon excitation at 335 nm, in the “green” channel). Figs. 4b and S5 show fluorescence images of Fura 2-loaded PC3 and H460 cells recorded before, 30min after, and 2h after incubation with Fol-targeted CaZol nMOFs containing 2μM Zol or just PBS (control). A time-dependent fluorescence imaging study indicated that the fluorescence intensity in the red channel progressively decrease, while the fluorescence intensity in the green channel progressively increased after being incubated with Fol-targeted CaZol nMOFs, indicating the formation of Fura-2-Ca complex. Quantitative image analyses (Fig. 4b and S5b) revealed that about 70% of intercellular Fura-2 was bound to the Ca2+ ions after incubation with the CaZol nMOFs for 30min and that nearly all Fura-2 became bound to Ca2+ ions after incubation with CaZol nMOFs for 2h (Fig. 4c). Conversely, incubating the Fura 2-labeled cells with PBS for 2h did not significantly change the fluorescence intensity at 512nm. This indicates that the CaZol nMOFs progressively release Ca2+ and Zol after entering the cancer cells via endocytosis. The released Ca2+ bound to the intercellular Fura-2 led to the formation of green emission Fura-2-Ca complex (Fig. 4c).
3.3. In Vitro Toxicity of Non-Targeted and Fol-Targeted CaZol nMOFs
The in vitro toxicities of small-molecule (“free”) Zol, empty (“drug-free”) Fol-targeted liposomes, and both non-targeted and Fol-targeted CaZol nMOFs in H460 and PC3 cell lines were first evaluated using a 3-(4,5-dimethylthiazol-2-yl)-5-(3-carboxymethoxyphenyl)-2-(4-sulfophenyl)-2H-tetrazolium (MTS) cell proliferation assay. A concentration-dependent study (Figs. 5a and 5b) indicated that the Fol-targeted CaZol nMOFs were more efficient than small molecule Zol at inhibiting the proliferation of H460 and PC3 cell lines in culture. The half maximal inhibitory concentration (IC50, inhibition of cell growth by 50%) of the Fol-targeted CaZol nMOFs were found to be 2.3 μM (concentration of encapsulated Zol) in H460 and 1.7 μM in PC3 cell lines, which are 6 to 19 times higher than the concentrations for small-molecule Zol (Figs. 5a and 5b). On the other hand, non-targeted CaZol nMOFs showed much lower cytotoxicity (IC50 > 50 μM) in both cell lines. This indicated that increased cellular uptake and prolonged drug release kinetics of the Fol-targeted CaZol nMOFs significantly improved the growth inhibition efficiency of Zol in both FR-overexpressing cell lines.
Fig. 5.

In vitro toxicities of small-molecule (“free”) Zol, non-targeted and Fol-targeted CaZol nMOFs. Cell viabilities of (a) H460 and (b) PC3 cells after treatment with different concentrations of (i) drug-free Fol-targeted liposomes, (ii) small-molecule Zol, (iii) non-targeted CaZol nMOFs, and (iv) Fol-targeted CaZol nMOFs, as determined by a MTS cell-proliferation assay. (c) Early-stage apoptosis in H460 and PC3 cells. Confocal fluorescence images of (i) H460 and (ii) PC3 cells recorded after treatment with 5 μM of free Zol, NBD-labeled non-targeted CaZol nMOFs and Fol-targeted CaZol nMOFs containing 5 μM of encapsulated Zol for 2 h and incubation under physiological conditions for another 12 h before staining with Rhod-labeled caspase 3 (CASP 3, which is red fluorescent and an early-stage apoptosis marker). Fig. S6 shows confocal fluorescence images recorded for H460 and PC3 cells treated with 0.1 M PBS (control). (N.B. # containing the same amount of lipid coating as in the Fol-targeted CaZol nMOFs; e.g., 1 μM encapsulated Zol = 0.27 μg/mL of Fol-targeted CaZol nMOFs because Zol makes up 50.6 wt% of each Fol-targeted CaZol nMOF; the weight of a Fol-targeted CaZol nMOF is 9.6 × 10⁻¹⁶ g, and the weight of each drug-free Fol-targeted liposome is 2.2 × 10⁻¹⁵ g; and 1 μM of encapsulated Zol in a CaZol nMOF contains 1.2 μg/mL of Fol-targeted lipid coating; * p < 0.05, which is statistically significant.)
Caspase 3 antibody was used to quantify an early-stage programmed cell death (apoptosis) induced by the small-molecule and encapsulated Zol [40]. Figs. 5c and S6 show confocal fluorescence images of caspase 3 antibody-stained H460 and PC3 cells recorded 12h after treatment with PBS (control), 5 μM of small-molecule Zol, and NBD-labeled targeted and non-targeted CaZol nMOFs containing 5 μM of encapsulated Zol for 2h. Both cell lines showed very low caspase 3 activities (red fluorescence) after incubation with PBS. The caspase 3 activities significantly increased after incubation with small-molecule Zol. Quantitative image analyses (Fig. 5c) indicated that the caspase 3 activities increased by about 100% in H460 cells and nearly 180% in PC3 cells after the in vitro treatment with the small-molecule Zol, as compared to the control groups that were incubated with PBS (Fig. S6). In vitro treatment with Fol-targeted CaZol nMOFs significantly increased the caspase 3 activities by 230% and 300% in H460 and PC3 cell lines, respectively, compared the control groups. On the other hand, in vitro treatment with non-targeted CaZol nMOFs only increased the caspase 3 activities by 40 – 50% when compared to the corresponding control groups. The lower apoptotic activities recorded for the non-targeted CaZol nMOFs were due to the non-targeted nMOFs have relatively low cellular uptake when compared to Fol-targeted nMOFs, as justified by the higher NBD fluorescence intensity recorded for the cells incubated with the Fol-targeted nMOFs (Fig. 5c). The in vitro toxicity study indicated that the Fol-targeted CaZol nMOFs were more efficient than the small-molecule Zol at inhibiting the growth and inducing the apoptosis of H460 and PC3 cells; this effect was likely due to the slow-drug release kinetics of the CaZol nMOFs.
3.4. Tumor Uptake, Biodistribution and Systemic Toxicity of Non-Targeted and Folate-Targeted CaZol nMOFs
Tumor uptake and biodistribution of NBD-labeled non-targeted and Fol-targeted CaZol nMOFs were utilized in healthy athymic nude (Nu) mice and H460 xenograft tumor-bearing Nu mice via ex vivo fluorescence imaging technique. Samples from the tumor, heart, lung, and mononuclear phagocyte system (MPS, also known as the reticuloendothelial system, including the liver, kidney, and spleen) were collected 48h after tail vein i.v. administration of PBS (control), NBD-labeled non-targeted, and Fol-targeted CaZol nMOFs containing 1.6 mg/kg (MTD of Zol in mouse) of encapsulated Zol for ex vivo imaging study (Figs. S7 - S9). Ex vivo image analyses (Fig. S10) revealed that about 82% of the i.v. administrated Fol-targeted CaZol nMOFs were accumulated in the tumor, but that only about 52% of the non-targeted CaZol nMOFs were accumulated in the tumor. The majority of the remaining administered CaZol nMOFs were accumulated in the liver (12% of Fol-targeted CaZol nMOFs and about 30% of the non-targeted CaZol nMOFs), and less than 10% of the administrated Fol-targeted CaZol nMOFs and 16% of the non-targeted CaZol nMOFs were accumulated in the other organs in the MPS, heart and lung. On the other hand, approximately 60% and 20% of the administered Fol-targeted CaZol nMOFs were accumulated in the liver and kidney, respectively, in healthy Nu mice. Up to 25% of the Fol-targeted CaZol nMOFs were found in the heart and lung of healthy tumor-free mice, suggesting that a significant amount of the PEGylated CaZol nMOFs were remained in the circulation system due to the EPR effect. The biodistribution study indicated that the Fol-targeted CaZol nMOFs are more efficient than non-targeted CaZol nMOFs for tumor uptake and to reduce the non-specific accumulation of nMOFs in the liver and kidney. However, the low accumulation of both NBD-labeled CaZol nMOFs in the liver and kidney could be caused by the high absorption and scattering characters of both MPS organs [41], which is an intrinsic limitation of using ex vivo fluorescence imaging technique to elevate biodistribution of nanomaterials.
Zol is a third-generation bisphosphonate that has fewer side effects than the first two generations bisphosphonates. Common short-term side effects associated with Zol include “flu-like” symptoms (caused by activation of γδ T cells) [42, 43], hypocalcaemia [44], and renal failure [45]. Table S5 summarizes the hematologic toxicity, nephrotoxicity and hepatotoxicity parameters, and the plasma calcium level recorded for the healthy tumor-free CD1 mice 4 days after tail-vein i.v. administration of PBS, drug-free Fol-targeted liposomes, and a therapeutic dose (1.6 mg/kg, maximum tolerated dose (MTD) of Zol in mice) of small molecule or encapsulated Zol. The key toxicity parameters recorded after i.v. administration of small molecule and encapsulated Zol were within the documented normal ranges for healthy CD1 mice except that the monocyte level of the CD1 mice administered with small-molecule Zol was above the normal range due to the activation of γδ T cells [43]. Although the biodistribution study revealed that the majority of the administered CaZol nMOFs were accumulated in the liver and kidney of healthy tumor-free mice, a therapeutic dose of CaZol nMOFs showed insignificant hepatotoxicity and nephrotoxicity in healthy CD1 mice.
3.5. Tumor Growth Inhibition Efficiencies of Small Molecule Zol, Non-Targeted and Fol-Targeted CaZol nMOFs in the H460 and PC3 Xenograft Tumor Models
In vivo chemotherapy was performed in mouse H460 and PC3 tumor xenograft models. Tumor-bearing Nu mice were given a single sub-therapeutic dose of chemotherapy, either i.v. administration of PBS (as a control), drug-free Fol-targeted liposomes or 0.8 mg/kg (half of the MTD of Zol in mice) of small molecule or encapsulated Zol. This enabled precise quantification of the therapeutic effects of each treatment without eradication of tumor in all experimental arms. Figs. 6a(i) and 6b(ii) show tumor-growth delay curves recorded 10 and 14 days after tumor inoculation for H460 and PC3 xenograft tumor-bearing mice that received different treatments. The administration of drug-free Fol-targeted liposomes did not delay tumor growth in both cell lines compared with the control group, which was administrated with PBS (p > 0.05 versus control group in both cell lines). The administration of small-molecule Zol significantly delayed the growth of H460 and PC3 tumors (p = 0.01 – 0.02 versus the corresponding control group) by an average of 8 and 11 days (Figs. 6a(ii) and 6b(ii)), respectively. The administration of Fol-targeted CaZol nMOFs further delayed the growth of H460 and PC3 xenograft tumors by 15 and 20 days (Fig. 6a(ii) and 6b(ii)), respectively, compared with the control group (p < 0.01) and the treatment group administered with small-molecule Zol (p = 0.02 for H460 tumor, and p = 0.03 for PC3 tumor). On the other hand, the administration of non-targeted CaZol nMOFs only slightly delayed tumor growth compared with the control group that was administrated with PBS (p = 0.04), and the tumor-growth delay efficiency was significantly weaker for non-targeted CaZol nMOFs than for small-molecule Zol (p = 0.03 for H460 cell line, p = 0.06 for PC3 cell line). Quantitative tumor growth delay analyses (Fig. 6c) indicated that the Fol-targeted CaZol nMOFs significantly enhance the antitumor activity of Zol by 83 – 85% in in both types of xenograft tumor with overexpressed FR. Conversely, the administration of non-targeted CaZol nMOFs reduce the antitumor activity of Zol by 60 – 61% in both xenograft tumor models due to poor tumor uptake, as justified by the in vivo biodistribution study.
Fig. 6. In vivo.

antitumor efficiencies of drug-free Fol-targeted liposomes, small-molecule Zol, and non-targeted and Fol-targeted CaZol nMOFs. (a)(i) Tumor growth-delay curves and (ii) Kaplan-Meier survival curves of H460 lung xenograft tumor-bearing mice after a single i.v. administration of PBS, drug-free Fol-targeted liposomes,# or 0.8 mg/kg (half of the MTD of Zol in mice) of small-molecule or encapsulated Zol. (b)(i) Tumor growth-delay curves and (ii) Kaplan-Meier survival curves of PC3 prostate xenograft tumor-bearing mice after a single i.v. administration of PBS, drug-free Fol-targeted liposomes, or 0.8 mg/kg (half of the MTD of Zol in mice) of small-molecule or encapsulated Zol. (c) Table comparing in vivo antitumor efficiencies of small-molecule and encapsulated Zol. (N.B. # containing the same amount of lipid coating as the Fol-targeted CaZol nMOFs; i.e., each 29–30 g mouse received IV administration of 200 μL of 245μg/mL of drug-free Fol-targeted liposomes; n.s. = statistically insignificant; * p < 0.05, which is statistically significant.)
3.6. Histopathological Insight
Further histopathological studies were performed to gain insight into the anticacner activities of the small-molecule Zol and Fol-targeted CaZol nMOFs. Representative H460 and PC3 xenograft tumors (3 per group) were removed 4 days after chemotherapy to investigate the underlying therapeutic effects of different treatments.
A previous in vitro study found that Zol effectively inhibited basic fibroblast growth factor (bFGF) and vascular endothelial growth factor (VEGF), which are the key growth factors that control the growth of blood vessels and thus delaying tumor growth [11, 12]. The CD31 immunochemical stain via the anit-CD31 antibody was used to label vascular endothelial cells to quantify blood vessels in the tumor [46], Fig. 7a shows representative optical micrographs of CD31 antibody-stained H460 and PC3 tumor sections. Both untreated tumor sections have an average of 20 ± 2 blood vessels per image. The administration of small molecule Zol reduced the number of blood vessels by about 50% in both xenograft tumor models. The antiangiogenic effect of small-molecule Zol in the H460 and PC3 tumors was comparable to that observed in the previous ex vivo study. The administration of Fol-targeted CaZol nMOFs effectively reduced the number of blood vessels to 6 ± 1 and 4 ± 1 vessels per image in H460 and PC3 tumor sections, respectively. Conversely, the administration of non-targeted CaZol nMOFs showed very weak antiangiogenic effect in both types of xenograft tumors. The improved antiangiogenic effect observed in the tumor treated with Fol-targeted CaZol nMOFs can be explained by the increased Zol uptake and slower drug release mechanism of the Fol-targeted CaZol nMOFs.
Fig. 7.
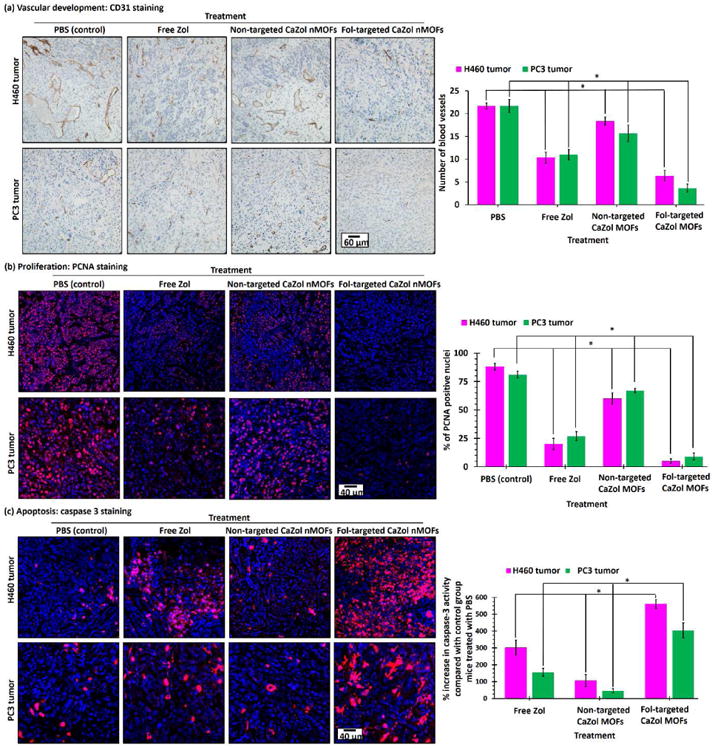
Histology of H460 and PC3 tumor sections after received different Zol treatments. (a) CD31-stained H460 and PC3 tumor sections after treated with PBS, small molecule (“free”) Zol, non-targeted and Fol-targeted CaZol nMOFs. The CD31 antibody (brown) labeled the vascular endothelial cells. (b) PCNA- and (c) caspase 3-stained H460 and PC3 tumor sections after treatment with PBS, small-molecule (“free”) Zol, or non-targeted and Fol-targeted CaZol nMOFs. The PCNA antibody (red fluorescence) indicates a nucleus undergoing cell proliferation. The Caspase 3 antibody (red fluorescence) indicates cells undergoing early-stage apoptosis (programmed cell death). (N.B. the nuclei in all tumor sections were co-stained with DAPI (blue fluorescence); * p < 0.05, which is statistically significant.)
A proliferation cell nuclear antigen (PCNA) immunochemical stain via the anti-PCNA antibody was used to quantify the number of active proliferating cancer cells in tumor sections after received different Zol treatments [47]. As shown in Fig. 7b, the number of PCNA-positive nuclei (red fluorescence) was significantly reduced from 88 ± 3% and 81 ± 4% to 20 ± 5% and 27 ± 4% in H460 and PC3 tumors, respectively, upon treatment with small-molecule Zol. This indicated that small-molecule Zol effectively inhibited the proliferation of H460 and PC3 cancer cells. This is consistent with the in vitro cell proliferation study. Treatment with Fol-targeted CaZol nMOFs almost completely inhibited cell proliferation in both types of xenograft tumors, as less than 10% of the nuclei in the tumor treated with Fol-targeted CaZol nMOFs were found to be positive for PCNA. This is because most of the i.v. administrated Fol-targeted CaZol nMOFs had accumulated in the tumor and because the prolonged drug release kinetics improved the inhibition efficiency. On the other hand, the administration of non-targeted CaZol nMOFs only slightly reduced the number of PCNA positive nuclei to 60 ± 5% and 67 ± 2% in H460 and PC3 tumors, respectively, because fewer CaZol nMOFs were accumulated in the tumor as indicated by the biodistribution study.
The degree of early-stage programmed cell-death in the xenograft tumors were quantified using caspase 3 antibody [40]. Fig. 7c shows confocal fluorescence images of representative caspase 3 antibody-stained (red fluorescence) H460 and PC3 tumor sections. The caspase 3 activities of H460 and PC3 tumor increased by 300 ± 45% and 155 ± 23%, respectively, compared with the control group after being treated with small-molecule Zol. This indicated that small-molecule Zol directly induced apoptosis in both tumors, which is consistent with the in vitro toxicity study. The administration of Fol-targeted CaZol nMOFs significantly increased the caspase 3 activities by 560 ± 27% and 403 ± 45% in H460 and PC3 tumors, respectively. On the other hand, the administration of non-targeted CaZol nMOFs only slightly increased the caspase 3 activities (by 105 ± 27% and 45 ± 12% in H460 and PC3 tumors, respectively). This indicates the tumor uptake of the CaZol nMOFs directly affected the therapeutic efficiency of the encapsulated Zol.
4. Discussion
In this study, we reported the fabrication of a new bioresorbable Fol-targeted CaZol nMOFs for the therapeutic delivery of Zol to FR-overexpressing tumors. Near-monodispersed sub-100 nm diameter asymmetric lipid-bilayer coated CaZol nMOFs have been successfully synthesized using an optimized stepwise synthesis method: the fabrication of hydrophobic DOPA-coated CaZol nMOFs via the water-in-oil microemulsion method followed by the fabrication of an active-targeted outer lipid leaflet coating via the film rehydration method. The Fol-targeted CaZol nMOFs encapsulated about 50.6 wt% of Zol, which is about 7 times higher than that of Zol-encapsulated liposomes [15], The optimized outer lipid leaflet coating method and the preassembled of the inner DOPA-based lipid leaflet allowed us to increase the PEGylated lipid compositions in the outer lipid leaflet from 5mol% (in normal clinical-use liposomes) [48] to 20 mol%. This not only improves the colloidal and chemical stabilities of the CaZol nMOFs in physiological environments, but also increases the nMOF uptake in FR-overexpressed cancer cells. An in vitro cellular uptake study indicated that the H460 and PC3 cells took up approximately 20 to 30% of the Fol-targeted CaZol nMOFs within a short incubation period (2h) but that both cell lines took up less than 5% of the administered non-targeted CaZol nMOFs under identical conditions. A further ex vivo biodistribution study in H460 tumor xenograft mice indicated the folate-receptor overexpressed tumor took up about 80% of the i.v. administrated fluorescent-label Fol-targeted CaZol nMOFs, which is significantly higher than that of 14% recorded for Zol-encapsulated liposomes in xenograft tumor model [16].
Drug release kinetics directly affect the therapeutic efficiency and symmetric toxicity of the encapsulated drug [49]. A “burst” release of an encapsulated drug in mildly acidic conditions is one of the major limitations of most calcium phosphate and calcium carbonate-based drug delivery systems, which often reduce the therapeutic efficiency of the encapsulated drug [27, 29, 50]. In contrast to the reported lipid-caoted calcium monophosphate nanoparticles, the new Fol-targeted CaZol nMOFs control the release of the encapsulated Zol at mildly acidic (pH 5) conditions with a first ordered drug release half-life of 3.5h. The prolonging of the drug release kinetics is due to an optimized nMOF preparation conditions and strong chelating character of fully deprotonated bisphosphonate. An intercellular drug release study in Fura-2-loaded H460 and PC3 cells indicated that the CaZol nMOFs gradually decomposed and controlled the release of Ca2+ and Zol from the acidic endosomes after entering cancer cells via endocytosis (Fig. 8). The controlled Ca2+ release allows the plasma membrane Ca2+ ATPase (PMCA) in the cell membrane to regulate the intercellular Ca2+ level by pumping excess Ca2+ from the cytoplasm, preventing Ca2+-induced apoptosis or necrosis [51]. Due to the improved cellular uptake and prolonged drug release kinetics, the Fol-targeted CaZol nMOFs were found to be more efficient than small molecule Zol in inhibiting cell proliferation, inducing apoptosis at 2- to 7-fold higher rates in H460 and PC3 cell lines, which is significantly more toxic than Zol-encapsulated liposomes [15]. On the other hand, non-targeted CaZol nMOFs showed very low in vitro toxicity due to poor cellular uptake. The encapsulation of Zol not only increased the in vitro toxicity, but also reduced the symmetric toxicities of small-molecule Zol, (e.g., non-specific activation of T cells as utilized in healthy CD1 mice). In addition, the side effects of the Fol-targeted CaZol nMOFs are much weaker than that of Zol-conjugated liposomes [16].
Fig. 8.

Direct anticancer activity of Fol-targeted CaZol nMOFs against a Fol-receptor-overexpressed cancer cell. Active-targeted PEGylated CaZol nMOFs bind to the Fol receptor in Fol-receptor-overexpressed cancer cells and enter the cells via endocytosis. The (partial) protonation of CaZol nMOFs in the mildly acidic endosomes (pH ≈ 5) triggers the release of therapeutic, active Zol. Zol inversely inhibits farnesyl diphosphate synthase (FPPS), basic fibroblast growth factor (bFGF) and vascular endothelial growth factor (vEGF), which in turn inhibit cancer-cell proliferation, trigger apoptosis, and inhibit blood-vessel growth. (N.B. HMG-CoA = 3-hydroxy-3-methylglutaryl-coenzyme A; IPP = isopentenyl pyrophosphate; GPP = geranyl pyrophosphate; FPP = farnesyl pyrophosphate; GGPP = geranylgeranyl pyrophosphate)
In vivo studies demonstrated that small molecule Zol delayed the growth of fast-growing H460 and slow-growing PC3 xenograft tumors. The observed direct antitumor activities were likely due to the inhibition of bFGH, VEGF and FPPS in the mevalonate pathway [1-9]. In vivo treatment with a single therapeutic dose of Fol-targeted CaZol nMOFs effectively inhibited the growth of both xenograft tumors. Quantitative tumor growth delayed analyses indicated the administration of Fol-targeted CaZol nMOFs improved the therapeutic efficiencies of Zol by 83 to 85%. The improvement can be explained by the improved tumor uptake of the Fol-targeted CaZol nMOFs and the prolonged drug release kinetics of the CaZol nMOFs. On the other hand, the antitumor activities of the non-targeted CaZol nMOFs were significantly weaker than small-molecule Zol and Fol-targeted CaZol nMOFs due to the poor cellular uptake of the non-targeted nMOFs. In contrast to the conventional drug delivery systems where non-covalently encapsulated drug slowly release in the extracellular matrix [34], the chemically stable CaZol nMOFs release insignificant amount of encapsulated Zol in the slightly acidic extracellular tumor microenvironment (pH 6.5 – 6.9) [52], as indicated in the in vitro drug release study. In addition, previous time-dependent in vivo tumor uptake study found that sub-100 nm diameter non-targeted PEGylated nMOFs do not retain in the extracellular tumor miroenvironments very well [33], with about 50% of the initially accumulated nMOFs retained in the tumor 48h after i.v. administration. Further histopathological studies confirmed that the Fol-targeted CaZol NMOFs were more effective than small-molecule Zol at normalizing tissue microenvironments (e.g. inhibition of blood vessels growth), inhibiting cell proliferation and inducing apoptosis in both xenograft tumor models, which is consistent with the direct anticancer and antiangiogenesis effects observed in this and previous in vitro studies. The inhibition of FPPS suspended the conversion of GPP into FPP (Fig. 8). This caused accumulation of unprenylated proteins, including IPP and apoptotic ATP analog (Apppl), which triggers apoptosis of cancer cells (see Fig. 8). In addition, the reduction of FPP downregulates Ras farnesylation, and Rho, Rac and Rab geranylation (Fig. 8), which inhibit the activation of the cell signaling molecules that are responsible for the proliferation, adhesion and migration of cancer and endothelial cells [1-9]. Furthermore, moderate concentrations (sub-10 μM) of Zol inhibit bFGF and VEGF [11,12], which are responsible for blood vessel growth (Fig. 8). The inhibition of endothelial cells, bFGF, and VEGF account for the antiangiogenesis effect observed in H460 and PC3 xenograft tumor sections [11, 12]. The histopathological study further confirmed that active targeted was essential to improving the tumor uptake of the CaZol nMOFs, and thus enhancing the therapeutic efficiency of the encapsulated Zol.
5. Conclusion
In summary, we engineered a new bioresorbable Fol-targeted CaZol nMOFs for therapeutic delivery of Zol to FR-overexpressed tumors. The new active-targeted CaZol nMOFs encapsulated more Zol than existing drug delivery systems (e.g., liposomes) and established excellent chemical and colloidal stability under physiological conditions (0.1 M PBS, pH 7). The Fol-targeted lipid coating facilitates the endocytosis of the CaZol nMOFs in FR-overexpressed cancer cells, allowing the nMOFs to control the release of encapsulated Zol in mildly acidic endosomes. Due to the super cellular uptake and prolonged drug release kinetics, the Fol-targeted CaZol nMOFs showed higher efficiency than small molecule Zol at inhibiting cell proliferation and inducing apoptosis in FR-overexpressing H460 and PC3 cancer cells in vitro. An in vivo biodistribution study indicated that over 80% of i.v. administrated Fol-targeted CaZol nMOFs accumulated in the H460 xenograft tumor 48h after administration, due to the EPR effect from the PEGylated lipid coating and the active-targeted effect from the Fol ligand. Quantitative in vivo antitumor activity studies in H460 and PC3 xenograft tumor-bearing mice indicated the Fol-targeted CaZol nMOFs but not non-targeted CaZol nMOFs improved the direct antitumor efficiencies of Zol by approximately 80%. Further histopathology study indicated the Fol-targeted CaZol nMOFs were more efficient than the small-molecule Zol to normalizing tissue microenvironments, inhibiting cell proliferation, and inducing cell apoptosis in both FR-overexpressing H460 and PC3 xenograft tumors. Therefore, these preclinical studies show that Fol-targeted CaZol nMOFs may be promising to develop as a FR-targeting anti-neoplastic agent.
Supplementary Material
Acknowledgments
We thank Microscopy Service Laboratory Core, Animal Study Core, Small Animal Imaging Facility, Animal Clinical Laboratory, Animal Histopathology Core Facility, Translation Pathology Lab and Nanomedicines Characterization Core Facility in the School of Medicine, and Chapel Hill Analytical and Nanofabrication Laboratory (CHANL) and X-Ray Facility in the Department of Chemistry at the University of North Carolina at Chapel Hill for their assistance with procedures in this manuscript. This work was supported by the University Cancer Research Fund from the University of North Carolina and R01CA178748 and R01CA149387 from the National Institutes of Health/National Cancer Institute. A.Z.W. and L.H. were also supported by the National Institutes of Health Center for Nanotechnology Excellence Grant U54-CA151652.
Footnotes
Appendix: Supporting Information (Supporting Figures and Tables) associated with this article can be found in the online version.
Publisher's Disclaimer: This is a PDF file of an unedited manuscript that has been accepted for publication. As a service to our customers we are providing this early version of the manuscript. The manuscript will undergo copyediting, typesetting, and review of the resulting proof before it is published in its final citable form. Please note that during the production process errors may be discovered which could affect the content, and all legal disclaimers that apply to the journal pertain.
References
- 1.Green JR. Bisphosphonates: preclinical review. Oncologist. 2004;9 Suppl 4:3–13. doi: 10.1634/theoncologist.9-90004-3. [DOI] [PubMed] [Google Scholar]
- 2.Berenson JR, Rosen LS, Howell A, Porter L, Coleman RE, Morley W, et al. Zoledronic acid reduces skeletal-related events in patients with osteolytic metastases. Cancer. 2001;91:1191–200. doi: 10.1002/1097-0142(20010401)91:7<1191::aid-cncr1119>3.0.co;2-0. [DOI] [PubMed] [Google Scholar]
- 3.McKeage K, Plosker GL. Zoledronic acid: a pharmacoeconomic review of its use in the management of bone metastases. Pharmacoeconomics. 2008;26:251–68. doi: 10.2165/00019053-200826030-00007. [DOI] [PubMed] [Google Scholar]
- 4.Almubarak H, Jones A, Chaisuparat R, Zhang M, Meiller TF, Scheper MA. Zoledronic acid directly suppresses cell proliferation and induces apoptosis in highly tumorigenic prostate and breast cancers. J Carcinog. 2011;10:2. doi: 10.4103/1477-3163.75723. [DOI] [PMC free article] [PubMed] [Google Scholar] [Retracted]
- 5.Zekri J, Mansour M, Karim SM. The anti-tumor effects of zoledronic acid. Oncology. 2014;2:25–35. doi: 10.1016/j.jbo.2013.12.001. [DOI] [PMC free article] [PubMed] [Google Scholar]
- 6.Russell RG, Rogers MJ, Frith JC, Luckman SP, Coxon FP, Benford HL, et al. The pharmacology of bisphosphonates and new insights into their mechanisms of action. J Bone Miner Res. 1999;14 Suppl 2:53–65. doi: 10.1002/jbmr.5650140212. [DOI] [PubMed] [Google Scholar]
- 7.Ross JR, Saunders Y, Edmonds PM, Patel S, Broadley KE, Johnston SR. Systematic review of role of bisphosphonates on skeletal morbidity in metastatic cancer. BMJ. 2003;327:469. doi: 10.1136/bmj.327.7413.469. [DOI] [PMC free article] [PubMed] [Google Scholar]
- 8.Tsagozis P, Eriksson F, Pisa P. Zoledronic acid modulates antitumoral responses of prostate cancer-tumor associated macrophages. Cancer Immunol Immunother. 2008;57:1451–9. doi: 10.1007/s00262-008-0482-9. [DOI] [PMC free article] [PubMed] [Google Scholar]
- 9.McClung M. Bisphosphonates. Arq Bras Endocrinol Metabol. 2006;50:735–44. doi: 10.1590/s0004-27302006000400018. [DOI] [PubMed] [Google Scholar]
- 10.Park J, Matralis AN, Berghuis AM, Tsantrizos YS. Human isoprenoid synthase enzymes as therapeutic targets. Front Chem. 2014;2:50. doi: 10.3389/fchem.2014.00050. [DOI] [PMC free article] [PubMed] [Google Scholar]
- 11.Santini D, Vincenzi B, Galluzzo S, Battistoni F, Rocci L, Venditti O, et al. Repeated intermittent low-dose therapy with zoledronic acid induces an early, sustained, and long-lasting decrease of peripheral vascular endothelial growth factor levels in cancer patients. Clin Cancer Res. 2007;13:4482–6. doi: 10.1158/1078-0432.CCR-07-0551. [DOI] [PubMed] [Google Scholar]
- 12.Wood J, Bonjean K, Ruetz S, Bellahcène A, Devy L, Foidart JM, et al. Novel antiangiogenic effects of the bisphosphonate compound zoledronic acid. J Pharmacol Exp Ther. 2002;302:1055–61. doi: 10.1124/jpet.102.035295. [DOI] [PubMed] [Google Scholar]
- 13.Early Breast Cancer Trialists Colloborative Group (EBCTCG) Adjuvant bisphosphonate treatment in early breast cancer: meta-analyses of individual patient data from randomised trials. Lancet. 2015;386:1353–61. doi: 10.1016/S0140-6736(15)60908-4. [DOI] [PubMed] [Google Scholar]
- 14.De Rosa G, Misso G, Salzano G, Caraglia M. Bisphosphonates and cancer: what opportunities from nanotechnology? J Drug Deliv. 2013;2013:637976. doi: 10.1155/2013/637976. [DOI] [PMC free article] [PubMed] [Google Scholar]
- 15.Marra M, Salzano G, Leonetti C, Tassone P, Scarsella M, Zappavigna S, et al. Nanotechnologies to use bisphosphonates as potent anticancer agents: the effects of zoledronic acid encapsulated into liposomes. Nanomedicine. 2011;7:955–64. doi: 10.1016/j.nano.2011.03.004. [DOI] [PubMed] [Google Scholar]
- 16.Shmeeda H, Amitay Y, Tzemach D, Gorin J, Gabizon A. Liposome encapsulation of zoledronic acid results in major changes in tissue distribution and increase in toxicity. J Control Release. 2013;167:265–75. doi: 10.1016/j.jconrel.2013.02.003. [DOI] [PubMed] [Google Scholar]
- 17.Liu D, Kramer SA, Huxford-Phillips RC, Wang S, Della Rocca J, Lin W. Coercing bisphosphonates to kill cancer cells with nanoscale coordination polymers. Chem Commun (Camb) 2012;48:2668–70. doi: 10.1039/c2cc17635a. [DOI] [PMC free article] [PubMed] [Google Scholar]
- 18.Xia W, Low PS. Folate-targeted therapies for cancer. J Med Chem. 2010;53:6811–24. doi: 10.1021/jm100509v. [DOI] [PubMed] [Google Scholar]
- 19.Cal PM, Frade RF, Chudasama V, Cordeiro C, Caddick S, Gois PM. Targeting cancer cells with folic acid-iminoboronate fluorescent conjugates. Chem Commun (Camb) 2014;50:5261–3. doi: 10.1039/c3cc47534d. [DOI] [PubMed] [Google Scholar]
- 20.Yao V, Berkman CE, Choi JK, O'Keefe DS, Bacich DJ. Expression of prostate-specific membrane antigen (PSMA), increases cell folate uptake and proliferation and suggests a novel role for PSMA in the uptake of the non-polyglutamated folate, folic acid. Prostate. 2010;70:305–16. doi: 10.1002/pros.21065. [DOI] [PubMed] [Google Scholar]
- 21.Berenson JR, Vescio RA, Rosen LS, VonTeichert JM, Woo M, Swift R, et al. A phase I dose-ranging trial of monthly infusions of zoledronic acid for the treatment of osteolytic bone metastases. Clin Cancer Res. 2001;7:478–85. [PubMed] [Google Scholar]
- 22.Berenson JR, Vescio R, Henick K, Nishikubo C, Rettig M, Swift RA, et al. A Phase I, open label, dose ranging trial of intravenous bolus zoledronic acid, a novel bisphosphonate, in cancer patients with metastatic bone disease. Cancer. 2001;91:144–54. doi: 10.1002/1097-0142(20010101)91:1<144::aid-cncr19>3.0.co;2-q. [DOI] [PubMed] [Google Scholar]
- 23.Goldsmith MA, Slavik M, Carter SK. Quantitative prediction of drug toxicity in humans from toxicology in small and large animals. Cancer Res. 1975;35:1354–64. [PubMed] [Google Scholar]
- 24.Mason KA, Hunter NR, Milas M, Abbruzzese JL, Milas L. Docetaxel enhances tumor radioresponse in vivo. Clin Cancer Res. 1997;3:2431–8. [PubMed] [Google Scholar]
- 25.Rosenzweig KE, Youmell MB, Palayoor ST, Price BD. Radiosensitization of human tumor cells by the phosphatidylinositol3-kinase inhibitors wortmannin and LY294002 correlates with inhibition of DNA-dependent protein kinase and prolonged G2-M delay. Clin Cancer Res. 1997;3:1149–56. [PubMed] [Google Scholar]
- 26.Mason KA, Kishi K, Hunter N, Buchmiller L, Akimoto T, Komaki R, et al. Effect of docetaxel on the therapeutic ratio of fractionated radiotherapy in vivo. Clin Cancer Res. 1999;5:4191–8. [PubMed] [Google Scholar]
- 27.Li J, Yang Y, Huang L. Calcium phosphate nanoparticles with an asymmetric lipid bilayer coating for siRNA delivery to the tumor. J Control Release. 2012;158:108–14. doi: 10.1016/j.jconrel.2011.10.020. [DOI] [PMC free article] [PubMed] [Google Scholar]
- 28.Destrée C, Debuigne F, Jeunieau L, Nagy JB. Mechanism of formation of inorganic and organic nanoparticles from microemulsions. Adv Colloid Interface Sci. 2006;123-126:353–67. doi: 10.1016/j.cis.2006.05.022. [DOI] [PubMed] [Google Scholar]
- 29.Li J, Chen YC, Tseng YC, Mozumdar S, Huang L. Biodegradable calcium phosphate nanoparticle with lipid coating for systemic siRNA delivery. J Control Release. 2010;142:416–21. doi: 10.1016/j.jconrel.2009.11.008. [DOI] [PMC free article] [PubMed] [Google Scholar]
- 30.Lu HB, Campbell CT, Graham DJ, Ratner BD. Surface charactization of hydroxyapatite and related calcium phosphates by XPS and TOF-SIMS. Anal Chem. 2000;72:2886–94. doi: 10.1021/ac990812h. [DOI] [PubMed] [Google Scholar]
- 31.Pascaud P, Bareille R, Bourget C, Amédée J, Rey C, Sarda S. Interaction between a bisphosphonate, tiludronate and nanocrystalline apatite: in vitro viability and proliferation of HOP and HBMSC cells. Biomed Mater. 2012;7:054108. doi: 10.1088/1748-6041/7/5/054108. [DOI] [PubMed] [Google Scholar]
- 32.Klibanov AL, Maruyama K, Torchilin VP, Huang L. Amphipathic polyethyleneglycols effectively prolong the circulation time of liposomes. FEBS Lett. 1990;268:235–7. doi: 10.1016/0014-5793(90)81016-h. [DOI] [PubMed] [Google Scholar]
- 33.Liu D, Poon C, Lu K, He C, Lin W. Self-assembled nanoscale coordination polymers with trigger release properties for effective anticancer therapy. Nat Commun. 2014;5:4182. doi: 10.1038/ncomms5182. [DOI] [PMC free article] [PubMed] [Google Scholar]
- 34.Alexis F, Pridgen E, Molnar LK, Farokhzad OC. Factors affecting the clearance and biodistribution of polymeric nanoparticles. Mol Pharm. 2008;5:505–15. doi: 10.1021/mp800051m. [DOI] [PMC free article] [PubMed] [Google Scholar]
- 35.Glausch Alexandra LR, Sigg Juergen. In: Pharmaceutical Products Comprising Bisphosphonate. CH NA, editor. DE2004. [Google Scholar]
- 36.Geisow MJ, Evans WH. pH in the endosome. Measurements during pinocytosis and receptor-mediated endocytosis. Exp Cell Res. 1984;150:36–46. doi: 10.1016/0014-4827(84)90699-2. [DOI] [PubMed] [Google Scholar]
- 37.Kester M, Heakal Y, Fox T, Sharma A, Robertson GP, Morgan TT, et al. Calcium phosphate nanocomposite particles for in vitro imaging and encapsulated chemotherapeutic drug delivery to cancer cells. Nano Lett. 2008;8:4116–21. doi: 10.1021/nl802098g. [DOI] [PMC free article] [PubMed] [Google Scholar]
- 38.Muddana HS, Morgan TT, Adair JH, Butler PJ. Photophysics of Cy3-encapsulated calcium phosphate nanoparticles. Nano Lett. 2009;9:1559–66. doi: 10.1021/nl803658w. [DOI] [PMC free article] [PubMed] [Google Scholar]
- 39.Hirst RA, Harrison C, Hirota K, Lambert DG. Measurement of [Ca2+]i in whole cell suspensions using fura-2. Methods Mol Biol. 2006;312:37–45. [PubMed] [Google Scholar]
- 40.Porter AG, Jänicke RU. Emerging roles of caspase-3 in apoptosis. Cell Death Differ. 1999;6:99–104. doi: 10.1038/sj.cdd.4400476. [DOI] [PubMed] [Google Scholar]
- 41.Liu Y, Tseng YC, Huang L. Biodistribution studies of nanoparticles using fluorescence imaging: a qualitative or quantitative method? Pharm Res. 2012;29:3273–7. doi: 10.1007/s11095-012-0818-1. [DOI] [PMC free article] [PubMed] [Google Scholar]
- 42.Berenson JR. Recommendations for zoledronic acid treatment of patients with bone metastases. Oncologist. 2005;10:52–62. doi: 10.1634/theoncologist.10-1-52. [DOI] [PubMed] [Google Scholar]
- 43.Ashihara E, Munaka T, Kimura S, Nakagawa S, Nakagawa Y, Kanai M, et al. Isopentenyl pyrophosphate secreted from Zoledronate-stimulated myeloma cells, activates the chemotaxis of γST cells. Biochem Biophys Res Commun. 2015;463:650–5. doi: 10.1016/j.bbrc.2015.05.118. [DOI] [PubMed] [Google Scholar]
- 44.Morag Y, Morag-Hezroni M, Jamadar DA, Ward BB, Jacobson JA, Zwetchkenbaum SR, et al. Bisphosphonate-related osteonecrosis of the jaw: a pictorial review. Radiographics. 2009;29:1971–84. doi: 10.1148/rg.297095050. [DOI] [PubMed] [Google Scholar]
- 45.Chang JT, Green L, Beitz J. Renal failure with the use of zoledronic acid. N Engl J Med. 2003;349:1676–9. doi: 10.1056/NEJM200310233491721. discussion-9. [DOI] [PubMed] [Google Scholar]
- 46.Baluk P, Morikawa S, Haskell A, Mancuso M, McDonald DM. Abnormalities of basement membrane on blood vessels and endothelial sprouts in tumors. Am J Pathol. 2003;163:1801–15. doi: 10.1016/S0002-9440(10)63540-7. [DOI] [PMC free article] [PubMed] [Google Scholar]
- 47.Strzalka W, Ziemienowicz A. Proliferating cell nuclear antigen (PCNA): a key factor in DNA replication and cell cycle regulation. Ann Bot. 2011;107:1127–40. doi: 10.1093/aob/mcq243. [DOI] [PMC free article] [PubMed] [Google Scholar]
- 48.Barenholz Y. Doxil®--the first FDA-approved nano-drug: lessons learned. J Control Release. 2012;160:117–34. doi: 10.1016/j.jconrel.2012.03.020. [DOI] [PubMed] [Google Scholar]
- 49.Sethi M, Sukumar R, Karve S, Werner ME, Wang EC, Moore DT, et al. Effect of drug release kinetics on nanoparticle therapeutic efficacy and toxicity. Nanoscale. 2014;6:2321–7. doi: 10.1039/c3nr05961h. [DOI] [PMC free article] [PubMed] [Google Scholar]
- 50.Morgan TT, Muddana HS, Altinoglu EI, Rouse SM, Tabaković A, Tabouillot T, et al. Encapsulation of organic molecules in calcium phosphate nanocomposite particles for intracellular imaging and drug delivery. Nano Lett. 2008;8:4108–15. doi: 10.1021/nl8019888. [DOI] [PMC free article] [PubMed] [Google Scholar]
- 51.Tseng YC, Yang A, Huang L. How does the cell overcome LCP nanoparticle-induced calcium toxicity? Mol Pharm. 2013;10:4391–5. doi: 10.1021/mp400028m. [DOI] [PMC free article] [PubMed] [Google Scholar]
- 52.Tannock IF, Rotin D. Acid pH in tumors and its potential for therapeutic exploitation. Cancer Res. 1989;49:4373–84. [PubMed] [Google Scholar]
Associated Data
This section collects any data citations, data availability statements, or supplementary materials included in this article.