Abstract
Purpose
Patients routinely undergo ablation for atrial fibrillation (AF) but the recurrence rate remains high. We explored in this study whether poor scar formation as seen on late-gadolinium enhancement magnetic resonance imaging (LGE-MRI) correlates with AF recurrence following ablation.
Methods
We retrospectively identified 94 consecutive patients who underwent their initial ablation for AF at our institution and had pre-procedural magnetic resonance angiography (MRA) merged with left atrial (LA) anatomy in an electroanatomic mapping (EAM) system, ablated areas marked intraprocedurally in EAM, 3-month post-ablation LGE-MRI for assessment of scar, and minimum of 3-months of clinical follow-up. Ablated area was quantified retrospectively in EAM and scarred area was quantified in the 3-month post-ablation LGE-MRI.
Results
With the mean follow-up of 336 days, 26 out of 94 patients had AF recurrence. Age, hypertension, and heart failure were not associated with AF recurrence, but LA size and difference between EAM ablated area and LGE-MRI scar area was associated with higher AF recurrence. For each percent higher difference between EAM ablated area and LGE-MRI scar area, there was a 7–9 % higher AF recurrence (p values 0.001–0.003) depending on the multivariate analysis.
Conclusions
In AF ablation, poor scar formation as seen on LGE-MRI was associated with AF recurrence. Improved mapping and ablation techniques are necessary to achieve the desired LA scar and reduce AF recurrence.
Keywords: Atrial fibrillation, Ablation, MRI, Recurrence, Poor scar formation
1 Introduction
Atrial fibrillation (AF) is a common arrhythmia and the use of radiofrequency ablation to treat AF is increasing, especially for treatment of symptomatic patients [1]. However, the long-term limited success of ablation in maintaining normal sinus rhythm leaves room for significant improvement [1]. While left atrial (LA) size and pre-ablation atrial fibrosis have been associated with AF recurrence after ablation, associations with other risk factors including scar from ablation is not well defined [2, 3].
In current clinical practice, pre-procedural computed tomography or magnetic resonance angiography (MRA) is commonly acquired and segmented to create a LA shell for mapping [4]. On the shell, ablated areas are frequently marked to help guide lesion delivery. Despite these imaging tools to aid the procedure, there is little direct feedback of changes to the tissue as ablation is carried out, and lesion delivery is consequently assumed based on numerous indirect parameters like attenuation to the local electrogram, drop in impedance, power used, duration of ablation, and type of ablation catheter.
Late-gadolinium enhancement MRI (LGE-MRI) has long been used to identify ventricular scar, but more recently, LGE-MRI has been applied to characterize resultant scar in the LA after ablation [5–7]. In our recent study, significant LA area marked as ablated in EAM (electroanatomic mapping) did not result in eventual LA scar area on LGE-MRI [8]. Although transitory edema, catheter non-contact, or insufficient ablation delivery parameters may play a role, the influence of this variability in scar formation on ablation outcome remains undefined [9].
In this study, the relationship between AF recurrence and scar formation after AF ablation was explored with the hypothesis that poor scar formation after ablation leads to a higher rate of AF recurrence.
2 Methods
2.1 Patient selection
Patient data was collected retrospectively with approval by an internal review board of the University of Utah. Ninety-four consecutive patients were included according to the following criteria: initial catheter ablation for AF in the 2-year period from January 1, 2011 to December 31, 2012 at the University of Utah, MRA merged with intracardiac echocardiography (ICE) in EAM system, pulmonary vein (PV) isolation performed, LGE-MRI at least 3 months post-ablation, and clinical follow-up for at least 3 months.
2.2 Mapping and delivery of lesions
All procedures were performed using the CARTO EAM system (Biosense Webster, Diamond Bar, CA). A 3.5-mm ablation catheter (Thermocool, Biosense Webster) and circular mapping catheter (LASSO, Biosense Webster) were advanced transeptally to the LA under ICE guidance. Anatomical landmarks were identified on ICE and merged with a 3-D reconstruction of the LA from pre-procedural MRA. All patients received PV isolation for all veins and 53 patients received additional debulking of the LA posterior wall. Of the three ablationists who performed the procedures, operator 1 ablated at an output of 50 W, operator 2 used 30–35 W, and operator 3 used 25–30 W. Catheter tip-tissue contact was tracked with ICE. Ablation tags with 4-mm diameter were placed approximately every 5 s of RF delivery for the first operator and every 10–15 s for operators 2 and 3. After the initial ablation, presence of local electrograms was tested using the mapping and ablation catheters. Additional lesions were delivered if local electrograms persisted. A combination of ICE-guided ablation for contact and electrogram attenuation was used in these cases to ensure adequate lesion formation. PV electrical isolation was tested using the mapping catheter. Acute procedural success was defined by complete isolation of all PVs as confirmed with the mapping catheter and non-inducibility of AF with burst pacing or isoproterenol infusion.
2.3 Measurement of ablated surface area
Ablated surface area was calculated in EAM as described earlier in detail [8]. Briefly, ablation tags were projected to the nearest surface of the MRA reconstruction using the CARTO MergePlus module. The design line tool was used to trace contours around the PVostia, mitral valve, regions of ablation tags, and gaps of greater than equal to 0.2 cm2 in the ablated area (Fig. 1). Surface areas of the mitral valve and PVs were measured and excluded to define LA surface area. Ablated regions were then summed and gap areas were excluded to define ablated surface area as a percentage of LA surface area in EAM (pAbl).
Fig. 1.
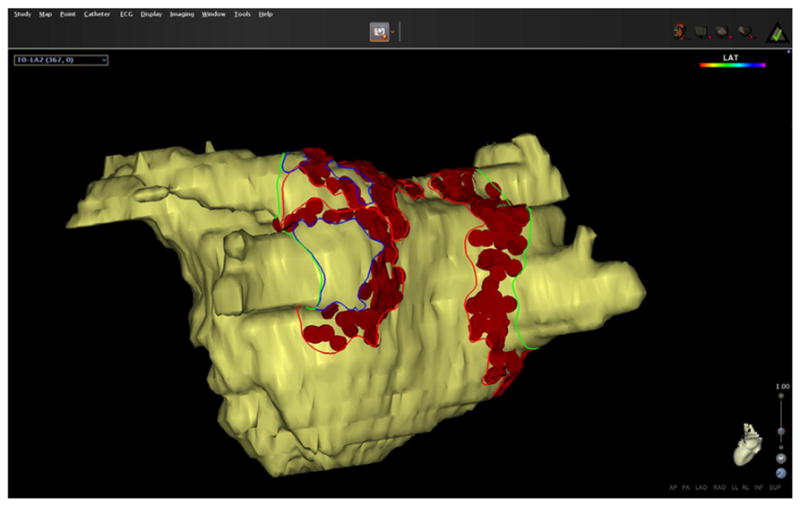
Measurement of the ablated surface area in EAM. Ablation tags are projected to the surface and the LA. Lines were drawn on the surface area to mark the different areas. Gap areas were marked separately and subtracted to derive the ablated area
2.4 LGE-MRI acquisition
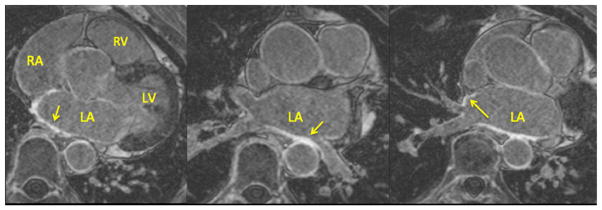
All patients received an LGE-MRI at least 3 months after ablation to assess resultant scar. Scans were acquired on 1.5 or 3 Tesla clinical MR scanners (Siemens Healthcare, Erlangen, Germany) approximately 15 min after injection of contrast agent (0.1 mmol/kg, Multihance, Bracco Diagnostic Inc., Princeton, NJ) using an institutional standard inversion recovery prepared, 3-D gradient echo pulse sequence described previously in detail [8]. All LGE-MRI’s were obtained with acquired voxel size of 1.25×1.25×2.5 mm and reconstructed voxel spacing of 0.625×0.625×1.25 mm. Figure 2 shows a set of axial MR images showing the LA wall with enhancement at the site of scar.
Fig. 2.
Sample axial MR images showing the left atrial wall late-gadolinium enhancement at the site of scar
2.5 MRI image processing and scar quantification
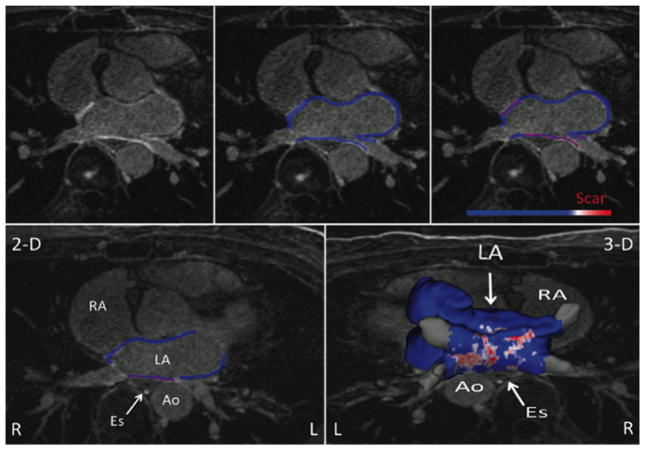
All LGE-MRI’s were processed to visualize and quantify scar using Corview software (Marrek Inc., Salt Lake City, UT). Contours of the LA endocardium were traced in each axial slice by experts and stacked to build a 3-D shell of the LA blood pool. Endocardial contours were expanded distally by 4 pixels (2.5 mm) initially and then manually adjusted to fit the epicardium of the LA. The mitral valve and the PV anatomy distal to the ostia were excluded from the segmentation to define the LA wall. Enhancement within the LA wall was evaluated by a bimodal pixel intensity distribution with the scar intensity threshold set at three standard deviations above the mean pixel intensity of LA myocardium [10–12]. Scarred surface area in the LA wall was quantified by a maximum intensity projection of enhancement to the nearest endocardial surface to define left atrial wall covered by scar as a percentage of total endocardial surface area of the LA wall in LGE-MRI (pScar). Figure 3 shows the LAwall segmentation method leading to scar determination for the entire LA.
Fig. 3.
The left atrial wall segmentation on the LGE-MRI and serial steps taken to determine scar formation in the entire left atrium. Top row shows axial LA MR image (left), segmented LA wall (middle), and enhanced area marked as scar (right). Bottom row shows one segmented slice (left) and all the slices put together for the entire LA (right)
2.6 PV encirclement
Two blinded experts evaluated PV ostial encirclement by ablation tags in EAM. Each observer estimated the degree of encirclement and the average was called observer consensus. For LGE-MRI, three blinded experts estimated the degree of encirclement and averaged to obtain observer consensus. Complete PV encirclement was defined as a contiguous line of ablation tags or enhancement with >90 % encirclement of the PV ostium.
2.7 Clinical follow-up
Patients received a cardiac event monitor immediately after ablation to assess for early AF recurrence. During the blanking period, physicians were free to perform cardioversion or initiate antiarrhythmic medications. After a 3-month post-ablation blanking period, patients were evaluated for AF recurrence with a 12-lead ECG and a 30-day event monitor at 3 months, 6 months, 1 year, and every 6 months thereafter. Patients who experienced symptoms were given additional ECG and Holter monitors to check for recurrence. Recurrent AF was defined per Heart Rhythm Society guidelines as any episode of atrial arrhythmia with ECG characteristics of AF and lasting sufficiently long for an ECG to be recorded or at least 30 s on a rhythm strip and occurring at least 3 months following catheter ablation [13].
2.8 Statistical method
Important covariates were summarized by AF recurrence status (“Yes” and “No”). Continuous variables were expressed as mean (standard deviation) and categorical variables as N (%). Means of the continuous variables were compared among the two recurrence statuses using two-sample Student’s t tests. Pearson’s chi-squared tests and Fisher’s exact tests (when frequencies were small) were used to examine whether the categorical variables were independent of the recurrence status. The agreement between observers quantifying pulmonary vein isolation was quantified using Cohen’s kappa coefficient and the extent of circumferential pulmonary vein encircled by ablation or scar was quantified using the intraclass correlation coefficient (ICC). Univariable and multivariable Cox proportional hazards models were used to relate the difference between pAbl and pScar to time of recurrence. As the sample size of the data was relatively small, many multivariable models were created using a set of two to three different covariates. Time to recurrence was summarized by Kaplan-Meier plots of two arms of the difference between pAbl and pScar as defined by two quantiles, with one containing values less than or equal to the median of the variables and the other containing values higher than the median. All analyses were performed using statistical software Stata (Stata Inc, College Station, TX, USA) version 11. Hypothesis tests with p values <0.05 were considered statistically significant.
3 Results
3.1 Patient characteristics
The mean age of the study cohort was 66.5 years and 67 % of the patients were men. Of the 94 patients, 45 (48 %) had paroxysmal AF and 49 (52 %) had persistent AF. With the mean follow-up of 336 days, 26 out of 94 patients (28.7 % overall) had AF recurrence. Classified by AF recurrence status, there was no difference in the mean age, gender, AF type, prior history of hypertension, diabetes, coronary artery disease, or heart failure, LA surface area, ablation time, and number of PVs encircled in EAM and MRI (Table 1). While pAbl was higher in patients with AF recurrence, pScar was similar in patients regardless of AF recurrence. However, the mean difference between pAbl and pScar was significantly different between the two groups (15.2 vs. 21.3 %, p value 0.003).
Table 1.
Baseline characteristics of the study population (n=94) by recurrence status
| Variables | No Recurrence (n=68) | Recurrence (n=26) | Total (n=94) | p valuea |
|---|---|---|---|---|
| Summary of continuous variable: mean (SD) | ||||
| Difference between EAM ablated area and LGE-MRI scar area | 15.2 (9.1) | 21.3 (7.5) | 16.9 (9.0) | 0.003 |
| Age (years) | 66.4 (10.5) | 66.6 (9.1) | 66.5 (10.0) | 0.931 |
| Ablation time (s) | 2241.8 (634.5) | 2314.9 (703.1) | 2260.8 (649.1) | 0.667 |
| Left atrial surface area (cm2) | 143.1 (33.8) | 156.4 (38.6) | 146.8 (35.5) | 0.103 |
| Ablated area in EAM | 29.1 (7.5) | 33.5 (7.6) | 30.3 (7.7) | 0.013 |
| Scar percent in MRI | 14.3 (6.2) | 12.2 (4.1) | 13.7 (5.7) | 0.109 |
| Summary of categorical variable: N (%) | ||||
| Gender (male) | 49 (72.1) | 14 (53.9) | 63 (67.2) | 0.140 |
| Hypertension (yes) | 42 (61.8) | 14 (53.8) | 56 (59.6) | 0.492 |
| Diabetes (yes) | 10 (14.7) | 3 (11.5) | 13 (13.8) | 0.691 |
| Coronary artery disease (yes) | 17 (25.0) | 6 (23.0) | 23 (24.5) | 0.856 |
| Heart failure (yes) | 16 (23.5) | 5 (19.2) | 21 (22.3) | 0.654 |
| Number of PVs encircled (EAM) | 0.756 | |||
| 0 | 2 (2.9) | 0 (0.0) | 2 (2.1) | |
| 1 | 1 (1.5) | 1 (3.9) | 2 (2.1) | |
| 2 | 18 (26.5) | 5 (19.2) | 23 (24.5) | |
| 3 | 21 (30.9) | 8 (30.8) | 29 (30.9) | |
| 4 | 26 (38.2) | 12 (46.7) | 38 (40.4) | |
| Number of PVs encircled (MRI) | 0.822 | |||
| 0 | 14 (20.6) | 7 (26.9) | 21 (22.3) | |
| 1 | 19 (27.9) | 8 (30.8) | 27 (28.7) | |
| 2 | 15 (22.1) | 6 (23.1) | 21 (22.3) | |
| 3 | 12 (17.7) | 2 (7.7) | 14 (14.9) | |
| 4 | 8 (11.8) | 3 (11.7) | 11 (11.7) | |
| AF type | ||||
| Paroxysmal | 34 (50.0) | 11 (42.3) | 45 (47.9) | 0.504 |
| Persistent | 34 (50.0) | 15 (57.7) | 49 (52.1) | |
p values for testing the difference between means of continuous variables among recurrence and non-recurrence patients (Student’s t tests) and testing whether categorical variables are independent of the recurrence status (chi-squared or Fisher’s exact test)
EAM electroanatomic map, LGE-MRI late-gadolinium enhancement magnetic resonance imaging, PV pulmonary vein
3.2 Correlation between pAbl and pScar
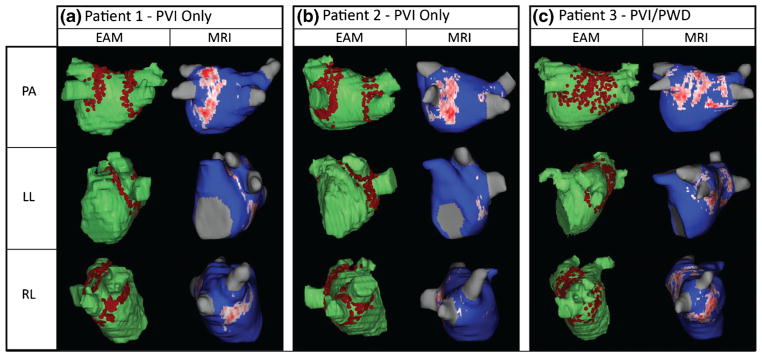
As shown in Fig. 4, pAbl was 30.3 %±7.7 whereas pScar was 13.7 %±5.7 for the entire cohort (p value <0.001). Ablation tag encirclement of the PVs in EAM did not consistently correlate with scar encirclement in LGE-MRI (Fig. 5). While the mean percent of ostial circumference covered by ablation tags in EAM was >90 % for all PVs, the corresponding mean in LGE-MRI varied between 69–75 % with the exception of the left inferior vein that had a mean of 85 % (Fig. 6; p values <0.001). The frequency of PV’s with >90 % ostial encirclement was also significantly different between EAM and LGE-MRI (left superior PV, 74.6 % EAM vs. 44.8 % MRI; left inferior PV, 79.1 % EAM vs. 52.2 % MRI; right superior PV, 91.3 % EAM, 33.7 % MRI; right inferior PV, 96.7 % EAM vs. 29.3 % MRI; p values <0.001). The difference between pAbl and pScar persisted among all three operators. Mean pAbl and mean pScar were 30.8 and 14.2 % for operator 1 (n=77), 31.1 and 13.1 % for operator 2 (n=9), and 25.1 and 10.0 % for operator 3 (n=8) respectively (p value<0.001 for all operators).
Fig. 4.
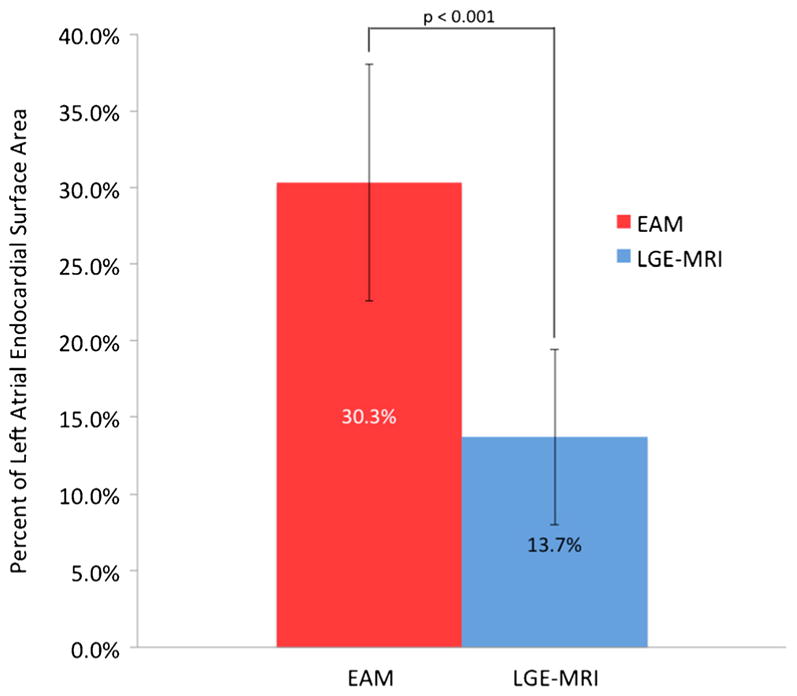
Comparison of the mean ablated area along with corresponding standard deviation in EAM and 3-month LGE-MRI for all patients (p<0.001). EAM electroanatomic mapping, LGE-MRI late-gadolinium enhancement magnetic resonance imaging
Fig. 5.
a–c Comparison of ablated area marked on EAM (left column) and scar on LGE-MRI (right column) depicting poor and inconsistent scar formation in three patients. EAM electroanatomic mapping, LGE-MRI late-gadolinium enhancement magnetic resonance imaging, PVI pulmonary vein isolation, PWD posterior wall debulking
Fig. 6.
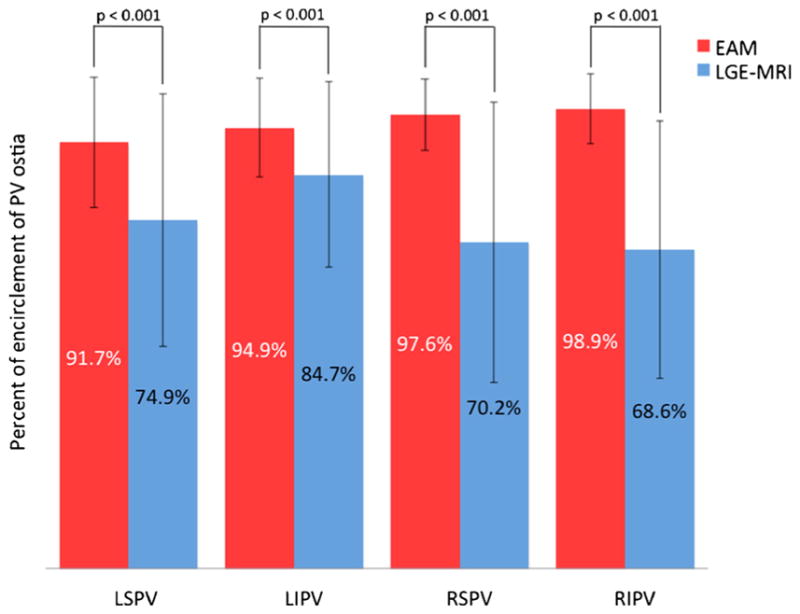
Comparison of mean percent encirclement of each PV in EAM and scar from LGE-MRI (p values <0.001 for each PV comparison). EAM electroanatomic mapping, LGE-MRI late-gadolinium enhancement magnetic resonance imaging, LSPV left superior pulmonary vein, LIPV left inferior pulmonary vein, RSPV right superior pulmonary vein, RIPV right inferior pulmonary vein
The Cohen’s kappa coefficient (95 % confidence interval) between observers for pulmonary vein isolation for ablation tags in EAM for the left superior PV was 0.525 (0.268–0.781), p<0.0001; left inferior PV was 0.548 (0.273–0.824), p<0.0001; right superior PV was 0.441 (0.119–0.764), p= 0.0001; and right inferior PV was 0.490 (0.110–1.000), p<0.0001. The Cohen’s kappa coefficient (95 % confidence interval) between observers for pulmonary vein isolation for scar in MRI for the left superior PV was 0.506 (0.434–0.556), p<0.0001; left inferior PV was 0.602 (0.459–0.687), p<0.0001; right superior PV was 0.462 (0.382–0.546), p<0.0001; and right inferior PV was 0.560 (0.493–0.674), p<0.0001. The intraclass correlation coefficient (95 % confidence interval) between observers for circumferential extent of pulmonary vein isolation for ablation tags in EAM for the left superior PV was 0.731 (0.611–0.851), p<0.0001; left inferior PV was 0.660 (0.515–0.806), p<0.0001; right superior PV was 0.2992 (0.088–0.510), p=0.0062; and right inferior PV was 0.899 (0.856–0.941), p<0.0001. The intraclass correlation (95 % confidence interval) between observers for circumferential extent of pulmonary vein isolation for scar in MRI for the left superior PV was 0.772 (0.692–0.853), p<0.0001; left inferior PV was 0.825 (0.760–0.889), p<0.0001; right superior PV was 0.864 (0.820–0.908), p<0.0001; and right inferior PV was 0.843 (0.793–0.893), p<0.001. These results indicate a high reproducibility across raters.
3.3 Correlation between AF recurrence and the difference between pAbl and pScar
In the univariable analysis, age, gender, hypertension, diabetes, coronary heart disease, heart failure, and the number of veins encircled in EAM or LGE-MRI were not significantly associated with AF recurrence. The LA surface area was marginally associated with recurrence of AF (HR, 1.011; p value= 0.05), and the difference between pAbl and pScar was significantly associated with AF recurrence (HR, 1.065; p value= 0.003). All multivariable analysis models involving this difference are summarized in Table 2. In multivariable models, age, gender, AF type, prior history of hypertension, diabetes, coronary heart disease and heart failure, number of PVs encircled in EAM or LGE-MRI, and pScar were not associated with AF recurrence; however, larger LA surface area was significantly correlated with increased AF recurrence risk (HR, 1.014; p value=0.004). Furthermore, the difference between pAbl and pScar was significantly associated with AF recurrence in multivariable analysis (HR, 1.066–1.089; p-values, 0.001–0.003). Figure 7 depicts the Kaplan-Meier survival curves for the freedom from AF recurrence in the large vs. small difference between pAbl and pScar. AF recurrence was significantly more common in the arm with larger difference (p=0.002).
Table 2.
Hazard ratios, confidence intervals, and p values for univariable analysis and multivariable analysis relating important variables to time to AF recurrence
| Univariable model | Model 1a | Model 2b | Model 3c | Model 4d | Model 5e | Model 6f | |
|---|---|---|---|---|---|---|---|
| Difference between EAM ablated area (pAbl) and LGE-MRI scar area (pScar) | 1.065 (1.021–1.109) p=0.003 |
1.067 (1.023–1.113) p=0.003 |
1.066 (1.022–1.114) p=0.003 |
1.066 (1.023–1.111) p=0.002 |
1.089 (1.033–1.145) p=0.001 |
1.061 (1.017–1.107) p=0.005 |
1.066 (1.021–1.113) p=0.003 |
| Age (per year increment) | 0.984 (0.944–1.027) p=0.472 |
0.979 (0.937–1.023) p=0.352 |
|||||
| Gender (male) | 0.632 (0.290–1.373) p=0.247 |
0.577 (0.260–1.281) p=0.176 |
|||||
| Hypertension | 0.735 (0.339–1.591) p=0.435 |
0.725 (0.324–1.621) p=0.434 |
|||||
| Diabetes | 0.731 (0.216–2.470) p=0.614 |
1.159 (0.307–4.369) p=0.827 |
|||||
| Coronary artery disease | 0.699 (0.277–1.762) p=0.449 |
0.568 (0.241–1.803 p=0.416) |
|||||
| Heart failure | 0.670 (0.251–1.783) p=0.423 |
0.782 (0.274–2.241) p=0.649 |
|||||
| Scar percent | 0.944 (0.876–1. p=0.138 |
019) | 1.019 (0.931–1.116) p=0.670 |
||||
| Left atrial surface area (cm2) | 1.011 (0.999–1.021) p=0.052 |
1.014 (1.004–1.024) p=0.004 |
|||||
| Total number of PVs by EAM (per increase) | 1.313 (0.851–2.025) p=0.218 |
1.158 (0.734–1.831) p=0.525 |
|||||
| Total number of PVs by MRI (per increase) | 0.888 (0.646–1.219) p=0.436 |
1.043 (0.731–1.499) p=0.811 |
AF atrial recurrence, EAM electroanatomic map, LGE-MRI late-gadolinium enhancement magnetic resonance imaging, PV pulmonary vein
Model 1: adjusting for age and gender
Model 2: adjusting for hypertension and diabetes mellitus status
Model 3: adjusting for coronary artery disease and heart failure
Model 4: adjusting for LGE-MRI scar percent and left atrial surface area
Model 5: adjusting for total number of PVs encircled in EAM
Model 6: adjusting for total number of PVs encircled in LGE-MRI
Fig. 7.
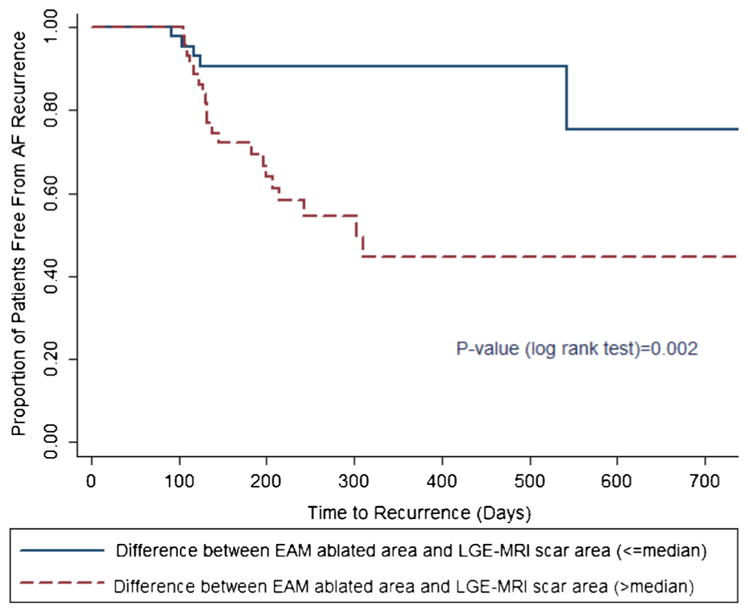
Kaplan-Meier survival curve by arms (low vs. high) of difference between EAM ablated area and LGE-MRI scar area. EAM electroanatomic mapping, LGE-MRI late-gadolinium enhancement MRI
4 Discussion
In our cohort, 26 out of 94 patients (27.6 %) had AF recurrence with a mean follow-up of 336 days. EAM significantly overestimated scar formation in LGE-MRI (Fig. 4), and the difference between the two areas strongly correlated with AF recurrence in the univariable and multivariable analysis (Table 2).
The clinical risk factor findings are concordant with other studies of patients undergoing AF ablation [14]. Similarly, our study agrees with the prior published data that the number of PVs encircled in EAM or MRI do not correlate with AF recurrence but LA area does correlate with AF recurrence [2]. The association of LA enlargement with increased AF recurrence likely reflects the larger area that is available for fibrillatory wavelets to sustain. Prior studies have reported some association between pScar and AF recurrence, but have described opposing trends [10, 15, 16]. One study involving 37 patients had no AF recurrence when pScar was greater than 23 % but this group only had nine patients [17]. In our current study, fourth quartile patients had a pScar of 17.0 % of the LA and had only three recurrences out of a total of 26 patients and on multivariate analysis the scar area itself was not associated with a higher recurrence rate (Table 2).
In concordance with our prior study, the pAbl significantly overestimated the pScar (Figs. 4 and 5, p value <0.001) and inconsistently correlated with the location of the eventual scar on LGE-MRI [8]. This significant overestimation of ablated area by EAM could be from lack of proper contact between the LA tissue and the ablation catheter, inadequate time spent at the ablation site, inadequate catheter force, inadequate energy delivered, or formation of transient edema at the ablation site that recovers over time. We did confirm acute isolation of the PVs using the lasso catheter, which is consistent with the relatively high percentage of PV isolation per the EAM (Fig. 6). Transient isolation of myocardial tissue despite the presence of gaps has been shown before and is likely from edema or transient injury that recovers over time, leading to restoration of electrical connection of the PVs [18]. In our study, the scar at the 3-month mark was much less circumferential compared to the EAM and could well be from recovery of areas that were ablated, resulting in transient injury rather than permanent scar.
Our present study goes further to evaluate the correlation between AF recurrence and poor scar formation for first time. This study shows that the difference between pAbl and pScar strongly correlated with risk of AF recurrence in univariable and multivariable analysis (Table 2, pFig. 7; all values <0.01). For each absolute percent higher difference, there was a 7–9 % increased AF recurrence (p values 0.001–0.003) depending on the model. Our study involved three different operators using different ablation techniques in terms of power delivered and duration of ablation highlighting the robustness of the study [9]. We recognize that the tagging of lesions on the EAM system is subjective but the main reason for subjectivity is the lack of any standard to mark lesions mostly because there is no way to ascertain the changes to tissue from ablation. As a result ablationists use their best judgement in tagging areas that are deemed to be ablated based on numerous factors. For the first time, we show that the bigger this discrepancy between areas deemed ablated and true scar correlates with worse outcome. We propose that this finding of higher recurrence rates among patients with larger differences in ablated areas and true scar argues for delivering lesions that result in scar in a more robust manner as it can potentially lead to better outcomes.
Direct feedback of tissue changes with ablation is one possible way to deliver more robust lesions but, unfortunately, none of the currently approved ablation technologies irrespective of the energy source allow that. The use of force-sensing catheters can improve catheter tip-to-tissue contact [19], but that is only one of many variables affecting robust lesion delivery. Currently, intracardiac echocardiogram is already used to assess for tip-tissue contact. Lasso catheters provide evidence of acute electrical isolation, but some lesions recover with time and gaps form in the ablation area allowing electrical conductivity to be established resulting in AF recurrence [16, 20]. Present techniques do not allow for identification of areas that are injured and have the potential to recover over time. Currently, ablation of myocardium is assumed based on numerous parameters like electrogram attenuation, change in impedance as well as a combination of other factors like the power used and time of ablation. All these are indirect measures and as a result prone to error. Electroanatomic mapping systems have developed more standardized techniques (VISITAG in CARTO) to tag ablated areas and the use of these technologies could also improve scar formation and reduce AF recurrence. However, one has to balance ablation resulting in more robust scar with too much ablation resulting in more complications such as perforation. Direct visualization of tissue changes as a result of ablation can also be very effective in delivering more robust lesions. MRI has excellent capabilities for imaging soft tissue and has been used to directly visualize ablation-related tissue changes as they occur [18, 21]. Real-time MRI has been used to carry out ablation procedures in animals and humans, and small gaps between ablation lesions have been visualized and acutely re-ablated in animals [22, 23]. However, limitations exist on using intraprocedural MRI in terms of evaluating long-term scar and doing AF ablation [24].
5 Conclusions
In AF ablation, EAM ablation mapping significantly overestimates scar formation when compared to LGE-MRI and the difference between the two is strongly associated with higher AF recurrence. This argues for improvement in ablation techniques resulting in more robustness in scar production after ablation.
6 Limitations
We acknowledge significant limitations to this study. Firstly, our study is a retrospective analysis of a single-center, AF ablation population. However, multiple operators with various ablation techniques were represented. Secondly, only two to three covariates were used at a time in our conservative model due to sample size limitations. However, various multivariable models were done to analyze all important variables. Also, this data is from time before contact force catheter was available. The use of contact force information can potentially lead to better scar formation in the targeted areas.
Acknowledgments
Research reported in this publication was supported by the National Heart, Lung, and Blood Institute of the National Institutes of Health under award number K23HL115084 to Ravi Ranjan. This project was also supported by grants from the National Institute of General Medical Sciences (8 P41 GM103545-14) from the National Institutes of Health through the Center for Integrative Biomedical Computing (CIBC).
Abbreviations
- AF
Atrial fibrillation
- LA
Left atrium
- MRA
Magnetic resonance angiography
- LGE-MRI
Late-gadolinium enhancement MRI
- EAM
Electroanatomic mapping
- PV
Pulmonary vein
- ICE
Intracardiac echocardiography
- pAbl
Ablated surface area as a percentage of LA surface area in EAM
- pScar
Left atrial wall covered by scar as a percentage of total endocardial surface area of the LA wall in LGE-MRI
Footnotes
Conflict of interest: Ravi Ranjan has been a consultant to Biosense Webster.
References
- 1.January CT, Wann LS, Alpert JS, Calkins H, Cigarroa JE, Cleveland JC, Jr, Conti JB, Ellinor PT, Ezekowitz MD, Field ME, Murray KT, Sacco RL, Stevenson WG, Tchou PJ, Tracy CM, Yancy CW. 2014 AHA/ACC/HRS Guideline for the Management of Patients with Atrial Fibrillation: a report of the American College of Cardiology/American Heart Association Task Force on Practice Guidelines and the Heart Rhythm Society. Journal of the American College of Cardiology. 2014;64(21):e1–e76. doi: 10.1016/j.jacc.2014.03.022. [DOI] [PubMed] [Google Scholar]
- 2.Hof I, Chilukuri K, Arbab-Zadeh A, Scherr D, Dalal D, Nazarian S, Henrikson C, Spragg D, Berger R, Marine J, Calkins H. Does left atrial volume and pulmonary venous anatomy predict the outcome of catheter ablation of atrial fibrillation? Journal of Cardiovascular Electrophysiology. 2009;20:1005–1010. doi: 10.1111/j.1540-8167.2009.01504.x. [DOI] [PubMed] [Google Scholar]
- 3.McGann C, Akoum N, Patel A, Kholmovski E, Revelo P, Damal K, Wilson B, Cates J, Harrison A, Ranjan R, Burgon NS, Greene T, Kim D, Dibella EV, Parker D, Macleod RS, Marrouche NF. Atrial fibrillation ablation outcome is predicted by left atrial remodeling on MRI. Circulation Arrhythmia and Electrophysiology. 2014;7:23–30. doi: 10.1161/CIRCEP.113.000689. [DOI] [PMC free article] [PubMed] [Google Scholar]
- 4.Dong J, Dickfeld T, Dalal D, Cheema A, Vasamreddy CR, Henrikson CA, Marine JE, Halperin HR, Berger RD, Lima JA, Bluemke DA, Calkins H. Initial experience in the use of integrated electroanatomic mapping with three-dimensional MR/CT images to guide catheter ablation of atrial fibrillation. Journal of Cardiovascular Electrophysiology. 2006;17:459–466. doi: 10.1111/j.1540-8167.2006.00425.x. [DOI] [PubMed] [Google Scholar]
- 5.Peters DC, Wylie JV, Hauser TH, Kissinger KV, Botnar RM, Essebag V, Josephson ME, Manning WJ. Detection of pulmonary vein and left atrial scar after catheter ablation with three-dimensional navigator-gated delayed enhancement MR imaging: initial experience. Radiology. 2007;243:690–695. doi: 10.1148/radiol.2433060417. [DOI] [PubMed] [Google Scholar]
- 6.Hunter RJ, Jones DA, Boubertakh R, Malcolme-Lawes LC, Kanagaratnam P, Juli CF, Davies DW, Peters NS, Baker V, Earley MJ, Sporton S, Davies LC, Westwood M, Petersen SE, Schilling RJ. Diagnostic accuracy of cardiac magnetic resonance imaging in the detection and characterization of left atrial catheter ablation lesions: a multicenter experience. Journal of Cardiovascular Electrophysiology. 2013;24:396–403. doi: 10.1111/jce.12063. [DOI] [PubMed] [Google Scholar]
- 7.Badger TJ, Daccarett M, Akoum NW, et al. Evaluation of left atrial lesions after initial and repeat atrial fibrillation ablation: lessons learned from delayed-enhancement MRI in repeat ablation procedures. Circulation Arrhythmia and Electrophysiology. 2010;3:249–259. doi: 10.1161/CIRCEP.109.868356. [DOI] [PMC free article] [PubMed] [Google Scholar]
- 8.Parmar BR, Jarrett TR, Burgon NS, Kholmovski EG, Akoum NW, Hu N, Macleod RS, Marrouche NF, Ranjan R. Comparison of left atrial area marked ablated in electroanatomical maps with scar in MRI. Journal of Cardiovascular Electrophysiology. 2014;25:457–463. doi: 10.1111/jce.12357. [DOI] [PMC free article] [PubMed] [Google Scholar]
- 9.Bunch TJ, Day JD. The electrophysiologist’s new clothes and the cardiac MRI that told the truth. Journal of Cardiovascular Electrophysiology. 2014;25(5):464–465. doi: 10.1111/jce.12369. [DOI] [PubMed] [Google Scholar]
- 10.McGann CJ, Kholmovski EG, Oakes RS, Blauer JJ, Daccarett M, Segerson N, Airey KJ, Akoum N, Fish E, Badger TJ, DiBella EV, Parker D, MacLeod RS, Marrouche NF. New magnetic resonance imaging-based method for defining the extent of left atrial wall injury after the ablation of atrial fibrillation. Journal of the American College of Cardiology. 2008;52:1263–1271. doi: 10.1016/j.jacc.2008.05.062. [DOI] [PubMed] [Google Scholar]
- 11.Badger TJ, Oakes RS, Daccarett M, Burgon NS, Akoum N, Fish EN, Blauer JJ, Rao SN, Adjei-Poku Y, Kholmovski EG, Vijayakumar S, Di Bella EV, MacLeod RS, Marrouche NF. Temporal left atrial lesion formation after ablation of atrial fibrillation. Heart Rhythm. 2009;6(2):161–168. doi: 10.1016/j.hrthm.2008.10.042. [DOI] [PubMed] [Google Scholar]
- 12.Ranjan R. Magnetic resonance imaging in clinical cardiac electrophysiology. Critical Reviews in Biomedical Engineering. 2012;40:409–426. doi: 10.1615/critrevbiomedeng.v40.i5.20. [DOI] [PubMed] [Google Scholar]
- 13.Calkins H, Kuck KH, Cappato R, Brugada J, Camm AJ, Chen SA, Crijns HJ, Damiano RJ, Jr, Davies DW, DiMarco J, Edgerton J, Ellenbogen K, Ezekowitz MD, Haines DE, Haissaguerre M, Hindricks G, Iesaka Y, Jackman W, Jalife J, Jais P, Kalman J, Keane D, Kim YH, Kirchhof P, Klein G, Kottkamp H, Kumagai K, Lindsay BD, Mansour M, Marchlinski FE, McCarthy PM, Mont JL, Morady F, Nademanee K, Nakagawa H, Natale A, Nattel S, Packer DL, Pappone C, Prystowsky E, Raviele A, Reddy V, Ruskin JN, Shemin RJ, Tsao HM, Wilber D. 2012 HRS/EHRA/ECAS expert consensus statement on catheter and surgical ablation of atrial fibrillation: recommendations for patient selection, procedural techniques, patient management and follow-up, definitions, endpoints, and research trial design: a report of the Heart Rhythm Society (HRS) Task Force on Catheter and Surgical Ablation of Atrial Fibrillation. Developed in partnership with the European Heart Rhythm Association (EHRA), a registered branch of the European Society of Cardiology (ESC) and the European Cardiac Arrhythmia Society (ECAS); and in collaboration with the American College of Cardiology (ACC), American Heart Association (AHA), the Asia Pacific Heart Rhythm Society (APHRS), and the Society of Thoracic Surgeons (STS). Endorsed by the governing bodies of the American College of Cardiology Foundation, the American Heart Association, the European Cardiac Arrhythmia Society, the European Heart Rhythm Association, the Society of Thoracic Surgeons, the Asia Pacific Heart Rhythm Society, and the Heart Rhythm Society. Heart Rhythm. 2012;9:632–696.e621. doi: 10.1016/j.hrthm.2011.12.016. [DOI] [PubMed] [Google Scholar]
- 14.Balk EM, Garlitski AC, Alsheikh-Ali AA, Terasawa T, Chung M, Ip S. Predictors of atrial fibrillation recurrence after radiofrequency catheter ablation: a systematic review. Journal of Cardiovascular Electrophysiology. 2010;21:1208–1216. doi: 10.1111/j.1540-8167.2010.01798.x. [DOI] [PubMed] [Google Scholar]
- 15.Kuck KH, Reddy VY, Schmidt B, Natale A, Neuzil P, Saoudi N, Kautzner J, Herrera C, Hindricks G, Jaïs P, Nakagawa H, Lambert H, Shah DC. A novel radio-frequency ablation catheter using contact force sensing: Toccata study. Heart Rhythm. 2012;9:18–23. doi: 10.1016/j.hrthm.2011.08.021. [DOI] [PubMed] [Google Scholar]
- 16.Miller MA, d’Avila A, Dukkipati SR, Koruth JS, Viles-Gonzalez J, Napolitano C, Eggert C, Fischer A, Gomes JA, Reddy VY. Acute electrical isolation is a necessary but insufficient endpoint for achieving durable PV isolation: the importance of closing the visual gap. Europace. 2012;14:653–660. doi: 10.1093/europace/eus048. [DOI] [PubMed] [Google Scholar]
- 17.McGann C, Kholmovski E, Blauer J, Vijayakumar S, Haslam T, Cates J, DiBella E, Burgon N, Wilson B, Alexander A, Prastawa M, Daccarett M, Vergara G, Akoum N, Parker D, MacLeod R, Marrouche N. Dark regions of no-reflow on late gadolinium enhancement magnetic resonance imaging result in scar formation after atrial fibrillation ablation. Journal of the American College of Cardiology. 2011;58:177–185. doi: 10.1016/j.jacc.2011.04.008. [DOI] [PMC free article] [PubMed] [Google Scholar]
- 18.Dickfeld T, Kato R, Zviman M, Nazarian S, Dong J, Ashikaga H, Lardo AC, Berger RD, Calkins H, Halperin H. Characterization of acute and subacute radio-frequency ablation lesions with nonenhanced magnetic resonance imaging. Heart Rhythm. 2007;4:208–214. doi: 10.1016/j.hrthm.2006.10.019. [DOI] [PMC free article] [PubMed] [Google Scholar]
- 19.Sohns C, Karim R, Harrison J, Arujuna A, Linton N, Sennett R, Lambert H, Leo G, Williams S, Razavi R, Wright M, Schaeffter T, O’Neill M, Rhode K. Quantitative magnetic resonance imaging analysis of the relationship between contact force and left atrial scar formation after catheter ablation of atrial fibrillation. Journal of Cardiovascular Electrophysiology. 2013;25:138–145. doi: 10.1111/jce.12298. [DOI] [PubMed] [Google Scholar]
- 20.Ranjan R, Kato R, Zviman MM, Dickfeld TM, Roguin A, Berger RD, Tomaselli GF, Halperin HR. Gaps in the ablation line as a potential cause of recovery from electrical isolation and their visualization using MRI. Circulation Arrhythmia and Electrophysiology. 2011;4:279–286. doi: 10.1161/CIRCEP.110.960567. [DOI] [PMC free article] [PubMed] [Google Scholar]
- 21.Dickfeld T, Kato R, Zviman M, Lai S, Meininger G, Lardo AC, Roguin A, Blumke D, Berger R, Calkins H, Halperin H. Characterization of radiofrequency ablation lesions with gadolinium-enhanced cardiovascular magnetic resonance imaging. Journal of the American College of Cardiology. 2006;47:370–378. doi: 10.1016/j.jacc.2005.07.070. [DOI] [PMC free article] [PubMed] [Google Scholar]
- 22.Lardo AC, McVeigh ER, Jumrussirikul P, Berger RD, Calkins H, Lima J, Halperin HR. Visualization and temporal/spatial characterization of cardiac radiofrequency ablation lesions using magnetic resonance imaging. Circulation. 2000;102:698–705. doi: 10.1161/01.cir.102.6.698. [DOI] [PubMed] [Google Scholar]
- 23.Ranjan R, Kholmovski EG, Blauer J, Vijayakumar S, Volland NA, Salama ME, Parker DL, MacLeod R, Marrouche NF. Identification and acute targeting of gaps in atrial ablation lesion sets using a real-time magnetic resonance imaging system. Circulation Arrhythmia and Electrophysiology. 2012;5:1130–1135. doi: 10.1161/CIRCEP.112.973164. [DOI] [PMC free article] [PubMed] [Google Scholar]
- 24.Piorkowski C, Grothoff M, Gaspar T, Eitel C, Sommer P, Huo Y, John S, Gutberlet M, Hindricks G. Cavotricuspid isthmus ablation guided by real-time magnetic resonance imaging. Circulation Arrhythmia and Electrophysiology. 2013;6:e7–e10. doi: 10.1161/CIRCEP.112.973719. [DOI] [PubMed] [Google Scholar]


