

Abstract
A previous semi‐mechanistic model described changes in fasting serum insulin (FSI), fasting plasma glucose (FPG), and glycated hemoglobin (HbA1c) in patients with type 2 diabetic mellitus (T2DM) by modeling insulin sensitivity and β‐cell function. It was later suggested that change in body weight could affect insulin sensitivity, which this study evaluated in a population model to describe the disease progression of T2DM. Nonlinear mixed effects modeling was performed on data from 181 obese patients with newly diagnosed T2DM managed with diet and exercise for 67 weeks. Baseline β‐cell function and insulin sensitivity were 61% and 25% of normal, respectively. Management with diet and exercise (mean change in body weight = −4.1 kg) was associated with an increase of insulin sensitivity (30.1%) at the end of the study. Changes in insulin sensitivity were associated with a decrease of FPG (range, 7.8–7.3 mmol/L) and HbA1c (6.7–6.4%). Weight change as an effector on insulin sensitivity was successfully evaluated in a semi‐mechanistic population model.
Study Highlights.
WHAT IS THE CURRENT KNOWLEDGE ON THE TOPIC? ☑ The existing semi‐mechanistic models for modeling disease progression of type 2 diabetes have yet to account for weight change, which is a potentially important biomarker for understanding the disease. • WHAT QUESTION DID THIS STUDY ADDRESS? ☑ Weight change as an effector for insulin sensitivity has been successfully evaluated in a semi‐mechanistic model which then alters the FSI‐FPG homeostasis, and subsequently HbA1c. • WHAT THIS STUDY ADDS TO OUR KNOWLEDGE ☑ The study demonstrated that the added information from weight change is important in developing a disease progression model for T2DM. • HOW THIS MIGHT CHANGE CLINICAL PHARMACOLOGY AND THERAPEUTICS ☑ Having quantified the effects of weight change on insulin sensitivity, the model could be applied in various settings, such as predicting HbA1c in a long‐term patient management program or in drug development.
There have been a number of models describing biomarkers of diabetes, ranging from empirical1 to more mechanistic models.2, 3, 4 The commonly used biomarkers for diagnosis and subsequent monitoring of disease progression are fasting plasma glucose (FPG), fasting serum insulin (FSI), and glycated hemoglobin A1c (HbA1c). These three biomarkers are the most commonly seen in long‐term data as well. However, the mechanisms behind the glucose‐insulin homeostasis dysfunction leading to diabetes are complex and there are many processes involved that are less studied.
The underlying processes in the disease progression of type 2 diabetes mellitus (T2DM) are the progressive loss of insulin sensitivity and β‐cell function.5 The disease onset of T2DM is initially driven by decreases in insulin sensitivity. With decreased insulin sensitivity, β‐cells compensate by overproducing insulin, which leads to hyperinsulinemia, in order to keep the glucose homeostasis stable. Eventually, insulin production is diminished from relative β‐cell failure because of exhaustion, and combined with decreasing insulin sensitivity then leads to hyperglycemia in T2DM.6
The standard of care for patients with T2DM is metformin treatment, diet, and exercise. The low‐sugar diet was originally introduced as a means to reduce the glucose intake and thereby reduce plasma glucose, but it was later discovered that any diet resulting in weight loss will reduce plasma glucose concentrations independent of glucose intake.7 It has been hypothesized that the weight loss is tightly linked to improved insulin sensitivity, such that plasma glucose concentrations decrease with maintained insulin concentrations.8, 9 de Winter et al.10 published a mechanism‐based model for T2DM that describes the disease progression and treatment effects of oral antidiabetic drugs on FSI, FPG, and HbA1c. In this model, insulin sensitivity and β‐cell failure at baseline are estimated and are changing over time. The model is implemented with the homeostatic model assessment (HOMA) method such that for a given FPG and FSI the estimated insulin sensitivity and β‐cell failure is predicted by HOMA‐S% and HOMA‐B%, respectively.11 FSI and FPG in this model was described with a linked turnover model with an inverse relationship, whereby FSI inhibits FPG production and FPG stimulates FSI production, mimicking the physiological feedback mechanisms for insulin and glucose. FPG is then used as an input for the production of HbA1c in a single compartment.
Although this model was a conceptual improvement over previous descriptive models, insulin sensitivity was estimated empirically without underlying mechanistic support. In a later effort, it was suggested that modeling insulin sensitivity as a mechanism‐based function of change in body weight could be superior than an empirical model.12 In this study, we evaluated this idea on a population that underwent diet and exercise, as well as including an additional postprandial glucose (PPG) factor and transit compartments to describe HbA1c formation.
METHODS
Study design
The data used in this study came from the placebo arm of a randomized, double blind, placebo‐controlled, multicenter, parallel‐group study (ClinicalTrails.gov identifier: NCT00236600) to determine the efficacy and safety of topiramate, an anticonvulsant drug that induces weight loss as a side effect. The placebo arm consisted of 181 (67 men, 114 women) Swedish, obese, newly diagnosed with T2DM, treatment‐naive patients. The studied population was between 18 and 75 years of age with a body mass index ≥27 kg/m2 and <50 kg/m2, median baseline weight (BLWT) of 104 kg (range, 72–159 kg), median baseline FSI of 17.8 µU/mL (range, 3.3–79.5 µU/mL), median baseline FPG of 7.6 mmol/L (range, 5–14.2 mmol/L), and median baseline HbA1c of 6.7% (range, 5.3–9.1%).
The subjects underwent six weeks of placebo run‐in before a randomized treatment phase (placebo arm in this case), which lasted for 60 weeks. The treatment phase was further divided into a titration phase (8 weeks) and a fixed dose maintenance phase (52 weeks). During the run‐in phase, the subjects were treated with placebo and a nonpharmacologic therapy, which was continued until the end of the active treatment phase. The following data were used in the analysis: weight (kg), which was collected every two weeks during the run‐in and titration phase, and every four weeks during the maintenance phase (up to 22 observations per subject), FSI collected at the start of the run‐in and titration phase, and twice during the maintenance phase (up to four observations per subject), FPG collected from the start of the run‐in until the end of the maintenance phase (up to 19 observations per subject), and HbA1c collected from the start of the run‐in phase until the end of the maintenance phase (up to 17 observations per subject).
The ancillary nonpharmacologic therapy consisted of an individualized energy‐deficient diet, a behavioral modification program, and a physical activity program explained by trained counselors was provided for all subjects from enrolment through to the final visit.
The prescribed energy‐deficient diet for each subject was 600 kcal (2500 kJ) less than the individual subject's total energy expenditure, which was calculated as 1.3 times the individual's basal metabolic rate.13 A diabetic diet with a maximum of 30% fat content was designed for each subject, and total energy expenditure was recalculated for all subjects six months (32 weeks) into the maintenance period.
Succinct model description
The weight HbA1c insulin glucose (WHIG) model (Figure 1) builds upon the previously published semi‐mechanistic model by de Winter et al.10 with an additional turnover model for body weight,12 which has a mechanism‐based relationship with insulin sensitivity. The homeostatic feedback relationship between FPG and FSI was described using linked turnover models, by which insulin sensitivity and FSI are inversely related to the production rate of FPG, because FSI has a strong inhibiting effect on hepatic glucose production, which is the primary determinant of FPG in the basal state,14 so that increased FSI and/or insulin sensitivity results in a lower FPG. The production of FSI was governed by the FPG concentration, modulated by natural β‐cell function, treatment effect (EFB), and their change over time. HbA1c was described using three transit compartments, with production determined by FPG with contribution from a PPG factor. Detailed descriptions of each model component are given below.
Figure 1.
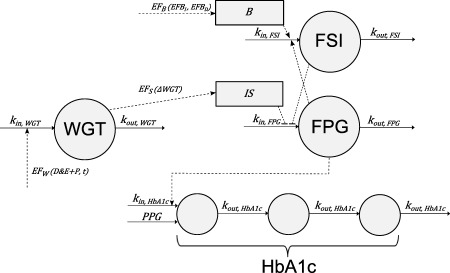
The weight glycated hemoglobin (HbA1c) insulin glucose (WHIG) model. EFW is the combined treatment effect of diet and exercise (D&E), placebo (P), and an upward counter‐effect dependent on time acting on the input of weight (WGT). Effect on insulin sensitivity (EFS) is a function of change in weight (ΔWGT), which changes insulin sensitivity (IS). EFB is the treatment effect on β‐cell function, which is a composite function consisting of its increase (EFBI) and decrease (EFBD) over time. EFB together with the natural progressive loss on β‐cell function (B), determines the production rate of fasting serum insulin (FSI). The homeostasis of FSI and fasting plasma glucose (FPG) is described with FSI inhibiting FPG production, whereas FPG stimulates FSI production. FPG and postprandial glucose (PPG) drive the production of HbA1c, which is described using three transit compartments.
Weight change
In essence, all weight change can be described with the basic energy flux balance equation,15 which is energy intake (I) subtracted by energy expenditure (E).
| (1) |
The daily rate of energy expenditure is proportional to body weight,16 thus, subjects’ diets were personalized based on their body weights. In the current study design, weight change from energy flux imbalance was achieved from a combination of diet (restricted energy intake) and exercise (increased energy expenditure), together known as diet and exercise (D&E). Although D&E should ideally be separated into two effects acting on the input (diet) and output (exercise) of weight, as described above, multiple D&E effects would be unidentifiable and therefore they have been combined as a single effect (EFD&E).
| (2) |
EFD&E+P is the sum of the parameters describing diet and exercise and placebo (EFP) for each individual (i). These parameters, normally distributed with mean of ΘD&E and ΘP and standard deviation (SD) of ωD&E and ωP, are modeled as step functions with the effect setting in at week zero and week six, respectively. EFD&E+P is therefore the total negative contribution to the overall effect on weight (EFW).
Over time, there is also a constant positive contribution on weight, attributed to the lack of motivation to continue diet and exercise and/or placebo effect wearing off, EFUP. EFUP is assumed to be a normally distributed parameter with mean ΘUP and SD ωUP; thus EFUP, even though having a positive median, can take both positive and negative values on an individual level, indicating a weight loss or gain, respectively.
The net effect on weight input (EFW) is therefore the product of EFUP and EFD&E+P, both normalized to one at time zero. Assuming a steady‐state, weight input is equal to weight output, so EFW below one will result in weight loss.
| (3) |
| (4) |
Insulin sensitivity
Changes in insulin sensitivity were modeled as inversely proportional to an individual's absolute change in weight (ΔWGT; Eq. (5). Effect on insulin sensitivity (EFS) is then expressed as a fraction that is scaled linearly (ScaleEFS) to ΔWGT (Eq. (6). Individual baseline weight (BLWTi) and ScaleEFs,i were estimated with a log‐normal distribution with a mean of ΘBLWT and ΘScaleEFs,i and a SD of ωBLWT and ωScaleEFs,i. The more an individual loses weight, the higher the insulin sensitivity and, conversely, the more an individual gains in weight, the lower the insulin sensitivity.
| (5) |
| (6) |
β‐cell function and disease progression
The rate of natural disease progression of β‐cell function deterioration (RB) was modeled as a logistic decline from baseline β‐cell function (B0) per year, and is normally distributed with a mean of ΘB0 and ΘRB and a SD of ωB0 and ωRB, respectively.
| (7) |
An empirical treatment effect (EFB) is multiplied with the natural β‐cell function to mimic the natural response of the β‐cells to stimulate insulin release in order to compensate for reduced insulin sensitivity in early stages of T2DM. EFB is a composite function comprising of a logistic increase (EFBI) using the start of treatment date (tTRT) as the half increase time with a steepness parameter (SEFBI), and a logistic decline (EFBD) that eliminates the effect with both the time at half decline (EFB50) and steepness (SEFBD) estimated. EFB increases from one and then back to one over the course of the study duration.
| (8) |
| (9) |
| (10) |
The maximal relative increase of β‐cell function (EFB, max.i) and the time of half decline (EFB50,i) are log‐normally distributed with a mean of ΘEFBmax and ΘEFB50 and a SD of ωEFBmax and ωEFB50, respectively.
FSI‐FPG homeostatic feedback model
The homeostasis between FSI and FPG is biologically complex and involves many processes, and could become even more complicated with an active treatment. In the WHIG model, the relationship between FSI and FPG are described with the following differential equations10:
| (11) |
| (12) |
The production rate of FSI is stimulated by FPG, but also negatively affected by natural disease progression leading to the loss of β‐cell function. FSI production could be further modified by a treatment effect (EFB; Eq. (10). For consistency with the HOMA equations, a lower physiological limit of 3.5mmol/L for FPG‐stimulated insulin secretion was used.17, 18 Therefore, IS0 is the estimated baseline insulin sensitivity with a normal distribution with a mean of ΘIS0 and a SD of ωIS0, which is then expressed as an inverse logit.
To speed up the modeling of these computationally intensive processes, short‐term dynamics for both FSI and FPG are assumed to be at steady‐state (SS; i.e., dA/dt = 0), and FSI production can be linearized with the quadratic equation (see Supplementary Appendix S1 online). KinFSI/KoutFSI is a constant 7.8, corresponding to a healthy FSISS of 7.8 uU/mL, which according to the updated HOMA2 is defined as the concentration of insulin that will have ∼100% insulin sensitivity.18 KinFPG/KoutFPG is a constant with value 35.1, calculated as a product from healthy FPGSS of 4.5 mmol/L given a FSISS of 7.8 uU/mL.
HbA1c model
The total amount of HbA1c is given by the sum of three transit compartments (Eq. (13). The rate of Hb glycation is driven by FPG, in addition to a residual rate that is independent of FPG, which is best explained as the contribution from PPG as well as an assay error.19, 20 The PPG effect is log‐normally distributed with a mean of ΘPPG and a SD of ωPPG. At times greater than zero, PPG contribution is reduced by an estimated scaling parameter (ScalePPG) that represents a PPG‐lowering effect from diet and exercise (Eq. (14). The population KinHbA1c is estimated, and KoutHbA1c is expressed as the number of transit compartments (3) divided by the population mean transit time (MTT; Eq. (17).
| (13) |
Where
| (14) |
| (15) |
| (16) |
| (17) |
Data analysis and model evaluation
Nonlinear mixed effects modeling using NONMEM 7.2 with first order conditional estimation method with interaction (FOCE+I) was used for data analysis.21 Model selection was based on mechanistic plausibility of its parameter values, and drop in the objective function value. Objective function value is a goodness‐of‐fit measurement proportional to minus twice the log likelihood. When comparing nested models, a significant improvement in goodness‐of‐fit can be concluded if the decrease in objective function value is larger than predicted by the χ2 distribution with degrees of freedom given by the number of parameters differing between the models.
Graphical assessment was performed using visual predictive checks (VPC). VPCs can be used to assess model fit by overlaying simulated datasets created from the model onto actual observations. In this way, discrepancies between the model and the data can be easily identified. Similar profiles between the simulated datasets and the observations indicate an adequate model. For the VPCs used in this study, the median and 95% prediction intervals based on 1,000 simulated datasets from the model were compared to the corresponding median, 2.5th, and 97.5th percentiles of the observed data. Model precision was assessed with relative standard errors obtained from a nonparametric bootstrap resampling of the final model (n = 500).
RESULTS
Weight change
The estimated BLWT of the study population was 104 kg. At the end of the study, the subjects on average had a 4% decrease in body weight. Predicted weight was affected by EFW, which had an overall weight loss effect (Figure 2). The model fit was assessed with VPCs, which shows both the absolute values and the relative change from baseline of weight over time (Figures 3 a and 4 a). Estimated parameter values for the diet and exercise effect, placebo effect, and the weight gain counter‐effect are shown in Table 1.
Figure 2.
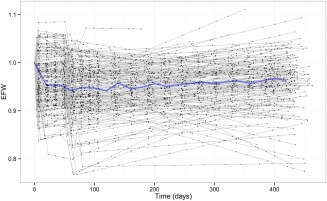
The estimated overall treatment effect on weight (EFW). Black dots are post hoc estimations from the WHIG model corresponding to an observation at that time point, joined by a gray line representing each individual. The blue line represents the median value per 20‐day bins. Diet and exercise effect (EFD&E) was modeled as an immediate step effect starting from time = 0, and the placebo effect (EFP) comes in later at the commencement of the active treatment phase around weeks six to seven. There is also a counter‐effect (EFUP) that determines the slope over time.
Figure 3.
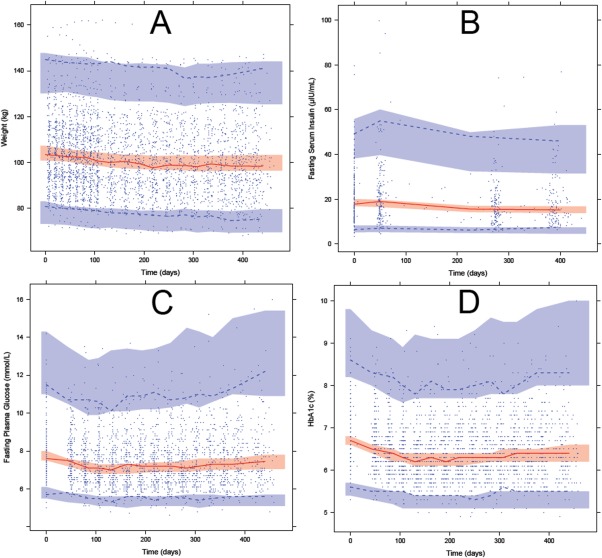
Visual predictive check of the biomarkers measured in the study population using the WHIG model. Blue circles indicate observations; red solid line indicate the median observations; dashed lines indicate the 97.5th and 2.5th percentiles of the observations; shaded areas indicate the 95% confidence intervals for the median (red), 97.5th and 2.5th percentiles (blue) from 1,000 simulated datasets. (a) Weight (kg) over time. (b) FSI (µIU/mL) over time. (c) FPG (mmol/L) over time. (d) HbA1c (%) over time.
Figure 4.
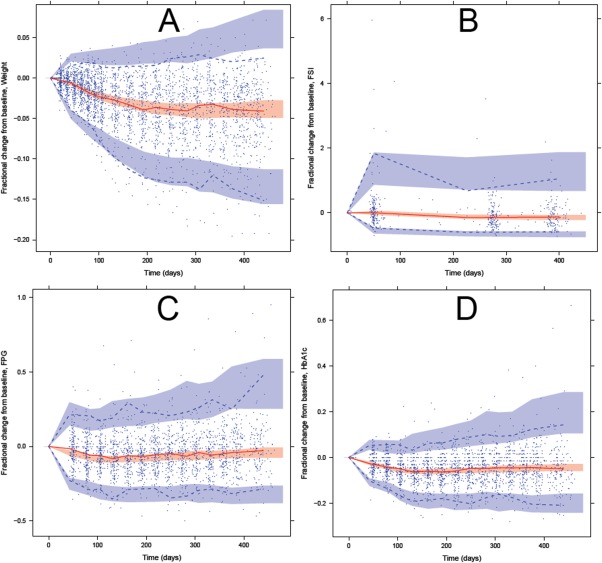
Visual predictive checks of change from baseline of the biomarkers measured in the study population using the WHIG model. Blue circles indicate observations; red solid line indicate the median observations; dashed lines indicate the 97.5th and 2.5th percentiles of the observations; shaded areas indicate the 95% confidence intervals for the median (red), 97.5th and 2.5th percentiles (blue) from 1,000 simulated datasets. (a) Fractional change of weight over time. (b) Fractional change of FSI over time. (c) Fractional change of FPG over time. (d) Fractional change of HbA1c over time.
Table 1.
Final parameter estimates with relative standard errors (RSE; %) and their respective interindividual variability (CV, %) of the WHIG model
| Parameter | Description | Typical value (RSE) | CVa, b (RSE)c |
|---|---|---|---|
| Weight | |||
| t½, WGT, d | Half‐life of weight compartment | 96.9 (27.1) | – |
| BLWT, kg | Baseline weight | 104 (1.1) | 14.6 (5.2) |
| Insulin sensitivity | |||
| IS0 | Baseline insulin sensitivity, logistic function | 1.1 (4.3) | 0.305 (6.4) |
| Scale EFS | Scaling factor of change in weight on insulin sensitivity | 0.0514 (11.9) | 67 (11.7) |
| β‐cell function | |||
| B0 | Baseline β‐cell function, logistic function | −0.446 (25.1) | 1.4 (7.6) |
| EFB, max | Maximal relative increase of β‐cell function | 0.171 (12.4) | 49.9 (20.9) |
| SEFBI | Shape parameter for logistic increase of β‐cell function | −3.69 (25.9) | – |
| SEFBD | Shape parameter for logistic decrease of β‐cell function | 8.05 (28.0) | – |
| EFB50, d | Time at half of EFB logistic decline | 190 (6.0) | 34.9 (11.4) |
| RB, y | Rate of baseline β‐cell function decrease per year, logits | 0.209 (34.9) | 0.21 (18.3) |
| HbA1c | |||
| MTT, d | Mean transit time of HbA1c | 38.9 (8.7) | – |
| Kin, HbA1c, %/d L/mmol | Rate constant, HbA1c compartments production | 0.0129 (10.2) | – |
| PPG, %/d | Residual HbA1c production rate independent of FPG | 0.0709 (9.9) | 15.4 (9.0) |
| Scale PPG | Scaling factor on PPG when time >0 | 0.963 (0.9) | – |
| Treatment effects | |||
| EFDE, % | Effect of diet and exercise at run‐in phase on weight input | 4.08 (29.1) | 35.6 (28.9) |
| EFP, % | Effect of placebo at active treatment phase on weight input | 2.28 (28.9) | 40.2 (35.3) |
| EFUP, %/y | Counter‐effect on weight input per year | 2.99 (52.3) | 74.4 (34.7) |
| Residual errors | |||
| Weight | Proportional residual error for weight | 0.00919 (4.2) | – |
| FSI | Proportional residual error for FSI | 0.262 (5.4) | 31.5 (16.3) |
| FPG | Proportional residual error for FPG | 0.0688 (2.8) | 25.6 (9.2) |
| HbA1c | Proportional residual error for HbA1c | 0.0241 (2.3) | 16.1 (23.7) |
Correlations between interindividual variabilities are found in Supplementary Appendix S2 online.
CVs for IS0, B0, RB, EFDE, EFP, and EFUP are reported as absolute values.
RSEs were obtained from a nonparametric bootstrap resampling (n = 500) of the final model.
Insulin sensitivity
The estimated baseline insulin sensitivity (IS0) was 25% of normal. At the end of the study, the population insulin sensitivity increased from 25% to 30.1% of normal as a result of weight change (mean ΔWGT = 4.1 kg; Figure 5).
Figure 5.
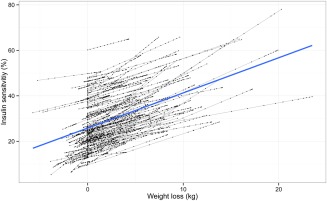
The relationship between weight loss and insulin sensitivity. Black dots are post hoc estimations from the WHIG model corresponding to an observation at that time point, joined by a gray line representing each individual. The blue line represents a linear regression of all points. In the WHIG model, weight loss and insulin sensitivity are linearly proportional. For each kilogram lost, an individual is expected to regain about 1.5% insulin sensitivity.
β‐cell function and disease progression
The estimated baseline β‐cell function (B0) in the study population was 61% of normal and the natural disease progression rate was estimated to be 5% reduction of starting β‐cell function per year. The shape of the empirical treatment effect EFB is seen in Figure 6 a.
Figure 6.
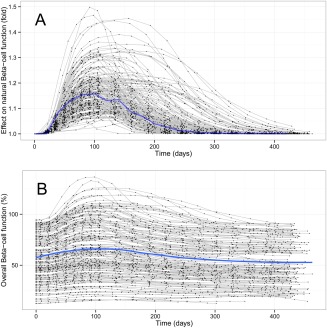
The predicted β‐cell function of the study population using the WHIG model. Black dots are post hoc estimations from the WHIG model corresponding to an observation at that time point, joined by a gray line representing each individual. The blue line represents the typical individual profile from the parameter estimates. (a) The empirical treatment effect EFB mimics the surge in β‐cell function typically seen in new patients with T2DM. (b) The net effect of β‐cell function over time, which is the product of the treatment effect EFB and natural β‐cell function.
The overall trend in β‐cell function, which is the natural disease progression of β‐cell function modified by treatment effect EFB, shows a small initial increase at the start of the study and returning to the baseline around day 300. The flexibility of the function allows for highly variable individual profiles of the β‐cell function, shown in Figure 6 b.
FSI change
The estimated baseline FSI was 19.2 µIU/mL and at the end of the study the mean decrease of FSI was 3.3 µIU/mL. Observations of FSI were sparse and highly variable with some FSI measurements being physiologically implausible (Figures 3 b and 4 b). If subjects did not adhere strictly to fasting before their measurements, high FSI was expected in combination with high FPG, and thus the correlation between FPG and FSI was investigated for those points with FSI >40 µIU/mL. Because the correlation was weak (R 2 = 0.0051), the high FSI observations were included in the analysis.
FPG change
The estimated baseline FPG was 7.8 mmol/L. At the end of the study, the mean decrease of FPG was 0.4 mmol/L. This apparently small difference is related to the opposing actions of weight loss (which led to increased insulin sensitivity) and β‐cell function decline (which led to decreased insulin production). The maximal decrease in FPG coincides with maximal insulin sensitivity around day 120, after which it returns back to near baseline levels at the end of the study (Figures 3 c and 4 c).
HbA1c change
The estimated baseline HbA1c was 6.7%. At the end of the study, the estimated mean decrease of HbA1c was 0.3%. If FPG is assumed as being the only factor driving HbA1c change, the change of FPG was expected to be quicker than and precede the change in HbA1c. However, this is not what was observed in the data (Figures 3 d and 4 d). To account for the similar rate of change in HbA1c and FPG and the less than expected delay in HbA1c change, an additional effect was added to the input of HbA1c glycation, which was modeled as the PPG contribution factor, and was estimated to be 0.0709% per day. At times after zero, PPG is further reduced by about 4% because of the reduced PPG contribution as a result of diet and exercise efforts. MTT across the HbA1c compartments was estimated to be 38.9 days.
The collected measurements of HbA1c values were rounded to 0.1%, which can be seen in Figures 3 d and 4 d as semidiscrete HbA1c values. To ensure the predictions in simulated datasets were similar to observed, predictions were also rounded to the closest 0.1%.
DISCUSSION
In the present study, we have evaluated the concept of using weight change as a driver for insulin sensitivity in a semi‐mechanistic model, subsequently using changes in insulin sensitivity to describe FSI, FPG, and HbA1c in a diabetic population. In the WHIG model, the mechanism‐based relationship between body weight change and insulin sensitivity was implemented as a linear function scaled to absolute weight change, which could be problematic if a patient had instead gained more than 10 kg in weight, as this would result in a negative insulin sensitivity. Although this was not an issue in our current study, a nonlinear function, such as an Emax function, would ensure a non‐negative insulin sensitivity when extrapolating beyond the data we used for modeling. Several different implementations were also investigated, such as other nonlinear relationships between ΔWT and insulin sensitivity, as well as using absolute vs. proportional weight change, or using weight change to affect β‐cell function. However, because of model stability and runtime concerns, using a linear function were found to be most appropriate.
Our study population had an overall small weight change (−4%), and because weight change affects insulin sensitivity and subsequently FPG, FSI, and HbA1c in the model, it is expected that our model will not produce large changes in the biomarkers relative to their baseline (Figures 3 and 4). This was a study design issue that could be rectified in a future study—for example, a more strict diet regimen for the subjects or conducting a longer duration study could both potentially produce larger weight changes to test the validity of the model. It was seen in our model that at the end of study duration, FPG and HbA1c were trending upward back to near baseline levels, and so it would be motivating to have data coming from a study with longer duration, for example, longer than five years, to compare how FPG and HbA1c progresses with time to the WHIG model. Another study design issue was that the diet and exercise effect could not be separately identified into a diet effect and an exercise effect. Exercise and diet could potentially have a different rate as well as site of action on affecting weight, but, in practice, it would be difficult to isolate the processes. Therefore, for the purposes of this study, combining both effects together as an input for weight was acceptable.
There were also other adaptations for the WHIG model compared to the de Winter model apart from weight. In the original model, HbA1c was estimated as a single compartment. Recent advances in red blood cell (RBC) and HbA1c modeling has suggested that using between 4 and 12 transit compartments19, 20, 22 was more suitable to model the lifespan of HbA1c. To reflect this finding, the WHIG model incorporated transit compartments for HbA1c. The number of optimal transit compartments for HbA1c was investigated but it was found that having more than three transit compartments were not significantly better objective function value‐wise but had a drastically increased runtime. Therefore, as a compromise between model runtimes and stability, the decision was made to include three transit compartments for the final model.
Other structural models for HbA1c were also investigated in the model building process, which included a transitional glycosylation RBC model,22 a mean plasma glucose RBC model,20 and an mean plasma glucose‐HbA1c model,23 in addition to other unpublished models, such as fractional and flexible glycation rates, but none of these candidate models offered an improvement in model fit (results not shown). It is also worthwhile to note that the estimated MTT in the current model is about 40 days, whereas the lifespan of RBCs is conventionally accepted at 90–120 days. This is because the MTT in the WHIG model reflects the lifespan of glycated RBCs, rather than the natural lifespan of RBCs, therefore, our estimate reflects the postglycation lifespan of RBCs, so a better comparison would be to the mean age of circulating RBCs, which has been found to be 39–56 days in a diabetic population.24 In addition, there was an apparent lack of delay between the times when HbA1c starts to decrease compared to FPG. Even though our model tried to account for this discrepancy with a PPG effect, there could be other confounders that were not identified, such as the patients not being at steady state of glycation at the start of the study. This is reasonable because the patients are newly diagnosed, which would lead to an HbA1c change from changes in FPG preceding the start of the study, such as drastic lifestyle changes immediately postdiagnosis. Another possible factor is the effect of exercise, which is known to contribute to hemolysis by mechanical stress,25 which would also reduce the average lifespan, making HbA1c respond quicker to changes in glucose and reduce HbA1c overall. This possibility of hemodestruction was also explored in our analysis as an additional first‐order elimination on HbA1c, but was not included in our final model due to lack of improvement.
Apart from the structural parameters, there were also changes to the stochastic or random effect parameters. In the original model, there were three covariances. In the WHIG model, the size of the variance‐covariance matrix had been increased to 10 (see Supplementary Appendix S2 online). In addition, the correlation between the residual error of FSI and FPG were also estimated. Implementing a large variance‐covariance matrix had a noticeable effect of reducing the variability of the upper and lower prediction intervals (blue areas in Figures 3 and 4).
The model was built using data from an obese population that was newly diagnosed with T2DM, which is only a part of the entire T2DM population. Applying the model on different demographics, such as non‐obese patients or patients with a long history of T2DM is the next logical step. Comparing the differences in the structural parameters between various demographics would be beneficial to both validate the model as well as providing insight to how the disease progression of T2DM differs between subpopulations.
Previously published population models on T2DM have so far not investigated the importance of using weight change as an effector for FSI‐FPG homeostasis. Given that obesity is a primary risk factor and generally regarded as the main driver for T2DM, which is a lifelong disease, patients often undergo weight change over the course of their lives from lifestyle adjustments. The main advantage of the WHIG model is that it is able to use a previously neglected biomarker to predict how it will affect HbA1c with a physiological basis, which is by changing insulin sensitivity.
In conclusion, the addition of weight change as an effector was evaluated and successfully implemented to the semi‐mechanistic disease progression model for T2DM. To the authors’ knowledge, this was the first thorough study in which weight change was implemented in a semi‐mechanistic model to quantify its effects on insulin sensitivity to predict the changes of fasting plasma glucose, fasting serum insulin, and HbA1c in humans with T2DM. As T2DM is intricately linked with obesity, further application of this updated model could prove useful in understanding the disease.
Conflict of Interest
Steve Choy's doctoral studies are supported by Johnson & Johnson Pharmaceutical Research and Development.
Author Contributions
S.C., M.C.K., M.O.K., and W.D.W. wrote the manuscript. S.C., M.C.K., M.O.K., and W.D.W. designed the research. S.C. performed the research. S.C., M.C.K., M.O.K., and W.D.W. analyzed the data.
Supporting information
Supporting Information
Supporting Information
Supporting Information
Supporting Information
Acknowledgment
Steve Choy's doctoral studies are supported by Johnson & Johnson Pharmaceutical Research and Development.
References
- 1. Nathan, D.M. et al Translating the A1C assay into estimated average glucose values. Diabetes Care 31, 1473–1478 (2008). [DOI] [PMC free article] [PubMed] [Google Scholar]
- 2. Silber, H.E. , Jauslin, P.M. , Frey, N. & Karlsson, M.O. An integrated model for the glucose‐insulin system. Basic Clin. Pharmacol. Toxicol. 106, 189–194 (2010). [DOI] [PubMed] [Google Scholar]
- 3. Caumo, A. & Cobelli, C. Hepatic glucose production during the labeled IVGTT: estimation by deconvolution with a new minimal model. Am. J. Physiol. 264(5 Pt 1), E829–E841 (1993). [DOI] [PubMed] [Google Scholar]
- 4. Frey, N. , Laveille, C. , Paraire, M. , Francillard, M. , Holford, N.H. & Jochemsen, R. Population PKPD modelling of the long‐term hypoglycaemic effect of gliclazide given as a once‐a‐day modified release (MR) formulation. Br. J. Clin. Pharmacol. 55, 147–157 (2003). [DOI] [PMC free article] [PubMed] [Google Scholar]
- 5. Kahn, S.E. , Hull, R.L. & Utzschneider, K.M. Mechanisms linking obesity to insulin resistance and type 2 diabetes. Nature 444, 840–846 (2006). [DOI] [PubMed] [Google Scholar]
- 6. DeFronzo, R.A. , Bonadonna, R.C. & Ferrannini, E. Pathogenesis of NIDDM. A balanced overview. Diabetes Care 15, 318–368 (1992). [DOI] [PubMed] [Google Scholar]
- 7. Heilbronn, L.K. , Noakes, M. & Clifton, P.M. Effect of energy restriction, weight loss, and diet composition on plasma lipids and glucose in patients with type 2 diabetes. Diabetes Care 22, 889–895 (1999). [DOI] [PubMed] [Google Scholar]
- 8. Henry, R.R. , Wallace, P. & Olefsky, J.M. Effects of weight loss on mechanisms of hyperglycemia in obese non‐insulin‐dependent diabetes mellitus. Diabetes 35, 990–998 (1986). [DOI] [PubMed] [Google Scholar]
- 9. Wing, R.R. , Blair, E.H. , Bononi, P. , Marcus, M.D. , Watanabe, R. & Bergman, R.N. Caloric restriction per se is a significant factor in improvements in glycemic control and insulin sensitivity during weight loss in obese NIDDM patients. Diabetes Care 17, 30–36 (1994). [DOI] [PubMed] [Google Scholar]
- 10. de Winter, W. et al A mechanism‐based disease progression model for comparison of long‐term effects of pioglitazone, metformin and gliclazide on disease processes underlying type 2 diabetes mellitus. J. Pharmacokinet. Pharmacodyn. 33, 313–343 (2006). [DOI] [PubMed] [Google Scholar]
- 11. Matthews, D.R. , Hosker, J.P. , Rudenski, A.S. , Naylor, B.A. , Treacher, D.F. & Turner, R.C. Homeostasis model assessment: insulin resistance and beta‐cell function from fasting plasma glucose and insulin concentrations in man. Diabetologia 28, 412–419 (1985). [DOI] [PubMed] [Google Scholar]
- 12. de Winter, W. , Rossenu, S. , Dunne, A. & Vermeulen, A. Integrating a model for weight change into the mechanism‐based model for type 2 diabetes. Annual meeting of the Population Approach Group in Europe. Abstract #1654 (2009).
- 13. World Health Organization. Human energy requirements: report of a Joint FAO/WHO/UNU Expert Consultation, Rome, Italy, October 17–24, 2001. Food and Nutrition Technical Report Series (2001).
- 14. DeFronzo, R.A. Pathogenesis of type 2 diabetes mellitus. Med. Clin. North Am. 88, 787–835 (2004). [DOI] [PubMed] [Google Scholar]
- 15. Chow, C.C. & Hall, K.D. The dynamics of human body weight change. PLoS Computat. Biol. 4, e1000045 (2008). [DOI] [PMC free article] [PubMed] [Google Scholar]
- 16. Heymsfield, S.B. & Pietrobelli, A. Body size and human energy requirements: reduced mass‐specific total energy expenditure in tall adults. Am. J. Hum. Biol. 22, 301–309 (2010). [DOI] [PubMed] [Google Scholar]
- 17. Levy, J.C. , Matthews, D.R. & Hermans, M.P. Correct homeostasis model assessment (HOMA) evaluation uses the computer program. Diabetes Care 21, 2191–2192 (1998). [DOI] [PubMed] [Google Scholar]
- 18. Wallace, T.M. , Levy, J.C. & Matthews, D.R. Use and abuse of HOMA modeling. Diabetes Care 27, 1487–1495 (2004). [DOI] [PubMed] [Google Scholar]
- 19. Lledó‐García, R. , Kalicki, R.M. , Uehlinger, D.E. & Karlsson, M.O. Modeling of red blood cell life‐spans in hematologically normal populations. J. Pharmacokinet. Pharmacodyn. 39, 453–462 (2012). [DOI] [PubMed] [Google Scholar]
- 20. Lledó‐García, R. , Mazer, N.A. & Karlsson, M.O. A semi‐mechanistic model of the relationship between average glucose and HbA1c in healthy and diabetic subjects. J. Pharmacokinet. Pharmacodyn. 40, 129–142 (2013). [DOI] [PubMed] [Google Scholar]
- 21. Beal, S.L. , Sheiner, L.B. , Boeckmann, A.J. & Bauer, R.J. NONMEM User's Guides. (Ellicott City, MD: Icon Development Solutions; 1989–2014). [Google Scholar]
- 22. Hamrén, B. , Björk, E. , Sunzel, M. & Karlsson, M. Models for plasma glucose, HbA1c, and hemoglobin interrelationships in patients with type 2 diabetes following tesaglitazar treatment. Clin. Pharmacol. Ther. 84, 228–235 (2008). [DOI] [PubMed] [Google Scholar]
- 23. Møller, J.B. et al Longitudinal modeling of the relationship between mean plasma glucose and HbA1c following antidiabetic treatments. CPT Pharmacometrics Syst. Pharmacol. 2, e82 (2013). [DOI] [PMC free article] [PubMed] [Google Scholar]
- 24. Cohen, R.M. et al Red cell life span heterogeneity in hematologically normal people is sufficient to alter HbA1c. Blood 112, 4284–4291 (2008). [DOI] [PMC free article] [PubMed] [Google Scholar]
- 25. Mairbäurl, H. Red blood cells in sports: effects of exercise and training on oxygen supply by red blood cells. Front. Physiol. 4, 332 (2013). [DOI] [PMC free article] [PubMed] [Google Scholar]
Associated Data
This section collects any data citations, data availability statements, or supplementary materials included in this article.
Supplementary Materials
Supporting Information
Supporting Information
Supporting Information
Supporting Information