

Abstract
Nucleus accumbens (NAc) neurons encode features of stimulus learning and action selection associated with rewards. The NAc is necessary for using information about expected outcome values to guide behavior after reinforcer devaluation. Evidence suggests that core and shell subregions may play dissociable roles in guiding motivated behavior. Here, we recorded neural activity in the NAc core and shell during training and performance of a reinforcer devaluation task. Long–Evans male rats were trained that presses on a lever under an illuminated cue light delivered a flavored sucrose reward. On subsequent test days, each rat was given free access to one of two distinctly flavored foods to consume to satiation and were then immediately tested on the lever pressing task under extinction conditions. Rats decreased pressing on the test day when the reinforcer earned during training was the sated flavor (devalued) compared with the test day when the reinforcer was not the sated flavor (nondevalued), demonstrating evidence of outcome-selective devaluation. Cue-selective encoding during training by NAc core (but not shell) neurons reliably predicted subsequent behavioral performance; that is, the greater the percentage of neurons that responded to the cue, the better the rats suppressed responding after devaluation. In contrast, NAc shell (but not core) neurons significantly decreased cue-selective encoding in the devalued condition compared with the nondevalued condition. These data reveal that NAc core and shell neurons encode information differentially about outcome-specific cues after reinforcer devaluation that are related to behavioral performance and outcome value, respectively.
SIGNIFICANCE STATEMENT Many neuropsychiatric disorders are marked by impairments in behavioral flexibility. Although the nucleus accumbens (NAc) is required for behavioral flexibility, it is not known how NAc neurons encode this information. Here, we recorded NAc neurons during a training session in which rats learned that a cue predicted a specific reward and during a test session when that reward value was changed. Although encoding in the core during training predicted the ability of rats to change behavior after the reward value was altered, the NAc shell encoded information about the change in reward value during the test session. These findings suggest differential roles of the core and shell in behavioral flexibility.
Keywords: accumbens, behavior, devaluation, electrophysiology, motivation, rat
Introduction
Animals depend on the ability to modify their behavior to achieve specific outcomes. Because a behavior that once produced a positive outcome can later produce a negative outcome, it is important to be able to adjust behavior flexibly. Certain psychiatric disorders (e.g., drug addiction) are characterized by a disruption in this type of flexibility (Lubman et al., 2004; Lucantonio et al., 2012), leading to difficulty in changing behaviors despite negative consequences. Characterizing the underlying processes that control/modulate behavioral flexibility is therefore critical to understanding and treating these disorders.
Behavioral flexibility can be measured using reinforcer devaluation tasks in which the expected value of a reward is decreased. There are several necessary processes to perform this task: (1) forming an association between a cue and an outcome, (2) registering the decreased value of the reinforcer after its devaluation, and (3) integrating the learned cue–outcome association with the decreased outcome value to direct behavior. Importantly, testing is performed under extinction, so rats must use an internal representation of the previously learned association and alter behavior based on the newly computed expected outcome (Murray and Izquierdo, 2007; Murray et al., 2007; Lucantonio et al., 2014).
Although the prefrontal cortex has largely been implicated in behavioral flexibility as measured by reinforcer devaluation (Murray et al., 2007; McDannald et al., 2014), less is known about the involvement of subcortical regions such as the nucleus accumbens (NAc) in this process. The NAc is postulated to function as a limbic–motor interface (Mogenson et al., 1980), receiving value information from limbic (and prefrontal) structures and projecting to motor regions to guide behavior. In support, NAc neurons encode associative information about outcome-predictive cues (Carelli, 2000, 2004; Day et al., 2006; Day and Carelli, 2007; Day et al., 2007) and actions (Carelli and Ijames, 2000, 2001; Hollander et al., 2002). Furthermore, NAc neurons encode the devaluation of natural reinforcers after conditioned taste aversion (Roitman et al., 2010) and delayed cocaine access (Wheeler et al., 2008). In addition, when rats choose between predictors of differently valued rewards, NAc neurons encode information regarding the relative outcome values and behavioral responses (Roesch et al., 2009; Day et al., 2011; Sugam et al., 2014). Finally, NAc lesions disrupt performance in reinforcer devaluation tasks (Corbit et al., 2001; Lex and Hauber, 2010; Singh et al., 2010).
Despite its role in processing value-based associative information, less is known about whether NAc neurons track cue–outcome associations under changing conditions. In prior reports, cues were consistently followed by outcomes (i.e., not under extinction), allowing rats to alter behavior based on previously or newly acquired value representations. Therefore, it is not known how NAc neurons encode outcome-predictive information based on a newly computed expected (decreased) outcome value. Furthermore, evidence suggests that the NAc core and shell may play unique roles in guiding motivated behavior. For example, the core appears to be involved in learning and action during goal-directed behavior (Carelli, 2004; Saddoris et al., 2013), whereas the shell processes hedonic or motivational value (Kelley, 2004; Zorrilla and Koob, 2013; Castro et al., 2015; Saddoris et al., 2015a). Both computational processes are likely necessary for flexible behavior.
Here, we used a reinforcer devaluation task in which the reward-predictive cue and subsequent action are always paired with the same outcome, but the expected outcome value was later manipulated by satiation. This allowed us to determine whether NAc neurons integrate cue–outcome associations with the changed outcome value even though the animal never experienced the cues paired with that outcome in their devalued state. We recorded NAc core and shell neurons during a well learned task and after devaluation of the reinforcer via selective satiation (under extinction). Given the putative roles of the NAc core in learning and the NAc shell in motivational value encoding, we hypothesized that the neural encoding in the core during the task would predict the degree of behavioral flexibility after devaluation, whereas shell neurons would encode the motivational change in outcome value after devaluation.
Materials and Methods
Subjects
Twenty-six male Long–Evans rats (Charles River Laboratories) 90–120 d of age and weighing ∼300–350 g at the beginning of the study were used. Animals were housed individually in polypropylene cages and maintained on a standard 12:12 h light/dark cycle with lights on at 7:00 A.M. Food and water were available ad libitum during the 1 week adaptation period to the vivarium before behavioral training. During behavioral training, rats were restricted to no less than 90% of their preoperative body weight by food access to 20–25 g of standard rat chow (Purina RMH3000) per day. Animal procedures were approved by the University of North Carolina at Chapel Hill Institutional Animal Care and Use Committee.
Preoperative behavioral training
Training and testing were done in Med Associates operant chambers, as described previously (Hollander et al., 2002; Day et al., 2006; Cacciapaglia et al., 2011; Day et al., 2011). Behavioral training was modified from a previously described task (West et al., 2011b; West et al., 2012; West et al., 2013) and is depicted in Figure 1A. During lever training, rats initially had to press a single lever for a food pellet and were then trained to press a second lever in the chamber in the same manner (the levers were located on the left and right sides of the food receptacle). Next, they progressed to an FR5 schedule on the 2 spatially distinct levers (∼1–2 weeks training). Subsequently, during cue training, a cue light was illuminated over 1 of the 2 levers and, after 5 s, the lever under that cue light was extended into the chamber (the other cue light/lever remained off/retracted). The rats were required to press the active lever to receive a specific reinforcer (e.g., raspberry-flavored sucrose pellet; Purina TestDiet) on an FR5 schedule. After the rat pressed 5 times or 30 s elapsed, the active lever retracted until the next trial was initiated. The intertrial interval was 50 s for all cue training sessions. The position of the active cue light/lever alternated for each trial pseudorandomly. Rats continued on the FR5 schedule until they received a reinforcer on at least 90% of the trials (at least 45 of 50 trials) in two consecutive daily test sessions. Once the rats reached this criterion, they were moved to a VR9 schedule in which they had to press, on average, 9 times to receive a reinforcer (VR range 4–13) on the active lever. Once rats earned at least 45 reinforcers over 45 min (50 possible trials) on the VR9 schedule (3–10 d), they underwent surgical procedures for electrophysiology microwire implantation (described below). On every cue training session, rats also received an equal amount of a second (i.e., different) reinforcer in their home cages (e.g., peanut-butter-flavored pellet; Purina Test Diet) at least 2 h after they completed cue training for that day. This ensured that all rats had equal experience with both reinforcers. Reinforcers were counterbalanced across rats such that half the rats received raspberry-flavored pellets during training (and peanut-butter-flavored pellets in their home cages) and the other half received peanut-butter-flavored pellets during training (and raspberry-flavored pellets in their home cages).
Figure 1.

Schematic diagram of experimental timeline (A) in which the arrows represent the days that NAc neurons were recorded (last cue training session and two devaluation test days) and devaluation test days (B). See Materials and Methods for details.
Surgery
Rats were anesthetized with a ketamine hydrochloride (100 mg/kg) and xylazine hydrochloride (10 mg/kg) mixture (intramuscularly) and implanted with a microwire electrode arrays aimed at the NAc core or shell. Each array was custom designed, purchased from a commercial source (NB Labs) and described in detail previously (Carelli et al., 2000). Briefly, arrays consisted of 8 microwires (50 μm diameter) and were permanently implanted in the NAc core (AP: +1.8, ML: ±1.3, DV: −6.2 from dura) or shell (AP: +1.8, ML: ±0.8, DV: −6.2 from dura).
Postoperative behavioral training and testing
After at least 7 d of recovery, rats resumed cue training (∼1–5 d). Once rats earned at least 45 reinforcers on the VR9 schedule during cue training, NAc cell firing was recorded during the final day of cue training before testing and during two subsequent devaluation test days (Fig. 1A). The devaluation test days were divided in two distinct phases as shown in Figure 1B. In the first phase (satiation), rats received ad libitum access for 20–30 min of either the same reinforcer received during training (devalued) or the other reinforcer (nondevalued) immediately before testing to achieve outcome-selective satiation. In the second phase (testing under extinction), rats were allowed to lever press for 20 trials using the same cues as training except no reinforcers were delivered. That is, in this test session, the cue light was illuminated and, after 5 s, the lever extended into the operant chamber as in training except no reinforcer was delivered when rats pressed. Rats were tested on an FR9 schedule to ensure each trial would contain the same number of lever presses before the lever retracted. After at least 48 h and one cue training reminder session, the same test was repeated except that the other reinforcer was consumed before testing. The order of reinforcer was counterbalanced so that half of the rats were sated on the different reinforcer (nondevalued) on the first devaluation test day and the other half were sated on the same reinforcer (devalued) on the first devaluation test day.
Consummatory test
Once rats finished testing in the operant chambers (at least 2 d after the last test day), they were given a consummatory session as a test for successful devaluation of the reinforcer (Fig. 1A). Specifically, rats were allowed 20–30 min to eat one of the foods (training reinforcer or different reinforcer) ab libitum in an empty standard rat cage. After selective satiation, rats were given access to both reinforcers for 20 min and the amount of each reinforcer consumed was recorded. At least 48 h later, the same test was repeated but the other reinforcer was devalued.
Electrophysiological recordings
Electrophysiological procedures have been described in detail previously (Day et al., 2011). Before the start of each session, the subject was connected to a flexible recording cable attached to a commutator (Med Associates), which allowed virtually unrestrained movement within the chamber. The head stage of each recording cable contained 16 miniature unity-gain field effect transistors. Neurons were recorded differentially between each active and the inactive (reference) electrode from the permanently implanted microwires. The inactive electrode was examined before the start of the session to verify the absence of neuronal spike activity and served as the differential electrode for other electrodes with cell activity. Online isolation and discrimination of neuronal activity was accomplished using a commercially available neurophysiological system [multichannel acquisition processor (MAP) system; Plexon). Multiple window-discrimination modules and high-speed analog-to-digital signal processing in conjunction with computer software enabled isolation of neuronal signals based on waveform analysis. The neurophysiological system incorporated an array of digital signal processors (DSPs) for continuous spike recognition. The DSPs provided a continuous parallel digital output of neuronal spike events to a Pentium computer. Another computer processed operant chamber input and output (Med Associates) and sent digital outputs corresponding to each event to the MAP box to be time stamped along with the neural data. Discrimination of individual waveforms began by setting a threshold level (well above background noise) for each wire. Units detected had to display peak voltage at least 20% greater than baseline. Individual waveforms corresponding to a single cell were discriminated using template analysis procedures and time–voltage boxes provided by the neurophysiological software system (MAP system; Plexon). Cell recognition and sorting was finalized after the experiment using the Offline Sorter program (Plexon). This allowed neuronal data to be further assessed based on the principle component analysis of the waveforms, cell firing characteristics such as autocorrelograms and interspike interval distribution to ensure that putative cells showed biologically appropriate firing refractory periods, and cross-correlograms to ensure that multiple cells recorded on the same wires showed firing independently of each other.
Data analysis
Behavior.
The total number of lever presses after consumption of the same reinforcer received during training (same, devalued) was compared with lever presses after the consumption of the second reinforcer (different, nondevalued) using a Wilcoxon matched-pairs signed-rank test for all of the animals. The mean number of trials in which the rats lever pressed and the mean latency to press after consumption of the same reinforcer received during training (same, devalued) was compared after the consumption of the other reinforcer (different, nondevalued) using a Wilcoxon matched-pairs signed-rank test for all of the animals. To determine whether behavior was similar in animals from which core and shell recordings were made during the reinforcer devaluation task, the number of lever presses after selective satiation was analyzed using a two-way ANOVA with subregion (core, shell, both) and devaluation status (devalued vs nondevalued) as factors. “Both” refers to instances in which electrodes were placed in both the core (one side of brain) and shell (other side) in a single animal.
Further, we calculated a “devaluation index” according to the following formula: [responses after the satiation of the different reinforcer (nondevalued; ND) minus responses after satiation of the same reinforcer (devalued; D)/total responses (ND + D)]. A devaluation index of 1 indicates that all of the presses were under the nondevalued condition, 0 represents equal number of presses under the nondevalued and devalued conditions, and −1 indicates all of the presses were under the devalued condition. Therefore, based on this formula, the greater the rat suppressed responding in the devalued condition (but continued responding in the nondevalued condition), the closer the value would be to 1. The ability to suppress responding represents flexible behavior, so values >0 would represent flexible behavior. We used these values to correlate the strength of the devaluation effect with the percentage of NAc encoding during cue training, nondevalued test day, and the devalued test day (see below).
For the consummatory test, we averaged the amount of food (g) each animal ate in the two test sessions based on whether the food was the same food the rat had just consumed (devalued) or a different food (nondevalued) and analyzed these values across rats using a Wilcoxon matched-pairs signed-rank test. Behavioral data analyses were performed using GraphPad Prism software.
Electrophysiology.
Changes in neuronal firing patterns relative to task events were analyzed by constructing perievent histograms (PEHs) surrounding each cue presentation using commercially available software (Neuroexplorer for Windows version 4.034; Plexon). PEHs (200 ms bins; 20 s total) were constructed on the last cue training day before testing and on the 2 test days (described above). The activity of each cell was examined relative to cue onset (0–5 s after cue presentation) for all trials or relative to the first lever press in the FR9 series and compared with its baseline activity (10–0 s before cue onset). Individual units were categorized as showing either a decrease (inhibition) or an increase (excitation) in firing rate compared with baseline (i.e., termed “phasic” activity) or no difference in activity from baseline (termed “nonphasic”). Specifically, cells were classified as phasic if, during cue presentation, the firing rate was greater than (excitation) or less than (inhibition) the 99.9% confidence interval projected from the baseline period for at least one 200 ms time bin. This confidence interval was selected such that only robust responses were categorized as excitatory or inhibitory, following established procedures (Day et al., 2011; West et al., 2014). Some neurons in this analysis exhibited low baseline firing rates and the 99.9% confidence interval included zero. When this was the case, inhibitions were assigned if the number of consecutive 0 spikes/0 bins in the event epoch was at least double the number of consecutive 0 spikes/s time bins during the baseline period. Units that exhibited both excitations and inhibitions within the same epoch were classified by the response that was most proximal to the event.
The percentage of phasic cells that responded to the cue presentation in the NAc core or shell in each individual animal were calculated during the training day and correlated with the animals' subsequent test day performance as measured by the devaluation index (see above). Only animals with at least four cells recorded in each region were included in this analysis (core: n = 13 rats, shell: n = 11 rats). We also examined the percentage of phasic cells that responded to the cue in both devaluation test days (see above) and analyzed these data using a two-way ANOVA with regions (core vs shell) and devaluation status (nondevalued vs devalued) as the factors. Only animals with at least four cells recorded in each region were included in this analysis for both the nondevalued (core: n = 12 rats, shell: n = 14 rats) and devalued condition (core: n = 14 rats, shell n = 14 rats). We also correlated the percentage phasic responsiveness for these animals and compared it to the devaluation indices for these animals. Further, differences in the proportion of neuronal responses to cue onset (nonphasic, excitation, inhibition) across the last day of training (i.e., before devaluation) and the 2 test days (devalued vs nondevalued) for both core and shell subregions were examined using a χ2 test using a 3 × 3 design (nonphasic, excitation, inhibition vs before devaluation, nondevalued, devalued). To determine whether there were differences in firing rates between nondevalued and devalued conditions in the NAc core, we examined the average neural firing rates for cells that were classified as excitations or inhibitions. Specifically, the average firing across all trials for each cell was grouped into 200 ms bins and then the average firing and SD were taken for each cell's 10 s baseline period. Each bin was then z-normalized by subtracting the average baseline firing rate from the firing rate in each 200 ms bin, divided by the SD as described previously (Sugam et al., 2014). We then examined the z-normalized neural firing rate during in the NAc core for cells that were classified as either excitations or inhibitions (see above) using a two-way repeated-measures ANOVA with time (200 ms bins spanning from −10 before cue onset through 10 s after cue onset) and devaluation status (before devaluation, nondevalued vs devalued) as the factors. To determine whether differences in neural signaling are observed across responding (press vs no press), we examined the strength of neural firing for trials in which rats pressed and compared it with trials in which they did not. Here, the average firing rate during cue presentation (within 2 s of cue onset) was compared with baseline (2 s before cue onset) using a two-way repeated-measures ANOVA with time period (baseline vs cue presentation) and devaluation status (nondevalued vs devalued) as factors for the trials in which the animals pressed. The same analysis was completed for the trials in which animals did not press. This specific analysis was done for core neurons only because there were not enough cells in the shell that responded to the cue in the devalued condition (n = 2 excitations and n = 3 inhibitions) to interpret the data. In the shell, the average firing rate during cue presentation (within 2 s of cue onset) was compared with baseline (2 s before cue onset) using a two-way repeated-measures ANOVA with time period (baseline vs cue presentation) and press status (press vs no press) as factors for cells that show excitations or inhibition in either test day (i.e., nondevalued or devalued). Further analysis examined the peak or trough (excitations and inhibitions, respectively) firing rate during cue presentation (within 2 s of cue onset) compared with baseline (2 s before cue onset) using a two-way repeated-measures ANOVA with time period (baseline vs cue presentation) and devaluation status (nondevalued vs devalued) as factors. Last, differences in the proportion of neuronal responses to the first lever press in the FR9 series (nonphasic, excitation, inhibition) across the two test days (devalued vs nondevalued) for both core and shell subregions were examined using a χ2 test in animals that responded on at least three trials on the test session. Therefore, we were able to do this analysis in 21 of 26 rats when the rats ate the same reinforcer before testing (devalued) an in 25 of 26 rats when rats ate the different reinforcer before testing (nondevalued). Statistical analyses of neural data were done using GraphPad Prism software.
Histology
Upon completion of the experiment, rats were deeply anesthetized with an intraperitoneal injection of a ketamine and xylazine mixture (100 and 10 mg/kg, respectively). A 13.5 μA current was passed through each microwire electrode for 5 s to mark the placement of electrode tips. Transcardial perfusions were then performed using physiological saline and 3% potassium ferricyanide in 10% formalin and brains were removed. After postfixing and freezing, 40 μm coronal brain sections were mounted. The addition of potassium ferricyanide allowed for a blue reaction corresponding to the location of the electrode tip, which was viewed under a 1× microscope lens. Placement of an electrode tip within the NAc core or shell was determined by examining the relative position of observable reaction product to visual landmarks and anatomical organization of the NAc in accordance with Paxinos and Watson (2005).
Results
Distribution of neuronal recordings in the NAc core and shell
A total of 484 cells were recorded in the NAc core or shell from 26 animals. Of 484 neurons, 159 cells were recorded during cue training (core = 80 and shell = 79), 160 cells were recorded on a test day after satiation of the same reinforcer earned during training (devalued; core = 85 and shell = 75), and 165 cells were recorded on a test day after the satiation of a different reinforcer (nondevalued; core = 79 and shell = 86). Figure 2 shows the histological distribution of electrode placements from which neurons were recorded in each NAc subregion.
Figure 2.

Histological verification of recording array wires in the NAc core and shell. Filled circles indicate electrode locations in the NAc core and open circles indicate electrode locations in the shell. The numbers represent distance in millimeters from bregma. Of the 26 rats used in this study, 8 were implanted with wires in the NAc core, 9 were implanted with wires in the NAc shell, and 9 were implanted in both (i.e., wires on each side).
Rats decrease responding in operant and consummatory tests after devaluation
After rats were trained to press a lever under an illuminated cue light for a distinct palatable reinforcer, they were fed either the same reinforcer received in training or a different reinforcer ad libitum before behavioral testing. To prevent rats from experiencing the current value of the food reinforcer in the presence of the cues, the test was conducted under extinction (i.e., no pellets were delivered during the test). Therefore, the now-devalued reinforcer was not experienced during testing and a behavioral suppression of responding represents successful integration of the previously learned associations with the altered (decreased) reinforcer value. During testing, as shown in Figure 3A, rats pressed significantly less (W = −162, p < 0.05) when they were sated on the same reinforcer earned during training (devalued, gray bar) than when they were sated on the different reinforcer (nondevalued, black bar). Importantly, the behavior across these groups did not differ as a function of distribution of neurons recorded across core and shell. Specifically, a two-way ANOVA with subregion (core, shell, or both) and devaluation status (nondevalued vs devalued) as factors revealed a significant difference in devaluation status (F(1,23) = 6.4, p < 0.05), but no difference across subregions (F(2,23) = 2.03) and no interaction (F(2,23) = 0.48). Furthermore, rats pressed on more trials in the nondevalued condition (10.7 ± 1.03) compared with the devalued condition (8.0 ± 0.97; W = −146 p < 0.05). In addition, the average latency to press was less in the nondevalued condition (5.71 ± 0.74) compared with devalued condition (7.89 ± 1.02; W = 154, p = 0.05) in 24 of 26 rats (2 rats did not press in the devalued condition).
Figure 3.

Behavioral responses after devaluation of a specific reinforcer in an operant test (A) and a consummatory test (B). A, Total number of lever presses rats that made under extinction after the consumption of either a different reinforcer (nondevalued, black bars) or the same reinforcer received during training (devalued, gray bars). *Significant difference (p < 0.05). B, Amount of food consumed of either a different reinforcer (nondevalued, black bars) or the same reinforcer (devalued, gray bars) that was previously eaten. **Significant difference (p < 0.01).
To ensure that rats in the testing paradigm were able to register the devaluation of a specific reinforcer (e.g., raspberry- or peanut-butter-flavored sucrose pellets), we conducted a consummatory test. Rats were given free access to one food, followed by ad libitum access to the same food (devalued) and another different food (nondevalued). As shown in Figure 3B, rats ate significantly less (W = −253, p < 0.05) of the same food that they had just eaten (devalued, gray bar) than the different food (nondevalued, black bar).
Neural encoding during training in the NAc core, but not shell, predicts behavioral flexibility as measured by devaluation
In order for rats to appropriately suppress responding to the cue after devaluation of a specific reinforcer, the appropriate cue–outcome association must be established during training. Therefore, we investigated whether neural encoding during the first recording session (i.e., the last day of training) correlated with behavioral performance on the subsequent test sessions (nondevalued vs devalued). To achieve this goal, we analyzed the percentage of neurons that showed phasic responsiveness to the cue for each individual animal and correlated the amount of NAc encoding with that animal's devaluation index (see above). Specifically, during recording session 1, distinct populations of neurons exhibited either an increase (Fig. 4A, top; excitation, termed Cueexc) or decrease (Fig. 3A, bottom; inhibition, termed Cueinh) in firing rates during cue presentation and thus were classified as “phasic” to the cue. Importantly, we showed that a positive correlation exists between the percentage of phasic cells (inhibitions and excitations) in the NAc core that encoded the cue and behavioral performance as measured by devaluation indices (R2 = 0.50, p < 0.01; Fig. 4B). That is, rats with more robust encoding of cues during training showed greater ability to stop responding when the same reinforcer was sated (devalued) although they continued to respond when the different reinforcer was sated (nondevalued). Therefore, the rats with the greater cue encoding during training were able to flexibly alter behavior more readily. Importantly, the percentage of neurons that show cue encoding in NAc core during training predicts individual differences in behavioral flexibility as measured by reinforcer devaluation. We performed the same analysis for NAc shell neurons and found no correlation between the percentage of phasic neurons during training and behavioral performance (R2 = 0.03, p = 0.6; Fig. 4C).
Figure 4.
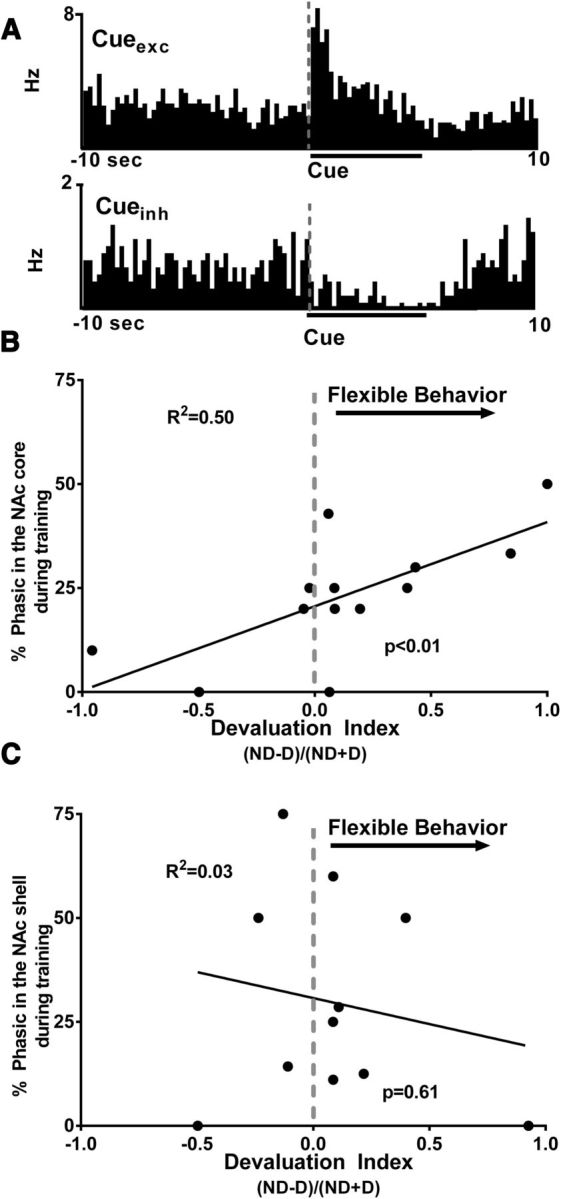
Percentage of neurons that show cue encoding in NAc core during training predicts individual differences in behavioral flexibility as measured by reinforcer devaluation. A, PEHs showing examples of individual NAc neurons that exhibited either an excitation (Cueexc, top) or inhibition (CUEinh, bottom) in cell firing relative to presentation of the cue light during the last day of training. B, Percentage of NAc core neurons that exhibited phasic activity during cue presentation on the last day of cue training plotted against each rat's devaluation index (ND − D)/(ND + D) calculated from the two devaluation test days (i.e., nondevalued test day, ND, and devalued test day, D), which measures behavioral flexibility. The x-axis is the devaluation index. A devaluation index of 1 indicates that all of the presses were under the nondevalued condition, 0 represents equal number of presses under the nondevalued and devalued conditions (gray dashed line), and −1 indicates all of the presses were under the devalued condition. The y-axis is the percentage of NAc core cells that showed significant phasic activity (both excitations and inhibitions) during cue presentation. There was a significant positive correlation between percentage core phasic neurons in each individual animal and their devaluation index. C, Percentage of phasic neurons that displayed phasic activity in the NAc shell plotted against individual devaluation indices. There was no correlation between the percentage of phasic neurons and the devaluation indices.
These data suggest that the extent to which neurons in the NAc core encode information about the cue during training predicts the ability of rats to use the previously learned cue–outcome associations to flexibly alter behavior after outcome devaluation during testing. Critically, whereas the NAc shell also encodes information about the cue, the amount of neural encoding that is processed in the shell during training does not predict behavioral performance during testing.
Decreased neural encoding in the NAc shell, but not core, after devaluation
Another goal of the present study was to determine whether neurons in NAc subregions (core and shell) differentially encode information about reward-associated cues after the reward is devalued. We found that there was a decrease in the percentage of phasic cells in the NAc shell, but not the core, when rats consumed the same reinforcer (devalued) before testing compared with the different (nondevalued) reinforcer. Specifically, during both devaluation test days (nondevalued vs devalued), distinct populations of neurons exhibited either an increase (Fig. 5A, top; excitation, termed Cueexc) or decrease (Fig. 5A, bottom; inhibition, termed Cueinh) in firing rates during cue presentation and thus were classified as “phasic” to the cue. We analyzed the percentage of phasically active cells (including both excitations and inhibitions) in each individual animal and examined how the mean percentage of phasic cells changed as a function of devaluation (nondevalued vs devalued) and subregion (core vs shell). There were no differences in the percentage of phasic neurons in the core in the nondevalued and devalued conditions (Fig. 5B, left). Interestingly, the mean percentage of phasic neurons in the NAc shell after satiation of the same reinforcer received during training (devalued) was significantly less compared with the percentage of phasic neurons after the satiation of a different (nondevalued) reinforcer (Fig. 5B, right). Specifically, a two-way ANOVA showed a trend toward a significant effect of region (core vs shell, F(1,50) = 3.3, p = 0.07), a significant effect of devaluation status (nondevalued vs devalued, F(1,50) = 8.8, p < 0.01), and a significant devaluation status by region interaction (F(1,50) = 7.7, p < 0.01). Post hoc (Tukey's multiple-comparison test) showed that the percentage of phasic neurons in the NAc shell in the devalued condition was significantly less than all other groups (i.e., shell-nondevalued (p < 0.001), core-nondevalued (p < 0.01), and core-devalued (p < 0.01), whereas no other groups were different from each other (all p > 0.1).
Figure 5.
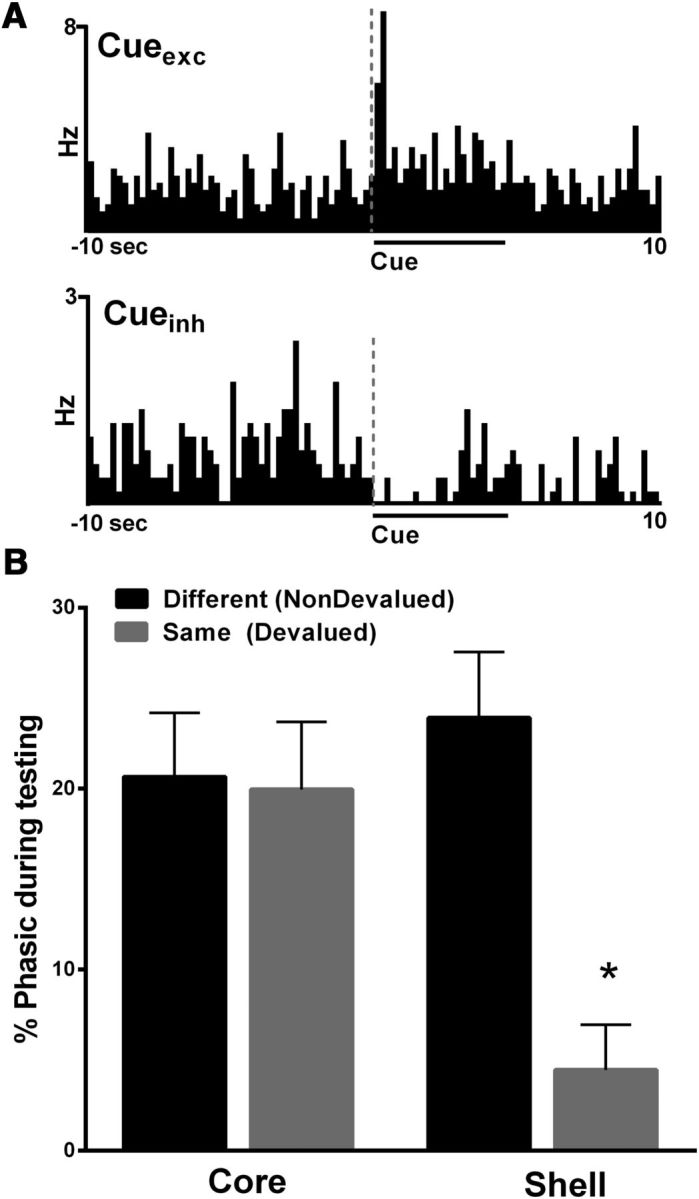
Encoding of cue-related information is significantly altered in the NAc shell, but not core, after reward devaluation. A, PEHs showing examples of individual NAc neurons that exhibited an excitation (Cueexc, top) or inhibition (CUEinh, bottom) in cell firing relative to presentation of the cue light during a test day. B, A significantly lower percentage of neurons in the NAc shell showed phasic responsiveness to the cue after satiation of the same reinforcer earned during training (devalued, gray bars), compared with that of a different reinforcer (nondevalued, black bars). There was no difference in the percentage of phasic neurons in the NAc core. **Significant difference from all other groups <0.05.
We also analyzed the percentage of neurons that showed phasic responsiveness to the cue for each individual animal during the devaluation test days (nondevalued and devalued) and correlated the amount of NAc encoding with that animal's devaluation index. No significant correlations were found between the percentage of phasic cells (inhibitions and excitations) in the NAc core that encoded the cue and behavioral performance as measured by devaluation indices on the nondevalued test day or the devalued test day (nondevalued: R2 = 0.12, p > 0.10; devalued: R2 = 0.05, p > 0.10). Likewise, no significant correlations were observed between the percentage of phasic cells in the shell that encoded the cue and devaluation indices on either test day (nondevalued: R2 = 0.04, p > 0.10; devalued: R2 = 0.19, p > 0.10).
Magnitude of firing rate in the NAc core does not differ as function of devaluation
The above findings show the neural encoding of reinforcer devaluation is specific to the shell. However, previous studies have shown enhanced firing rates in the NAc core when rats chose preferred options (Sugam et al., 2014). Therefore, even though the percentage of phasic neurons does not change in the NAc core after the reinforcer devaluation noted above, it is possible that this information is encoded in the magnitude profile of neural firing. That is, the percentage of cells that encode devaluation may not vary in the core, but the strength of each phasic response may differ across nondevalued or devalued conditions. To test this possibility, the magnitude of phasic neural encoding during cue presentation was analyzed when the rats received the same reinforcer (devalued) or different reinforcer (nondevalued) on the test day, as well as before devaluation (during training). Importantly, this was determined for both cue excitations (the peak of the neural response) and inhibitions (the trough of the neural response). For neurons showing an excitatory response profile (Fig. 6A), a two-way repeated-measures ANOVA revealed a significant main effect of time (F(99,2475) = 6.2, p < 0.0001), no significant main effect of devaluation status (F(2,25) = 0.72, p > 0.10). and no significant interaction (F(198,2475) = 0.71, p > 0.10). Further, we compared the greatest peak firing for each cell classified as excitation (within 2 s of cue onset) with baseline for the nondevalued and devalued conditions (Fig. 6B). A two-way repeated-measures ANOVA revealed a significant difference main effect of time (cue presentation and baseline; F(1,25) = 92.0, p < 0.0001), no difference between devaluation status (F(2,25) = 1.1, p > 0.10), and no interaction effect (F(2,25) = 1.2, p > 0.10).
Figure 6.
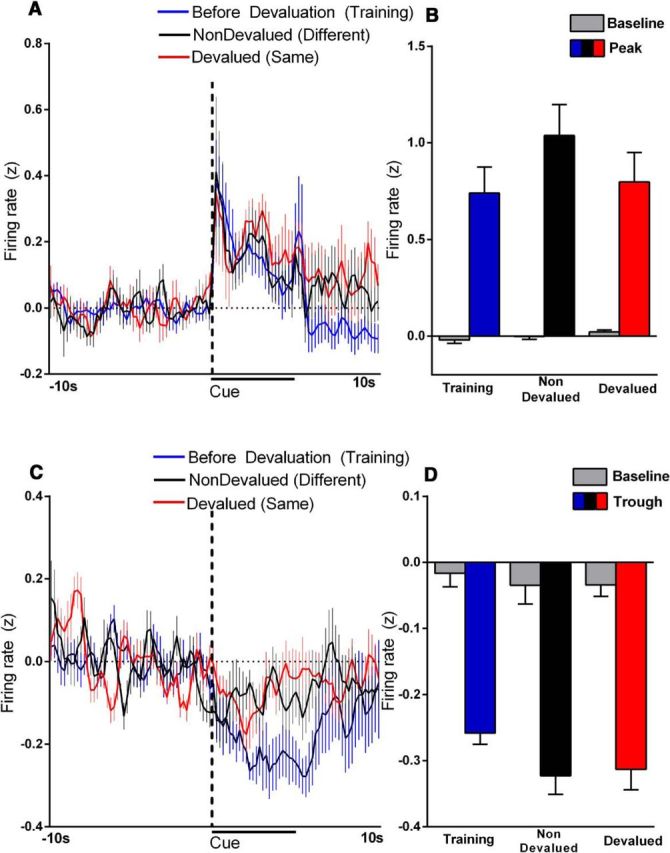
Average population firing for cells that show an excitation (A, B) or inhibition (C, D) after cue onset in the NAc core before devaluation (i.e., last day of training, blue), after satiation of the different reinforcer (i.e., nondevalued, black), or after satiation of the same reinforcer (i.e., devalued, red). Cue onset is indicated by “cue” on x-axis; duration before lever extension is indicated by the black line. For cells showing cue excitation, there were no differences in the average firing rate (A) or the peak firing across the three conditions (B; before devaluation, nondevalued, devalued). C, For cells that showed cue inhibition, there was a significant difference in the average firing rate before devaluation (i.e., the last day of training) compared with both devaluation test days (nondevalued and devalued). However, there was no difference between the devalued and nondevalued test days. D, There were no differences in firing troughs across the three conditions (before devaluation, nondevalued, devalued).
For inhibitory cells, a two-way repeated-measures ANOVA revealed a significant main effect of time (F(99,2277) = 4.5, p < 0.0001), no main effect of devaluation status (F(2,23) = 2.0, p > 0.10), but a significant interaction effect (F(198,2277) = 1.5, p < 0.0001). Post hoc analysis revealed that the before devaluation condition was significantly different from the nondevalued and devalued tests specifically 3 s past cue onset. We also compared the lowest trough firing (within 2 s of cue onset) with baseline for the before devaluation, nondevalued, and devalued conditions (Fig. 6D). A two-way repeated-measures ANOVA revealed a significant difference between cue presentation and baseline (F(1,23) = 125, p < 0.0001) but no difference between devaluation status (F(2,23) = 1.0, p > 0.10) and no interaction effect (F(2,23) = 0.3, p > 0.10). Note that the above analysis shown in Figure 6 was completed for neurons in the NAc core. The low number of neurons in the NAc shell that responded to the cue in the devalued condition (i.e., n = 2 excitations and n = 3 inhibitions) precluded the same analysis for this subregion.
Inhibitions, but not excitations, in the core and shell are sensitive to lever press responding during extinction
Here, we examined NAc core neurons that exhibited phasic firing to the cue on the nondevalued and devalued test days when the animals pressed the lever and when they did not. For neurons showing an excitatory response profile, a two-way repeated-measures ANOVA revealed a significant main effect of time whether the animals pressed the lever (F(1,13) = 10.2, p < 0.001) or did not (F(1,14) = 6.1, p < 0.05), no significant main effect of devaluation status (press: F(1,13) = 0.09, p > 0.10, no press: F(1,14) = 0.05, p > 0.10), and no significant interaction (press: F(1,13) = 0.50, p > 0.10, no press: F(1,14) = 0.003, p > 0.10). For neurons showing an inhibitory response profile, a two-way ANOVA revealed a main effect of time when the animals pressed (F(1,19) = 6.5, p < 0.05), but not when they did not (F(1,19) = 0.01, p > 0.10), and no main effect of devaluation status (press: F(1,19) = 0.44, p > 0.10, no press: F(1,19) = 0.94, p > 0.10) and no interaction effect (press: F(1,19) = 0.57, p > 0.10, no press: F(1,14) = 0.94, p > 0.10).
Finally, we also analyzed shell neural activity when the animals pressed versus when they did not. For cells classified as excitations, a two-way ANOVA revealed a main effect of time (F(1,9) = 19.72, p < 0.01), no main effect of press status (F(1,9) = 0.23, p > 0.10), and no interaction (F(1,9) = 0.11, p > 0.10). For cells that were classified as inhibitions, a two-way revealed no main effect of time (F(1,12) = 0.38, p > 0.10) or press status (F(1,12) = 0.66, p > 0.11), but there was an interaction effect (F(1,12) = 6.9, p < 0.05). Post hoc analysis (Tukey's test) revealed a significant difference between baseline and cue presentation when the animals pressed (t = 2.5, p < 0.05), but no difference between baseline and cue presentation when the animals did not (t = 1.03, p > 0.1). These data suggest that excitations in both the core and shell are not affected by whether the animal pressed under our behavioral conditions, whereas inhibitions in cell firing in the core and shell are both subject to changes based on whether the animal lever pressed.
Decreased neural encoding to the cue in the NAc shell consists of both inhibitions and excitations
Next, we determined the population profile of all phasic cells (excitations or inhibitions) that responded to the cue in the NAc core and shell before and after reinforcer devaluation. Here, we investigated whether the proportion of cells that were classified as Cueexc, Cueinh, or nonphasic for each subregion differed as function of devaluation status (before devaluation, nondevalued, and devalued). In the core, there were no differences in the proportion of cells that displayed phasic changes (excitations and inhibitions) to the cue on the last day of cue training [before devaluation, 12 excitations (15%) and 5 inhibitions (6.0%) of 80 total] or after rats were sated on the same reinforcer they earned during training [devalued, 9 excitations (12.5%) and 10 inhibitions (11.5%) of 79 total] or a different reinforcer [nondevalued, 7 excitations (8%) and 11 inhibitions (13%) of 85 total], as shown in Figure 7A (χ(4)2 = 3.871; p = 0.42). In contrast, the proportion of NAc shell cells that displayed phasic changes (excitations and inhibitions) during cue presentation was significantly decreased when rats were sated on the same reinforcer that they earned during training [devalued, 2 excitations (2.5%) and 3 inhibitions (3.5%) of 77 total] compared with a different reinforcer [nondevalued, 9 excitations (10.5%) and 13 inhibitions (15%) of 86 total] or the last day of training [before devaluation, 14 excitations (18%), and 9 inhibitions (11%) of 79 total], as shown in Figure 7B (χ(4)2 = 16.6, p < 0.01). These data show that the number of cells that respond to the cue (both inhibitions and excitations) after devaluation of that reward decreases in the shell, but not the core. Therefore, these results suggest that the NAc core does not encode the cue presentation differently when the value of the reward previously associated with that cue is decreased; that is, the neurons encode information about learned cue associations, but do not change as a function of devaluation. In contrast, NAc shell neurons dynamically encode information about the cue with regard to the altered outcome value after devaluation (i.e., the number of cells that respond to cue decreases when the outcome it predicts is devalued).
Figure 7.

Distribution of phasic (gray) and nonphasic (white) neurons across the population of recorded cells in the NAc core (A) and shell (B) during cue presentation before devaluation (i.e., the last day of training, left) or test days when either a different reinforcer (nondevalued, middle) or the same reinforcer (devalued, right) received during trained was given before testing. The area shaded dark gray represents neurons that showed an increase in firing (excitation) to the cue and the area shaded light gray represents the neurons that showed a decrease in firing to the cue (inhibition). Population responses show no difference in the number of phasic cells in the NAc core across devaluation test days (A). There was a significantly greater number of phasic neurons in NAc shell (gray) activated by the cue presentation in the before devaluation and nondevalued condition compared with the devalued condition (B). *p < 0.05.
Reinforcer devaluation does not affect neural activity at the time of the response
Next, we determined the population profile of all phasic cells (excitations or inhibitions) in the NAc core and shell that responded to the first lever press across trials in which the animal pressed in both the nondevalued and devalued condition (Table 1). Specifically, we investigated whether the proportion of cells that were classified as an excitation, inhibition, or nonphasic for each NAc subregion differed as function of devaluation status. In the NAc core and shell, there were no differences in the proportion of cells that displayed phasic changes (excitations and inhibitions) to the lever press whether rats were sated on the same reinforcer they earned during training or a different reinforcer (core: χ(2)2 = 1.8, p = 0.4; shell: χ(2)2 = 1.3, p = 0.94).
Table 1.
Number and percentage of cells exhibiting an excitation (EXC) or inhibition (INH) to the first lever press after devaluation in the NAc core versus the NAc shell
| EXC | INH | NP | |
|---|---|---|---|
| NAc core | |||
| Nondevalued (81 cells) | 8 (10%) | 5 (6%) | 70 (86%) |
| Devalued (85 cells) | 9 (10.5%) | 10 (12%) | 66 (77.5%) |
| NAc shell | |||
| Nondevalued (80 cells) | 8 (10%) | 4 (5%) | 68 (85%) |
| Devalued (63 cells) | 6 (9.5%) | 4 (6%) | 53 (84%) |
NP, Nonphasic.
We also analyzed the percentage of neurons that showed phasic responsiveness to the first press for each individual animal during the devaluation test days (nondevalued and devalued) and correlated the amount of NAc encoding with the latency to respond for each animal. No significant correlation was observed between the percentage of phasic cells (inhibitions and excitations) in the NAc core that encoded the press on the nondevalued or devalued test day and latency to press on that day (nondevalued: R2 = 3.9 × 10⁻⁵, p > 0.10; devalued: R2 = 0.04, p > 0.10). Likewise, no significant correlations were observed between the percentage of phasic cells in the shell that encoded the press on either test day (nondevalued or devalued) and latency to press (nondevalued: R2 = 0.06, p > 0.10; devalued: R2 = 0.004, p > 0.10). These results suggest that the NAc core and the shell do not encode the lever press differently when the value of the reward previously associated with that press is decreased.
Discussion
Here, we present evidence that NAc subregions differentially encode value-based information. In the NAc core, the degree to which cells encoded reward-associated cues during training reliably predicted the ability of rats to suppress responding for devalued outcomes. However, multiple measures (i.e., proportion of cells, firing magnitude or encoding valence) indicated that core neurons exhibited no shifts in cue encoding after satiation of the reinforcer earned during training (devalued) versus a different reinforcer (nondevalued). In contrast, whereas cue-encoding NAc shell neurons exhibited no relationship between neural encoding during training and subsequent devaluation, devaluation significantly reduced the proportion of cue-encoding cells after selective satiation of the same reinforcer (devalued) compared with the nondevalued condition. Interestingly, this effect was specific to cue encoding because there was no difference in phasic activity between the devalued and nondevalued conditions during the response epoch.
Both the NAc core and shell have been implicated in value-based, associative processing (Saddoris et al., 2013). NAc core neurons show robust encoding to predictive cues paired with sucrose rewards (Setlow et al., 2003; Jones et al., 2010; Saddoris et al., 2011; Saddoris and Carelli, 2014) or drug rewards such as cocaine (Hollander and Carelli, 2007). Further, the NAc core is necessary for Pavlovian approach responses (Parkinson et al., 2002; Saunders and Robinson, 2012), with greater NAc core encoding when rats perform a flexible response task than an inflexible task (McGinty et al., 2013). One possible explanation is that the animals that have formed the strongest cue–outcome association during training are able use those associations to allow for better performance. Alternatively, the rats with fewer cue-responsive neurons may have shifted cell firing to circuits that control habitual behavior (e.g., dorsal lateral striatum; Yin et al., 2004; Gremel and Costa, 2013; Smith and Graybiel, 2013) and those animals are less sensitive to devaluation. Here, we found that the degree of encoding to reward-associated cues in the NAc core (but not shell) predicts the ability of animals to flexibly guide behavior. Whatever the process, the degree to which NAc core encodes reward-associated cues during training may be functionally linked to the animals' ability to suppress responding for devalued outcomes.
Although we found that NAc core encoding during training predicted performance, no relationship was observed when the outcome value was decreased during testing. In apparent contradiction, it has been reported previously that NAc core activity shifts when cue–outcome associations are changed within a reversal test session (Setlow et al., 2003) and dopamine in the core rapidly updates during delay discounting (Saddoris et al., 2015b). Furthermore, when rats choose between differently valued rewards, NAc neurons encode relative outcome values and subsequent behavioral responses (Roesch et al., 2009; Day et al., 2011; Sugam et al., 2014). However, these studies were performed while rats were learning new cue–outcome associations or after the cue–outcome associations had already been established. In contrast, we recorded neuronal firing to a cue linked to a reward that was devalued outside of the testing session. Therefore, we showed that NAc core firing to the cue does not change with regard to decreased expected outcome value.
These findings are consistent with recent work showing that the NAc core encodes information across different aspects of choice behavior (proximity to lever, reward magnitude, and effort), but rarely encoded integration of expected outcome value (Morrison and Nicola, 2014), as would be necessary in our task. Importantly, we also found that the magnitude of firing for excitations was similar across all three conditions (before devaluation, nondevalued, devalued). In contrast, inhibitions during training are more sustained than in the nondevalued and devalued conditions. This finding is not surprising because animals received the reward in only the training condition and decreased NAc activity is important for initiating consummatory and appetitive behavior (Taha and Fields, 2006; Krause et al., 2010). Collectively, these data indicate that NAc core neuronal activity is not sensitive to devaluation and suggest that NAc neurons respond to, rather than update, previously established cue–outcome associations.
Although the core has been shown to be involved in associative learning, the NAc shell has been implicated in hedonic value computations. For example, glutamate antagonists microinfused directly into the shell enhanced appetitive behavior in rats (Maldonado-Irizarry et al., 1995; Kelley and Swanson, 1997). Further, dopamine in the shell differentially responds to appetitive and aversive tastes (Roitman et al., 2008; Wheeler et al., 2008) and NAc shell inactivation disrupts the ability of rats to judge reward magnitude options (Stopper and Floresco, 2011).
Recent studies suggest that the NAc shell is also involved in complex motivational behavior. For example, we showed previously that encoding in the shell was strongly linked to motivationally potentiated behavior using a Pavlovian-to-instrumental transfer task (Saddoris et al., 2011). Further, the shell (but not core) is necessary for outcome-specific enhancement of goal-directed behavior by Pavlovian cues, suggesting that the shell may be processing information about specific outcomes (Corbit and Balleine, 2011). In addition, our current findings suggest that the shell updates value information about cues to guide instrumental responding after devaluation. This complements previous findings in which c-fos activity was increased in the NAc shell (but not core) to the reward predictive cue after outcome devaluation (Kerfoot et al., 2007). Together, these findings suggest that the NAc shell (but not core) dynamically encodes outcome-selective information about predictive cues based on the current value of that reward relative to the animal's motivational state (Saddoris et al., 2015a).
The NAc does not function in isolation, but is embedded in a larger neural circuit that guides behavioral flexibility. One element of this network is the basolateral amygdala (BLA), which sends projections to the NAc core and shell (Zorrilla and Koob, 2013) and is critical for reinforcer devaluation (Pickens et al., 2003). Interestingly, the BLA is not necessary for devaluation after learning (i.e., forming cue–outcome associations; Pickens et al., 2003). Here, NAc core (but not shell) encoding during training (forming cue–outcome associations) predicts behavioral performance. It follows that the BLA-NAc core pathway is likely involved in forming cue–outcome associations (during training). To support this, the BLA is necessary for the cue-evoked NAc core (but not shell) neuronal activity (Ambroggi et al., 2008; Jones et al., 2010) and the functional connection between BLA and NAc core during training is necessary for flexible behavior after reinforcer devaluation (Shiflett and Balleine, 2010).
The prelimbic cortex (PL) is another possible NAc afferent that sends preferential projections to the core (Heidbreder and Groenewegen, 2003) and could process cue–outcome information. Although PL lesions before training disrupt performance in reinforcer devaluation tasks, the PL is not necessary for the expression of the devaluation effect (Ostlund and Balleine, 2005; Tran-Tu-Yen et al., 2009). Therefore, the ability of rats to learn cue–outcome associations (encoded in the NAc core) allows animals to use this information to guide behavior when outcome values change and the core could receive this information from the PL, the BLA, or both.
In contrast, we show that NAc shell encoding reflects the current devaluation of the reward. Therefore, the shell most likely receives information about the updated outcome value to adjust encoding to the reward predictive cue. The neural substrate necessary for the expression of behavioral flexibility during testing is the orbitofrontal cortex (OFC) (Pickens et al., 2005; West et al., 2011a; Gremel and Costa, 2013; West et al., 2013). Interestingly, the rat OFC (ventral lateral and lateral subregions) does not send direct projections to the medial shell (Schilman et al., 2008) and instead may send information regarding the updated motivational state during behavioral performance, perhaps through the ventral tegmental area (Swanson, 1982; Takahashi et al., 2011). Another possibility is that the shell receives satiety signals (e.g., from the lateral hypothalamus; LH). The LH sends dense projections to the shell (but not core) and is necessary for the enhancement of appetitive behavior after glutamate blockade in the shell (Maldonado-Irizarry et al., 1995; Kelley, 2004). Further, LH neurons encode sensory-specific satiety (Rolls et al., 1986). Therefore, it is possible that the shell uses outcome-specific satiety signals from the LH to alter cue encoding to reflect the updated motivational value.
Finally, it is important to note that the core sends dense projections to the shell, but the shell only sends sparse projections to the core (van Dongen et al., 2005). Therefore, the NAc core may provide the appropriate information about the learned cue–outcome associations to the shell, which also has access to the expected outcome value (i.e., decreased value) through connections with other brain circuits (e.g., OFC, LH). Then, the shell integrates this parallel information to update cue-encoding to reflect the updated outcome value. Interestingly, the shell has also been implicated in gating behavior (Ambroggi et al., 2011). Therefore, the shell may act toward the suppression of responding in the devalued condition upon integrating value information. Regardless of the larger neural network in which it is embedded, the current findings indicate complimentary, yet distinct, roles of the NAc core and shell neural encoding when animals flexibly change cue-guided motivated behavior after an alteration in outcome value.
Footnotes
This work was supported by National Institute on Drug Abuse (Grant DA037733 to E.A.W. and Grant DA034021 to R.M.C.). We thank Elina Thomas and Fei Fei Wang for technical assistance and Michael Saddoris, Travis Moschak, and Seth Hurley for reviewing early drafts of this manuscript.
The authors declare no competing financial interests.
References
- Ambroggi F, Ishikawa A, Fields HL, Nicola SM. Basolateral amygdala neurons facilitate reward-seeking behavior by exciting nucleus accumbens neurons. Neuron. 2008;59:648–661. doi: 10.1016/j.neuron.2008.07.004. [DOI] [PMC free article] [PubMed] [Google Scholar]
- Ambroggi F, Ghazizadeh A, Nicola SM, Fields HL. Roles of nucleus accumbens core and shell in incentive-cue responding and behavioral inhibition. J Neurosci. 2011;31:6820–6830. doi: 10.1523/JNEUROSCI.6491-10.2011. [DOI] [PMC free article] [PubMed] [Google Scholar]
- Cacciapaglia F, Wightman RM, Carelli RM. Rapid dopamine signaling differentially modulates distinct microcircuits within the nucleus accumbens during sucrose-directed behavior. J Neurosci. 2011;31:13860–13869. doi: 10.1523/JNEUROSCI.1340-11.2011. [DOI] [PMC free article] [PubMed] [Google Scholar]
- Carelli RM. Activation of accumbens cell firing by stimuli associated with cocaine delivery during self-administration. Synapse. 2000;35:238–242. doi: 10.1002/(SICI)1098-2396(20000301)35:3%3C238::AID-SYN10%3E3.0.CO;2-Y. [DOI] [PubMed] [Google Scholar]
- Carelli RM. Nucleus accumbens cell firing and rapid dopamine signaling during goal-directed behaviors in rats. Neuropharmacology. 2004;47:180–189. doi: 10.1016/j.neuropharm.2004.07.017. [DOI] [PubMed] [Google Scholar]
- Carelli RM, Ijames SG. Nucleus accumbens cell firing during maintenance, extinction, and reinstatement of cocaine self-administration behavior in rats. Brain Res. 2000;866:44–54. doi: 10.1016/S0006-8993(00)02217-4. [DOI] [PubMed] [Google Scholar]
- Carelli RM, Ijames SG. Selective activation of accumbens neurons by cocaine-associated stimuli during a water/cocaine multiple schedule. Brain Res. 2001;907:156–161. doi: 10.1016/S0006-8993(01)02604-X. [DOI] [PubMed] [Google Scholar]
- Castro DC, Cole SL, Berridge KC. Lateral hypothalamus, nucleus accumbens, and ventral pallidum roles in eating and hunger: interactions between homeostatic and reward circuitry. Front Syst Neurosci. 2015;9:90. doi: 10.3389/fnsys.2015.00090. [DOI] [PMC free article] [PubMed] [Google Scholar]
- Corbit LH, Balleine BW. The general and outcome-specific forms of Pavlovian-instrumental transfer are differentially mediated by the nucleus accumbens core and shell. J Neurosci. 2011;31:11786–11794. doi: 10.1523/JNEUROSCI.2711-11.2011. [DOI] [PMC free article] [PubMed] [Google Scholar]
- Corbit LH, Muir JL, Balleine BW. The role of the nucleus accumbens in instrumental conditioning: Evidence of a functional dissociation between accumbens core and shell. J Neurosci. 2001;21:3251–3260. doi: 10.1523/JNEUROSCI.21-09-03251.2001. [DOI] [PMC free article] [PubMed] [Google Scholar]
- Day JJ, Carelli RM. The nucleus accumbens and Pavlovian reward learning. Neuroscientist. 2007;13:148–159. doi: 10.1177/1073858406295854. [DOI] [PMC free article] [PubMed] [Google Scholar]
- Day JJ, Wheeler RA, Roitman MF, Carelli RM. Nucleus accumbens neurons encode Pavlovian approach behaviors: evidence from an autoshaping paradigm. Eur J Neurosci. 2006;23:1341–1351. doi: 10.1111/j.1460-9568.2006.04654.x. [DOI] [PubMed] [Google Scholar]
- Day JJ, Roitman MF, Wightman RM, Carelli RM. Associative learning mediates dynamic shifts in dopamine signaling in the nucleus accumbens. Nat Neurosci. 2007;10:1020–1028. doi: 10.1038/nn1923. [DOI] [PubMed] [Google Scholar]
- Day JJ, Jones JL, Carelli RM. Nucleus accumbens neurons encode predicted and ongoing reward costs in rats. Eur J Neurosci. 2011;33:308–321. doi: 10.1111/j.1460-9568.2010.07531.x. [DOI] [PMC free article] [PubMed] [Google Scholar]
- Gremel CM, Costa RM. Orbitofrontal and striatal circuits dynamically encode the shift between goal-directed and habitual actions. Nat Commun. 2013;4:2264. doi: 10.1038/ncomms3264. [DOI] [PMC free article] [PubMed] [Google Scholar]
- Heidbreder CA, Groenewegen HJ. The medial prefrontal cortex in the rat: evidence for a dorso-ventral distinction based upon functional and anatomical characteristics. Neurosci Biobehav Rev. 2003;27:555–579. doi: 10.1016/j.neubiorev.2003.09.003. [DOI] [PubMed] [Google Scholar]
- Hollander JA, Carelli RM. Cocaine-associated stimuli increase cocaine seeking and activate accumbens core neurons after abstinence. J Neurosci. 2007;27:3535–3539. doi: 10.1523/JNEUROSCI.3667-06.2007. [DOI] [PMC free article] [PubMed] [Google Scholar]
- Hollander JA, Ijames SG, Roop RG, Carelli RM. An examination of nucleus accumbens cell firing during extinction and reinstatement of water reinforcement behavior in rats. Brain Res. 2002;929:226–235. doi: 10.1016/S0006-8993(01)03396-0. [DOI] [PubMed] [Google Scholar]
- Jones JL, Day JJ, Wheeler RA, Carelli RM. The basolateral amygdala differentially regulates conditioned neural responses within the nucleus accumbens core and shell. Neuroscience. 2010;169:1186–1198. doi: 10.1016/j.neuroscience.2010.05.073. [DOI] [PMC free article] [PubMed] [Google Scholar]
- Kelley AE. Ventral striatal control of appetitive motivation: role in ingestive behavior and reward-related learning. Neurosci Biobehav Rev. 2004;27:765–776. doi: 10.1016/j.neubiorev.2003.11.015. [DOI] [PubMed] [Google Scholar]
- Kelley AE, Swanson CJ. Feeding induced by blockade of AMPA and kainate receptors within the ventral striatum: a microinfusion mapping study. Behav Brain Res. 1997;89:107–113. doi: 10.1016/S0166-4328(97)00054-5. [DOI] [PubMed] [Google Scholar]
- Kerfoot EC, Agarwal I, Lee HJ, Holland PC. Control of appetitive and aversive taste-reactivity responses by an auditory conditioned stimulus in a devaluation task: a FOS and behavioral analysis. Learn Mem. 2007;14:581–589. doi: 10.1101/lm.627007. [DOI] [PMC free article] [PubMed] [Google Scholar]
- Krause M, German PW, Taha SA, Fields HL. A pause in nucleus accumbens neuron firing is required to initiate and maintain feeding. J Neurosci. 2010;30:4746–4756. doi: 10.1523/JNEUROSCI.0197-10.2010. [DOI] [PMC free article] [PubMed] [Google Scholar]
- Lex B, Hauber W. The role of nucleus accumbens dopamine in outcome encoding in instrumental and Pavlovian conditioning. Neurobiol Learn Mem. 2010;93:283–290. doi: 10.1016/j.nlm.2009.11.002. [DOI] [PubMed] [Google Scholar]
- Lubman DI, Yücel M, Pantelis C. Addiction, a condition of compulsive behaviour? Neuroimaging and neuropsychological evidence of inhibitory dysregulation. Addiction. 2004;99:1491–1502. doi: 10.1111/j.1360-0443.2004.00808.x. [DOI] [PubMed] [Google Scholar]
- Lucantonio F, Stalnaker TA, Shaham Y, Niv Y, Schoenbaum G. The impact of orbitofrontal dysfunction on cocaine addiction. Nat Neurosci. 2012;15:358–366. doi: 10.1038/nn.3014. [DOI] [PMC free article] [PubMed] [Google Scholar]
- Lucantonio F, Caprioli D, Schoenbaum G. Transition from ‘model-based’ to ‘model-free’ behavioral control in addiction: Involvement of the orbitofrontal cortex and dorsolateral striatum. Neuropharmacology. 2014;76:407–415. doi: 10.1016/j.neuropharm.2013.05.033. [DOI] [PMC free article] [PubMed] [Google Scholar]
- Maldonado-Irizarry CS, Swanson CJ, Kelley AE. Glutamate receptors in the nucleus accumbens shell control feeding behavior via the lateral hypothalamus. J Neurosci. 1995;15:6779–6788. doi: 10.1523/JNEUROSCI.15-10-06779.1995. [DOI] [PMC free article] [PubMed] [Google Scholar]
- McDannald MA, Jones JL, Takahashi YK, Schoenbaum G. Learning theory: a driving force in understanding orbitofrontal function. Neurobiol Learn Mem. 2014;108:22–27. doi: 10.1016/j.nlm.2013.06.003. [DOI] [PMC free article] [PubMed] [Google Scholar]
- McGinty VB, Lardeux S, Taha SA, Kim JJ, Nicola SM. Invigoration of reward seeking by cue and proximity encoding in the nucleus accumbens. Neuron. 2013;78:910–922. doi: 10.1016/j.neuron.2013.04.010. [DOI] [PMC free article] [PubMed] [Google Scholar]
- Mogenson GJ, Jones DL, Yim CY. From motivation to action: functional interface between the limbic system and the motor system. Prog Neurobiol. 1980;14:69–97. doi: 10.1016/0301-0082(80)90018-0. [DOI] [PubMed] [Google Scholar]
- Morrison SE, Nicola SM. Neurons in the nucleus accumbens promote selection bias for nearer objects. J Neurosci. 2014;34:14147–14162. doi: 10.1523/JNEUROSCI.2197-14.2014. [DOI] [PMC free article] [PubMed] [Google Scholar]
- Murray EA, Izquierdo A. Orbitofrontal cortex and amygdala contributions to affect and action in primates. Ann N Y Acad Sci. 2007;1121:273–296. doi: 10.1196/annals.1401.021. [DOI] [PubMed] [Google Scholar]
- Murray EA, O'Doherty JP, Schoenbaum G. What we know and do not know about the functions of the orbitofrontal cortex after 20 years of cross-species studies. J Neurosci. 2007;27:8166–8169. doi: 10.1523/JNEUROSCI.1556-07.2007. [DOI] [PMC free article] [PubMed] [Google Scholar]
- Ostlund SB, Balleine BW. Lesions of medial prefrontal cortex disrupt the acquisition but not the expression of goal-directed learning. J Neurosci. 2005;25:7763–7770. doi: 10.1523/JNEUROSCI.1921-05.2005. [DOI] [PMC free article] [PubMed] [Google Scholar]
- Parkinson JA, Dalley JW, Cardinal RN, Bamford A, Fehnert B, Lachenal G, Rudarakanchana N, Halkerston KM, Robbins TW, Everitt BJ. Nucleus accumbens dopamine depletion impairs both acquisition and performance of appetitive Pavlovian approach behaviour: implications for mesoaccumbens dopamine function. Behav Brain Res. 2002;137:149–163. doi: 10.1016/S0166-4328(02)00291-7. [DOI] [PubMed] [Google Scholar]
- Paxinos G, Watson C. The rat brain in stereotaxic coordinates. 5th ed. New York: Elsevier; 2005. [DOI] [PubMed] [Google Scholar]
- Pickens CL, Saddoris MP, Setlow B, Gallagher M, Holland PC, Schoenbaum G. Different roles for orbitofrontal cortex and basolateral amygdala in a reinforcer devaluation task. J Neurosci. 2003;23:11078–11084. doi: 10.1523/JNEUROSCI.23-35-11078.2003. [DOI] [PMC free article] [PubMed] [Google Scholar]
- Pickens CL, Saddoris MP, Gallagher M, Holland PC. Orbitofrontal lesions impair use of cue–outcome associations in a devaluation task. Behav Neurosci. 2005;119:317–322. doi: 10.1037/0735-7044.119.1.317. [DOI] [PMC free article] [PubMed] [Google Scholar]
- Roesch MR, Singh T, Brown PL, Mullins SE, Schoenbaum G. Ventral striatal neurons encode the value of the chosen action in rats deciding between differently delayed or sized rewards. J Neurosci. 2009;29:13365–13376. doi: 10.1523/JNEUROSCI.2572-09.2009. [DOI] [PMC free article] [PubMed] [Google Scholar]
- Roitman MF, Wheeler RA, Wightman RM, Carelli RM. Real-time chemical responses in the nucleus accumbens differentiate rewarding and aversive stimuli. Nat Neurosci. 2008;11:1376–1377. doi: 10.1038/nn.2219. [DOI] [PMC free article] [PubMed] [Google Scholar]
- Roitman MF, Wheeler RA, Tiesinga PH, Roitman JD, Carelli RM. Hedonic and nucleus accumbens neural responses to a natural reward are regulated by aversive conditioning. Learn Mem. 2010;17:539–546. doi: 10.1101/lm.1869710. [DOI] [PMC free article] [PubMed] [Google Scholar]
- Rolls ET, Murzi E, Yaxley S, Thorpe SJ, Simpson SJ. Sensory-specific satiety: food-specific reduction in responsiveness of ventral forebrain neurons after feeding in the monkey. Brain Res. 1986;368:79–86. doi: 10.1016/0006-8993(86)91044-9. [DOI] [PubMed] [Google Scholar]
- Saddoris MP, Carelli RM. Cocaine self-administration abolishes associative neural encoding in the nucleus accumbens necessary for higher-order learning. Biol Psychiatry. 2014;75:156–164. doi: 10.1016/j.biopsych.2013.07.037. [DOI] [PMC free article] [PubMed] [Google Scholar]
- Saddoris MP, Stamatakis A, Carelli RM. Neural correlates of Pavlovian-to-instrumental transfer in the nucleus accumbens shell are selectively potentiated following cocaine self-administration. Eur J Neurosci. 2011;33:2274–2287. doi: 10.1111/j.1460-9568.2011.07683.x. [DOI] [PMC free article] [PubMed] [Google Scholar]
- Saddoris MP, Sugam JA, Cacciapaglia F, Carelli RM. Rapid dopamine dynamics in the accumbens core and shell: learning and action. Front Biosci (Elite Ed) 2013;5:273–288. doi: 10.2741/e615. [DOI] [PMC free article] [PubMed] [Google Scholar]
- Saddoris MP, Cacciapaglia F, Wightman RM, Carelli RM. Differential dopamine release dynamics in the nucleus accumbens core and shell reveal complementary signals for error prediction and incentive motivation. J Neurosci. 2015a;35:11572–11582. doi: 10.1523/JNEUROSCI.2344-15.2015. [DOI] [PMC free article] [PubMed] [Google Scholar]
- Saddoris MP, Sugam JA, Stuber GD, Witten IB, Deisseroth K, Carelli RM. Mesolimbic dopamine dynamically tracks, and is causally linked to, discrete aspects of value-based decision making. Biol Psychiatry. 2015b;77:903–911. doi: 10.1016/j.biopsych.2014.10.024. [DOI] [PMC free article] [PubMed] [Google Scholar]
- Saunders BT, Robinson TE. The role of dopamine in the accumbens core in the expression of Pavlovian-conditioned responses. Eur J Neurosci. 2012;36:2521–2532. doi: 10.1111/j.1460-9568.2012.08217.x. [DOI] [PMC free article] [PubMed] [Google Scholar]
- Schilman EA, Uylings HB, Galis-de Graaf Y, Joel D, Groenewegen HJ. The orbital cortex in rats topographically projects to central parts of the caudate-putamen complex. Neurosci Lett. 2008;432:40–45. doi: 10.1016/j.neulet.2007.12.024. [DOI] [PubMed] [Google Scholar]
- Setlow B, Schoenbaum G, Gallagher M. Neural encoding in ventral striatum during olfactory discrimination learning. Neuron. 2003;38:625–636. doi: 10.1016/S0896-6273(03)00264-2. [DOI] [PubMed] [Google Scholar]
- Shiflett MW, Balleine BW. At the limbic-motor interface: disconnection of basolateral amygdala from nucleus accumbens core and shell reveals dissociable components of incentive motivation. Eur J Neurosci. 2010;32:1735–1743. doi: 10.1111/j.1460-9568.2010.07439.x. [DOI] [PMC free article] [PubMed] [Google Scholar]
- Singh T, McDannald MA, Haney RZ, Cerri DH, Schoenbaum G. Nucleus accumbens core and shell are necessary for reinforcer devaluation effects on Pavlovian conditioned responding. Front Integr Neurosci. 2010;4:126. doi: 10.3389/fnint.2010.00126. [DOI] [PMC free article] [PubMed] [Google Scholar]
- Smith KS, Graybiel AM. A dual operator view of habitual behavior reflecting cortical and striatal dynamics. Neuron. 2013;79:361–374. doi: 10.1016/j.neuron.2013.05.038. [DOI] [PMC free article] [PubMed] [Google Scholar]
- Stopper CM, Floresco SB. Contributions of the nucleus accumbens and its subregions to different aspects of risk-based decision making. Cogn Affect Behav Neurosci. 2011;11:97–112. doi: 10.3758/s13415-010-0015-9. [DOI] [PubMed] [Google Scholar]
- Sugam JA, Saddoris MP, Carelli RM. Nucleus accumbens neurons track behavioral preferences and reward outcomes during risky decision making. Biol Psychiatry. 2014;75:807–816. doi: 10.1016/j.biopsych.2013.09.010. [DOI] [PMC free article] [PubMed] [Google Scholar]
- Swanson LW. The projections of the ventral tegmental area and adjacent regions: a combined fluorescent retrograde tracer and immunofluorescence study in the rat. Brain Res Bull. 1982;9:321–353. doi: 10.1016/0361-9230(82)90145-9. [DOI] [PubMed] [Google Scholar]
- Taha SA, Fields HL. Inhibitions of nucleus accumbens neurons encode a gating signal for reward-directed behavior. J Neurosci. 2006;26:217–222. doi: 10.1523/JNEUROSCI.3227-05.2006. [DOI] [PMC free article] [PubMed] [Google Scholar]
- Takahashi YK, Roesch MR, Wilson RC, Toreson K, O'Donnell P, Niv Y, Schoenbaum G. Expectancy-related changes in firing of dopamine neurons depend on orbitofrontal cortex. Nat Neurosci. 2011;14:1590–1597. doi: 10.1038/nn.2957. [DOI] [PMC free article] [PubMed] [Google Scholar]
- Tran-Tu-Yen DA, Marchand AR, Pape JR, Di Scala G, Coutureau E. Transient role of the rat prelimbic cortex in goal-directed behaviour. Eur J Neurosci. 2009;30:464–471. doi: 10.1111/j.1460-9568.2009.06834.x. [DOI] [PubMed] [Google Scholar]
- van Dongen YC, Deniau JM, Pennartz CM, Galis-de Graaf Y, Voorn P, Thierry AM, Groenewegen HJ. Anatomical evidence for direct connections between the shell and core subregions of the rat nucleus accumbens. Neuroscience. 2005;136:1049–1071. doi: 10.1016/j.neuroscience.2005.08.050. [DOI] [PubMed] [Google Scholar]
- West EA, DesJardin JT, Gale K, Malkova L. Transient inactivation of orbitofrontal cortex blocks reinforcer devaluation in macaques. J Neurosci. 2011a;31:15128–15135. doi: 10.1523/JNEUROSCI.3295-11.2011. [DOI] [PMC free article] [PubMed] [Google Scholar]
- West EA, Forcelli PA, Murnen A, Gale K, Malkova L. A visual, position-independent instrumental reinforcer devaluation task for rats. J Neurosci Methods. 2011b;194:297–304. doi: 10.1016/j.jneumeth.2010.11.004. [DOI] [PMC free article] [PubMed] [Google Scholar]
- West EA, Forcelli PA, Murnen AT, McCue DL, Gale K, Malkova L. Transient inactivation of basolateral amygdala during selective satiation disrupts reinforcer devaluation in rats. Behav Neurosci. 2012;126:563–574. doi: 10.1037/a0029080. [DOI] [PMC free article] [PubMed] [Google Scholar]
- West EA, Forcelli PA, McCue DL, Malkova L. Differential effects of serotonin-specific and excitotoxic lesions of OFC on conditioned reinforcer devaluation and extinction in rats. Behav Brain Res. 2013;246:10–14. doi: 10.1016/j.bbr.2013.02.027. [DOI] [PMC free article] [PubMed] [Google Scholar]
- West EA, Saddoris MP, Kerfoot EC, Carelli RM. Prelimbic and infralimbic cortical regions differentially encode cocaine-associated stimuli and cocaine-seeking before and following abstinence. Eur J Neurosci. 2014;39:1891–1902. doi: 10.1111/ejn.12578. [DOI] [PMC free article] [PubMed] [Google Scholar]
- Wheeler RA, Twining RC, Jones JL, Slater JM, Grigson PS, Carelli RM. Behavioral and electrophysiological indices of negative affect predict cocaine self-administration. Neuron. 2008;57:774–785. doi: 10.1016/j.neuron.2008.01.024. [DOI] [PubMed] [Google Scholar]
- Yin HH, Knowlton BJ, Balleine BW. Lesions of dorsolateral striatum preserve outcome expectancy but disrupt habit formation in instrumental learning. Eur J Neurosci. 2004;19:181–189. doi: 10.1111/j.1460-9568.2004.03095.x. [DOI] [PubMed] [Google Scholar]
- Zorrilla EP, Koob GF. Amygdalostriatal projections in the neurocircuitry for motivation: a neuroanatomical thread through the career of Ann Kelley. Neurosci Biobehav Rev. 2013;37:1932–1945. doi: 10.1016/j.neubiorev.2012.11.019. [DOI] [PMC free article] [PubMed] [Google Scholar]