Abstract.
Variations among detector channels in computed tomography can lead to ring artifacts in the reconstructed images and biased estimates in projection-based material decomposition. Typically, the ring artifacts are corrected by compensation methods based on flat fielding, where transmission measurements are required for a number of material-thickness combinations. Phantoms used in these methods can be rather complex and require an extensive number of transmission measurements. Moreover, material decomposition needs knowledge of the individual response of each detector channel to account for the detector inhomogeneities. For this purpose, we have developed a spectral response model that binwise predicts the response of a multibin photon-counting detector individually for each detector channel. The spectral response model is performed in two steps. The first step employs a forward model to predict the expected numbers of photon counts, taking into account parameters such as the incident x-ray spectrum, absorption efficiency, and energy response of the detector. The second step utilizes a limited number of transmission measurements with a set of flat slabs of two absorber materials to fine-tune the model predictions, resulting in a good correspondence with the physical measurements. To verify the response model, we apply the model in two cases. First, the model is used in combination with a compensation method which requires an extensive number of transmission measurements to determine the necessary parameters. Our spectral response model successfully replaces these measurements by simulations, saving a significant amount of measurement time. Second, the spectral response model is used as the basis of the maximum likelihood approach for projection-based material decomposition. The reconstructed basis images show a good separation between the calcium-like material and the contrast agents, iodine and gadolinium. The contrast agent concentrations are reconstructed with more than 94% accuracy.
Keywords: silicon strip detector, photon-counting computed tomography, forward model, ring artifact, material decomposition
1. Introduction
Multibin photon-counting x-ray detectors are promising candidates to be applied in next generation computed tomography (CT). The advantages of multibin photon-counting detectors are the capability to generate separate images in multiple energy intervals (energy bins) with a single x-ray tube voltage acquisition, the improvement in contrast-to-noise ratio by eliminating electronic noise and by applying optimal energy weighting,1 and the reduction of radiation dose while maintaining an image quality comparable to an energy-integrating system in various imaging tasks.2 Moreover, multibin detectors open up the possibility for decomposition techniques, such as K-edge imaging,3 which can identify the contrast agents, e.g., gadolinium and iodine, as well as their densities.
In order to achieve these advantages, detectors with sufficient homogeneity among the detector channels are needed. In practice, variations among the electronic devices are unavoidable. Therefore, energy thresholds that are defined by setting comparator voltages in the readout circuits vary for different detector channels. This leads to inhomogeneities since some detector channels might count systematically more than other equivalent ones and photons that enter different channels with the same energy might be registered in different energy bins. These differences between detector channels can lead to ring artifacts in the reconstructed images4,5 as well as biased estimates that make quantitative CT difficult.6,7 The calibration methods proposed so far are developed based on flat fielding,5,8–10 where transmission measurements for a number of material-thickness combinations are required to account for the inhomogeneous detector responses. However, the calibration phantoms can be rather complex and an extensive number of measurements are required. For instance, the approaches published by Schmidt9 and Alvarez10 require a calibration measurement for each basis material that is used, and the inhomogeneity compensation method for the elimination of ring artifacts proposed by Persson and Bornefalk5 needs transmission measurements for a high number of thickness combinations of two or more calibration materials.
In this paper, we propose a spectral response model for a multibin photon-counting detector that allows the prediction of the binwise response for each detector channel. The modeling is performed in two steps. The first step employs a forward model of the detector that predicts the expected number of photon counts in each energy bin, taking into account parameters such as the shape of the incident spectrum, the x-ray flux, the absorption efficiency of the detector, and the bin sensitivity function, in which the individually calibrated energy thresholds play an important role. The second step aims to correct systematic discrepancies between measurement and simulation that could not be captured by the forward model. This step utilizes a limited number of transmission measurements with a set of flat slabs of two absorber materials to fine-tune the model predictions. For this purpose, simulated transmission responses are fitted to real measurements, and a look-up table of correction factors is generated. Spectral responses simulated with the aid of the forward model can then be corrected with this look-up table.
We apply the spectral response model in two cases. First, we combine the model with the inhomogeneity compensation method proposed by Persson and Bornefalk.5 This method requires a high number of transmission measurements for various combinations of materials and material thicknesses. In contrast to that work, we generate the corresponding detector responses by simulations instead of measurements. Second, we use the response model to obtain the expected numbers of counts that are used in the maximum likelihood (ML) approach for projection-based material decomposition. In this case, preprocessing of measured raw data with the purpose to correct for inhomogeneous detector responses becomes obsolete because the detector response can be predicted individually for each detector channel taking into account the channel-specific calibration parameters. This is in contrast to the approach proposed by Schirra et al.,11 who make use of idealized detector models that predict the same response for all detector channels, although the approach presents a similar ideal of semianalytical calibration method where transmission measurement data are adjusted to fit the model.
The paper is structured as follows: in Sec. 2, we describe the spectral CT detector with multiple energy bins that we make use of as well as the corresponding energy calibration. The modeling of the detector response that is performed in two steps is described in Sec. 3. In Sec. 4, we propose possible applications of the response model, which are ring-artifact-corrected image reconstruction and projection-based material decomposition. The measurements that are used to verify the applications are described in Sec. 5 and the corresponding results are presented in Sec. 6. We conclude the paper with discussions and conclusions in Secs. 7 and 8.
2. Detector and the Corresponding Energy Calibration
2.1. Detector Module
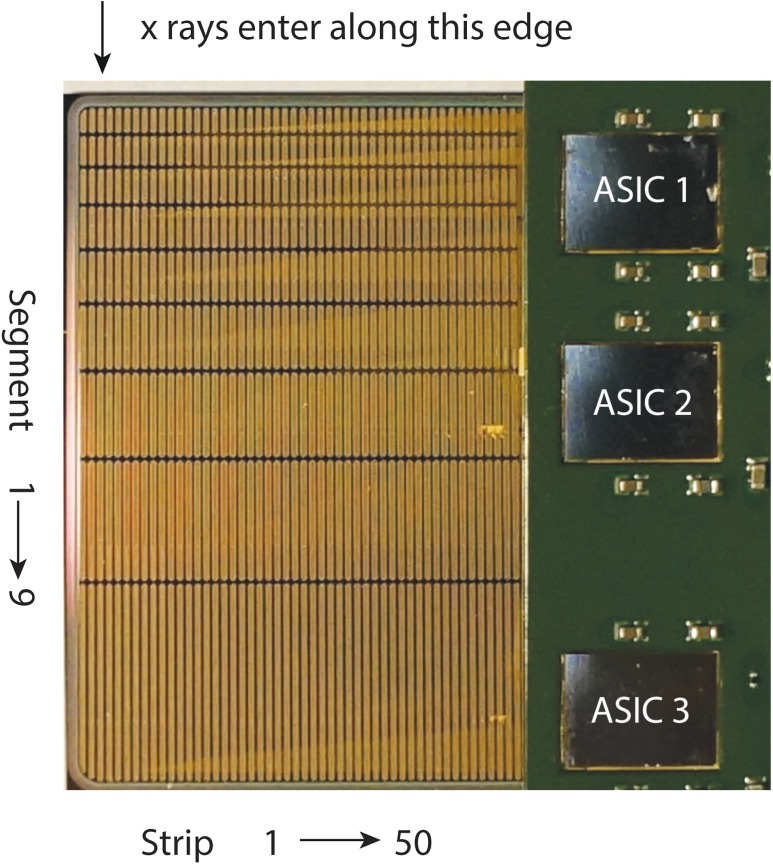
Figure 1 shows one of the silicon-strip detector modules that we have developed for photon-counting spectral CT. The detector module is fabricated on a 0.5-mm thick n-type silicon substrate with 450 implanted p-type electrodes. The 450 electrodes that correspond to 450 detector channels are arranged as 50 strips each subdivided into nine depth segments. The module is aligned in edge-on geometry with its edge directed toward the x-ray beam such that all the nine depth segments of a single strip form a single pixel. This results in a pixel size of and a long absorption path of 30 mm. The nine depth segments are read out individually to cope with the high fluxes in clinical CT, with segment lengths varied such that approximately uniform count rates are expected along the detection depth. Individual readout of each detector channel is achieved with the aid of three ultrafast application-specific integrated circuit (ASICs). When photons impinge on the detector, energy is deposited in the form of released electrical charges. These charges are collected at the electrodes leading to current pulses that are fed into the associated ASIC channels. Each ASIC channel contains a charge-sensitive amplifier, a pulse shaper, eight comparators, and eight counters.12,13 The pulse shaper converts incoming pulses to a common shape with a pulse amplitude proportional to the deposited energies. By distributing the comparator thresholds across the dynamic range of pulse amplitudes, pulse-height intervals are formed, each connected to an individual counter. When a pulse exceeds the lowest threshold, a pulse detection period is triggered. During this period, the highest threshold exceeded by the pulse leads to an increment of the corresponding counter.
Fig. 1.
Detector module for photon-counting spectral computed tomography (CT). 450 detector channels are arranged in 50 strips, where each strip is subdivided into nine depth segments. X rays enter edge-on and are absorbed along the depth segments. Individual readout of each detector channel is achieved with the aid of three ultrafast ASICs.
Previously published measurements with the detector modules have shown a count rate linearity up to 112 mega counts per second (Mcps) per pixel area, applying a 120 kV x-ray spectrum.13 The count rate behavior of the detector approximates a nonparalyzable dead-time model. Correspondingly, the effect of pulse pileup on the energy resolution has been measured for monochromatic x rays with input rates up to .14 The RMS energy resolution has been found to decrease by , starting with an absolute value of 1.5 keV at zero incident flux.
2.2. Energy Calibration
The comparator thresholds that define the pulse-height intervals are realized in practice by voltages in units of mV.12,13 In order to obtain the spectral response of the detector in units of keV, a conversion relationship from the comparator voltage to the corresponding energy value needs to be determined. In the case of a linear relationship between the applied comparator threshold and the keV-value of the energy threshold , the conversion relationship can be expressed as14
| (1) |
where is the gain of the preamplifier in the corresponding ASIC readout channel and is the comparator-dependent offset voltage. Both gain and offset need to be determined individually for each detector channel and each comparator threshold.
We calibrate detector channels by adjusting a simulated pulse-height spectrum to a measured one.15 The measured pulse-height spectrum is obtained by threshold scanning. For this purpose, the detector is illuminated with a constant flux while a comparator threshold is varied across a range of detectable pulse amplitudes. At each scanned threshold position, expressed in voltage values, the total number of counts above the threshold is accumulated during a fixed measurement time, resulting in an integral spectrum in units of mV. The simulated pulse-height spectrum is generated with the aid of a simulation model according to Ref. 15. From a list of simulated photon interactions, an integral spectrum of deposited energies in units of keV is formed. Equation (1) directly represents the relation between the abscissas of the measured and simulated spectra, such that gain and offset can be estimated using a fitting procedure, for instance, a weighted least squares optimization.
Let be the dataset of the measured integral spectrum, where are the threshold settings in mV and is the accumulated counts above the threshold. is an index for the measured threshold steps ranging from 1 to the total number of scanned thresholds. Let the function capture the simulated spectrum of a particular detector channel and return the number of counts above threshold given the parameter values . The weighted least squares optimization problem for each detector channel, in which and are free parameters, can then be expressed as
| (2) |
where the weights are given by the reciprocal of the Poisson variance of the measured photon counts, and is a scale factor dependent on the x-ray flux and measurement time. Equation (1) is applied inside the argument of to transform the threshold values from mV to keV. Systematic uncertainties of gain and offset arise from the misspecification of parameters in the simulation model, for instance, the applied x-ray voltage that can fluctuate around the nominal kV value. Statistical uncertainties are mainly due to a limited measurement time. With sufficient measurement time at each threshold position, the resulting uncertainty of the keV value of a calibrated threshold was found to lie between 0.1 and 0.2 keV,15 which is within the allowable limit for an accurate basis material decomposition as determined by Bornefalk et al.7
3. Modeling of the Spectral Response
3.1. Forward Model
The forward model is an analytical model that describes the signal generation in the detector. When x rays have traversed a path in the imaged object with a linear attenuation coefficient and impinge on the detector, the expected number of photons in energy bin with its range set by thresholds and is given by
| (3) |
where
| (4) |
where denotes the energy response function, which corresponds to the probability density function of the deposited energies caused by incident x-ray photons with energy . It holds that . is, therefore, the bin sensitivity function that gives the fraction of photons with energy that are deposited in bin . denotes the photon fluence from the x-ray tube in units of , is the detection efficiency, and describes the space dependence of the attenuation. The thresholds values and are the calibrated values in units of keV (see Sec. 2.2).
In this study, the energy response function is retrieved with the aid of a detailed Monte Carlo simulation. The polyenergetic simulations are performed by modeling monoenergetic x rays at 1 to 120 keV in 1 keV increments. The simulation procedure is described in detail in Ref. 15 and briefly restated here. For each simulated energy , 100,000 incident photons that impinge on the central strip of the detector module in edge-on geometry are traced through a virtual block of silicon with the same dimensions as the active volume of the real detector module. The block is geometrically subdivided into compartments that represent the strips and the depth segments. Photon interactions including photonelectric absorption, Compton scattering, and Rayleigh scattering are traced separately for each compartment. If interaction occurs near a compartment border, charge might leak to a neighboring detector channel and result in a registered pulse at that location. Such charge sharing is also accounted for using the model described in Ref. 15. Interactions that are not registered in the central strip but in neighboring ones correspond to the scattered events. These events would be present in the central strip if the whole detector is irradiated. The simulation results in a list of energy depositions for each depth segment, from which a spectrum of deposited energies can be formed. Electronic detector noise, as determined earlier in Ref. 16, is added by convolving the simulated spectrum with a Gaussian amplitude distribution with . The spectrum is then normalized by setting its integral equal to 1, which results in the energy response function .
The x-ray photon fluence is taken from Ref. 17 according to the tube settings used in the real measurements. For each depth segment within the simulated strip, the detection efficiency is calculated by
| (5) |
where is the length of the silicon in front of the depth segment of interest, is the total absorption length of the detector strip of 30 mm, and is the linear attenuation coefficient of silicon taken from the XCOM database.18 With the aid of the forward model, a modeled spectral response can be obtained in terms of a spectral histogram of photon counts.
3.2. Correction of Systematic Discrepancies
Naturally, there are certain discrepancies between the modeling and the physical measurements. The forward model in Sec. 3.1 and the energy calibration method in Sec. 2.2 are developed based on an assumption that parameters in the simulation model such as detection efficiency, electronic noise, and charge collection speed are identical for detector channels with the same absorption depth. However, in reality, these parameters may be different for different detector channels due to material quality differences and variations in the manufacturing process. Also, the shape of the incident spectrum can differ for different detector pixels due to the heel effect. The aging of the detector material can additionally alter the system response over time.
In order to better model the spectral response of the detector module, we correct these discrepancies between the model and the physical measurement. The procedure works as follows: a series of measurements is performed with different absorber materials and material thicknesses where spectral histograms of photon counts are obtained. In parallel, the forward model is applied to channelwise predict the expected numbers of photon counts for each of the transmission measurements. For each detector channel and each energy bin, the measured and simulated number of counts obtained at all transmission measurement steps compose the dataset for an empirical fitting function, as proposed by Ding and Molloi.19 The fitting function utilizes three parameters, , and , to account for the nonlinear relation between the simulation and measurement. The fitting function is expressed as
| (6) |
where and are the measured and simulated counts normalized by the air scan results in order to cancel out the drifts due to long-term detector instabilities:
| (7) |
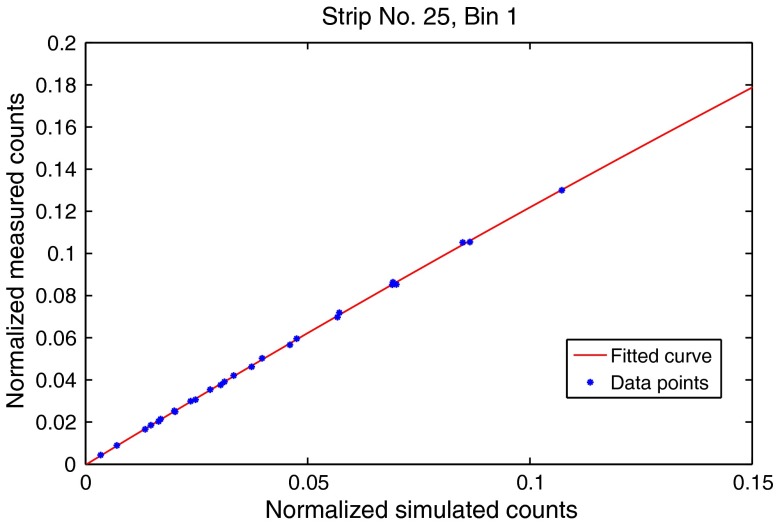
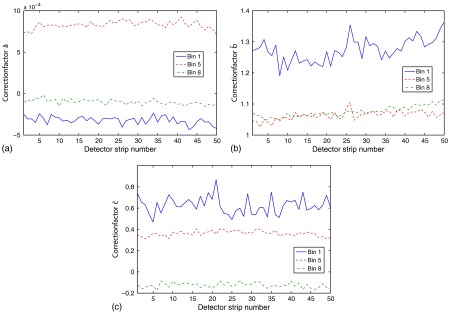
where and are the measured and simulated counts in the given histogram bin, is the average number of counts registered in one strip during the air scan performed during the transmission measurements, and is the corresponding simulated counts. We obtain the parameter estimators , , and for each detector channel and each energy bin with the aid of nonlinear least squares and store them in a look-up table. The fitting result of the central strip of the detector module for the first energy bin is shown in Fig. 2, for example. The ranges of the correction factors for the energy bin 1, bin 5, and bin 8 across all detector strips in the detector array are shown in Fig. 3. A detailed description of the transmission measurements follows in Sec. 5.3.
Fig. 2.
Fitting result of the central strip of the detector module for the first energy bin.
Fig. 3.
Correction factors across all detector strips in the detector array for the energy bin 1, bin 5, and bin 8. (a) Correction factor . (b) Correction factor . (c) Correction factor .
Correction with the look-up table is applied to the predicted number of counts from the forward model for each detector channel and each energy bin as
| (8) |
where , the corrected number of bin counts, is the output of the spectral response model in this paper and is the average number of counts registered in one strip during the air scan performed during the image acquisition described in Sec. 5.2.
4. Applications of the Spectral Response Model
We apply the spectral response model in two cases. In the first case, the model is used for the inhomogeneity compensation method proposed by Persson and Bornefalk5 that has shown superior capability in eliminating ring artifacts in reconstructed CT images. In contrast to that work, the spectral responses to various transmission spectra are obtained by simulations instead of measurements. In the second case, we use the spectral response model to obtain the expected numbers of photon counts that are used in the ML approach for projection-based material decomposition, which allows us to quantify selected basis materials.
4.1. Ring-Artifact-Corrected Image Reconstruction
The compensation method proposed by Persson and Bornefalk5 “reshuffles” the measured raw counts among the energy bins using an affine transformation. The reshuffled results should be as similar as possible to the output of a reference detector, which is preferably chosen so that its threshold positions are close to the mean values of the threshold positions of all the detector channels. The compensation scheme is applied separately for each detector pixel instead of for individual detector channels to avoid difficulties associated with possible photon starvation. The signal from a detector pixel is the sum of the counts registered in the nine corresponding depth segments. For each detector pixel, denotes the measured number of counts in energy bin , is the corresponding reshuffled number of counts calculated by
| (9) |
where is a matrix, is a column vector with elements, and is the number of energy bins. To make the reshuffled number of counts in energy bin approach the expected number of counts in the same energy bin of the reference detector, and and are obtained by minimizing the mean square error (MSE) of the estimator for , where MSE is defined as
| (10) |
where the expectation value is taken over all possible transmission spectra and all possible noise realizations. To minimize the MSE, derivatives of Eq. (10) with respect to and are taken and are equal to zero. By solving the differentiation equations, which have been simplified in Persson and Bornefalk,5 the elements of and are obtained. Since the number of possible transmission spectra is infinite, the expectation values in Eq. (10) as well as the corresponding differentiation equations must, in practice, be replaced by expectation values over a finite number of transmission spectra. A number of transmission measurements are needed in order to determine and in Eq. (10) for the corresponding transmission spectrum. We obtain the transmission spectra by attenuating the photon fluence in Eq. (3) with 121 combinations of 0 to 95 mm polymethyl methacrylate (PMMA), in steps of 9.5 mm, and 0 to 30 mm Al, in steps of 3 mm. For each of these transmission spectra, the expected number of photon counts for each detector pixel is obtained by the spectral response model. The number of photon counts in the energy bin of the reference detector is obtained by binwise averaging of all pixels for each transmission spectrum.
After obtaining the elements in and , the measured raw counts in the bins are affine transformed according to Eq. (9) for the image reconstruction process. For energy bin , detector pixel , and projection number , the reshuffled number of counts is transformed into a log-normalized projection:
| (11) |
where is the number of detector pixels, is the number of counts registered in energy bin and the detector pixel during an air scan. The log-normalized projection data are then rebinned to a parallel-beam geometry using linear interpolation. Finally, images are then reconstructed separately for each energy bin using standard filtered back projection techniques.
4.2. Quantitative Material Decomposition
The binwise reconstructed images obtained according to Sec. 4.1 can be used to achieve image-space basis material decomposition using the weighted sum of these images. The weights can be carefully selected in order to highlight the material of interest.20 However, such an approach does not eliminate beam hardening artifacts.21 Therefore, we prefer a projection-based approach, where data used for image reconstruction are independent of energy such that the resulting images are free of beam-hardening artifacts. In this approach, the linear attenuation coefficient in the forward model in Eq. (3) is approximated by a linear combination of energy-dependent attenuation functions of the basis materials.22 In the following, we choose Al, PMMA, iodine, and gadolinium as the basis materials such that the linear attenuation coefficient can be written as
| (12) |
where the values represent PMMA, Al, iodine, and gadolinium, successively, denotes the local density, and denotes the mass attenuation coefficient of the corresponding basis material.
From the photon counts that are binwise measured with the detector module for each projection, the line integral of the coefficients , which is expressed as , , can be determined for each detector pixel. Since the number of energy bins exceeds the number of basis material functions, an ML approach is used as it is described in Ref. 23:
| (13) |
where is the number of counts in energy bin and are the expected number of counts in the corresponding energy bin obtained by the spectral response model with respect to the four free optimization parameters . The MATLAB function fmincon is used for the optimization. After has been determined for each projection and each detector pixel, can be reconstructed via an implementation of the inverse Radon transform to generate the basis material images.
5. Data Acquisition and Processing
5.1. Measurement Setup
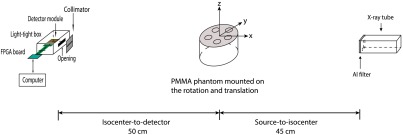
A table-top setup with one detector module was used for the data acquisition. Figure 4 shows a schematic sketch of the measurement setup, where the detector module was aligned in edge-on geometry and mounted in a light-tight aluminum box with an x-ray-transparent window. The x-ray source (COMET MXR-160HP/11, Switzerland) utilizing a tungsten anode with a target angle of 11 deg was operated with a 1-mm focal spot size. The beam was filtered through a 4-mm thick Al filter in addition to a 0.8-mm Be filter inherent in the x-ray tube. A 2-cm wide and 3-mm high collimator slit was placed in front of the detector to reduce possible scattering. The source-to-detector distance was 95 cm.
Fig. 4.
Schematic sketch of the measurement setup. The detector is mounted in a light-tight box with an x-ray-transparent opening at 95 cm from the x-ray tube. The x-ray beam is filtered by an Al filter and is collimated. It enters the detector strips edge-on. A PMMA phantom can be placed on the rotation and translation stage with source-to-isocenter distance at 45 cm.
5.2. Tomographic Imaging of a PMMA Phantom
We took a tomographic image of a PMMA phantom that was mounted on a rotation and translation stage in between the x-ray source and the detector module according to the sketch in Fig. 4. The phantom made of PMMA and 90 mm in diameter hosted five cylindrical inserts, where polystyrene containers filled with different substances could be placed. A photograph of the phantom is shown in Fig. 5. In this study, the five containers were filled with water, rapeseed oil, and plaster powder, which contains calcium, iodine contrast agent (, or diluted Visipaque), and gadolinium contrast agent (, , Dotarem), as are labeled in Fig. 5. Since the detector incident window was too small to cover the entire field of view, the phantom was translated in 11 steps along the -direction (see Fig. 4) with a step size of 9.5 mm. The step size corresponded to the width of 50 strips () divided by a setup-specific magnification factor of 2.1. At each translation position, 760 projection samples were acquired with a sample duration of 3.75 ms, resulting in an exposure time of 2.85 s and a dose equivalent of 11.4 mAs. The projection samples cover 360 deg at each translation step, where the samples with an angular separation of 180 deg, denoted as and , were averaged as to suppress artifacts. The images were then reconstructed separately for each energy bin from using filtered back projection with the MATLAB (The MathWorks Inc., Natick, Massachusetts) function iradon on a pixel grid using a Hanning filter. An x-ray tube setting of 120 kV tube voltage and 4 mA tube current was applied. In addition, an air scan was performed with the same parameters as for the normalization purpose.
Fig. 5.
Photograph of the PMMA phantom that accommodates five cylindrical inserts, in which polystyrene containers filled with different substances can be placed. The diameter of the phantom is 90 mm, the polystyrene containers have an outer diameter of 22 mm and an inner diameter of 18 mm. The used substances in the containers are water, rapeseed oil, and plaster powder, which contains calcium, iodine contrast agent ( or diluted Visipaque), and gadolinium contrast agent (, , Dotarem).
The thresholds were spread out in the dynamic range of x-ray energies such that counts summed over depth segments were far from starvation, but they were not optimized in any other way. The thresholds for eight energy bins were globally set through comparator voltages at 27, 41, 61, 75, 88, 102, 110, and 129 mV. The energy calibration method described in Sec. 2.2 has been applied to the detector module. The resulting estimates of gain and offset were then used to calculate the corresponding energy thresholds for each detector channel according to Eq. (1). The calibrated energy thresholds were , , , , , , , and . Error bars are the standard deviations taken over 450 detector channels, which can be taken as a measure of the uncertainty of the threshold location of the detector module.
5.3. Measurements for the Correction of Systematic Discrepancies
The transmission measurements used in the correction step described in Sec. 3.2 were performed with the aid of 10 slabs of PMMA (from 9.5 to 95 mm) and 10 slabs of Al (from 3 to 30 mm). Each of these slabs was placed successively between the x-ray tube and the detector resulting in 20 measurements in total. For each measurement, 20,000 samples of 4 ms each were acquired with an x-ray tube setting of 120 kV and 4 mA. The comparator thresholds were kept in the same positions as they were during the image acquisition in Sec. 5.2.
6. Results
6.1. Modeled Spectral Response of the Detector
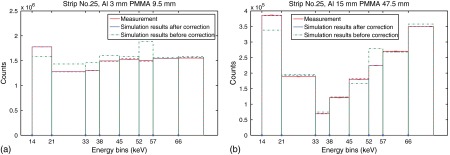
In order to check the performance of the spectral response model, the binwise responses obtained from both measurement and simulation were compared. Figure 6 shows the detector responses in the central strip of the detector module to two different transmission spectra, for which two combinations of Al and PMMA slabs were used. The first spectrum was generated by attenuating a 120 kV x-ray spectrum with 3-mm Al and 9.5-mm PMMA. For the second, 15-mm Al and 47.5-mm PMMA were used. The simulations were accomplished using the spectral response model described in Sec. 3. In Fig. 6, we show the measurement results as well as the simulation results before and after the correction of the systematic discrepancies described in Sec. 3.2. The error bars are given by the Poisson variance of the measured number of photon counts and are almost not visible in the figures. After the correction, the predicted number of photon counts in each energy bin match well with the measurements with discrepancies smaller than 2.5%.
Fig. 6.
Spectral responses in the central strip of the detector module by both measurement and simulation. (a) is the result for a transmission spectrum attenuated by 3-mm Al and 9.5-mm PMMA. (b) is the result for a transmission spectrum attenuated by 15-mm Al and 47.5-mm PMMA. Error bars are given by the Poisson variance of the measured number of photon counts, almost not visible in the figures.
6.2. Reconstructed Images of the PMMA Phantom
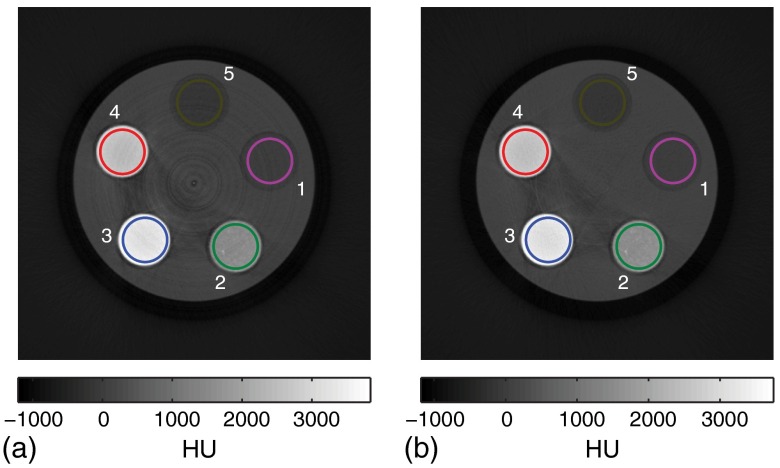
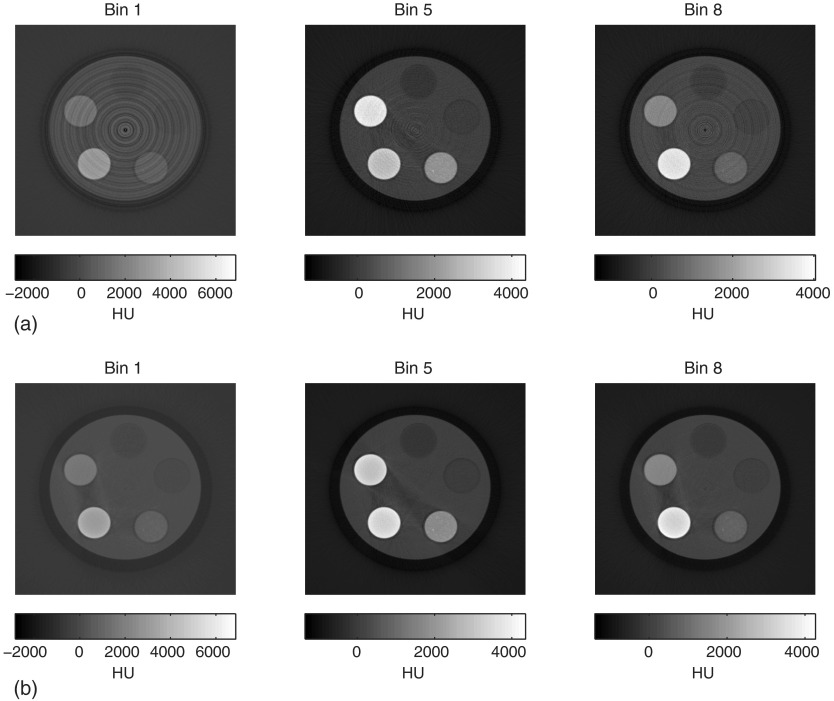
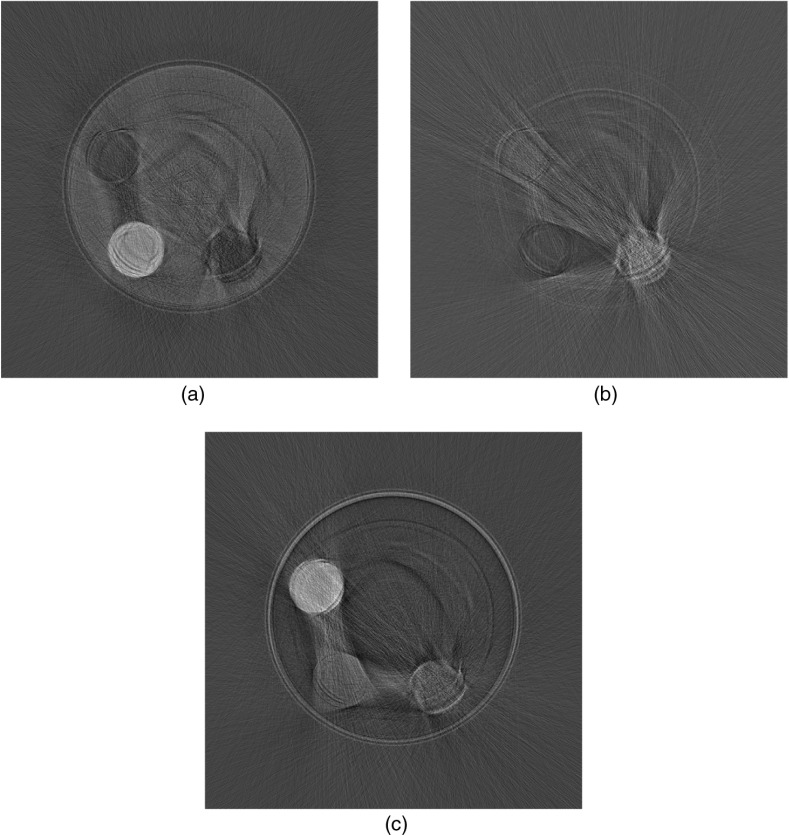
The image reconstruction results of the projection data obtained according to Sec. 5.2 are shown in Fig. 7. The images that were reconstructed directly from the raw projection data are shown in Fig. 7(a). By contrast, the images that were reconstructed after applying the inhomogeneity compensation method, described in Sec. 4.1, are shown in Fig. 7(b). To obtain these final images, the projection data were binwise reconstructed and the resulting bin images were summed with equal weights. All images were normalized to Hounsfield units (HU) measured from the circular region of interest (ROI) placed in the water insert, with a radius a few pixels less than that of the inserts. Ring artifacts that are present in the image are reconstructed by the raw projection data and are negligible in the image corrected by the inhomogeneity compensation method. In addition, reconstructed bin images for energy bin 1, bin 5, and bin 8 are shown in Fig. 8 for a better illustration of the effectiveness of the inhomogeneity compensation method, since those individual bin images have more artifacts due to the lack of possible compensation during the equally weighted sum process. The ring artifact correction appears to have a large effect on the overall HU values, especially in the lower energy bins. This is because the HU values measured in the corresponding water inserts have been changed due to the elimination of ring artifacts. Moreover, the inhomogeneity compensation method functions in such a way that its output is always as similar as possible to the output of the reference detector. In this work, the output of the reference detector is the binwise averaged value of all detector pixels, which results in concentrated overall HU values in the ring-artifact-corrected images.
Fig. 7.
Reconstructed images of the cylindrical PMMA phantom with five different inserts that are labeled in the images as: 1, water; 2, calcium; 3, gadolinium; 4, iodine; 5, oil. (a) is the image reconstructed from the raw projection data that are normalized by flat fielding using an air scan. (b) is the image reconstructed from the projection data that are processed with the inhomogeneity compensation method. All images are normalized to Hounsfield units (HU) measured in the water insert. Region of interests of the inserts are marked by circles with radii a few pixels less than that of the inserts.
Fig. 8.
Reconstructed bin images of energy bin 1, bin 5, and bin 8. (a) are the bin images reconstructed from the raw projection data that are normalized by flat fielding using an air scan. (b) are the bin images reconstructed from the projection data that are processed with the inhomogeneity compensation method. All images are normalized to HU measured in the water insert.
6.3. Material Identification and Quantification
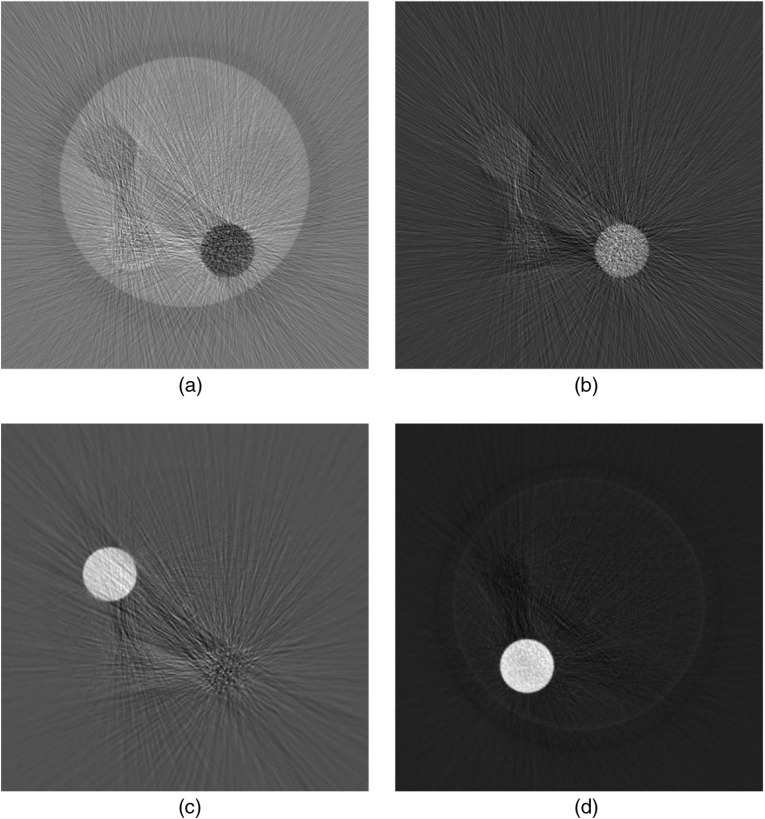
The results of the basis material decomposition, where images were reconstructed separately for each basis material according to Sec. 4.2, are shown in Fig. 9. Basis material images were obtained by reconstructing for each image pixel on a pixel grid. Due to the decomposition into the four basis material functions, the PMMA material and the plaster insert are the most prominent in the PMMA and Al images, respectively, and the two contrast agents are well separated from the surrounding materials in the iodine and gadolinium images. Additionally, we measured the iodine and gadolinium concentrations by averaging over circular ROIs within the corresponding inserts, as they are illustrated in Fig. 7. The quantification results are summarized in Table 1, showing good agreement between the measured values and the nominal concentrations. Error bars are derived from the standard deviations within these ROIs.
Fig. 9.
Basis material images for PMMA, Al, iodine, and gadolinium obtained from the decomposition with look-up table correction applied. (a) PMMA image. (b) Al image. (c) Iodine image. (d) Gadolinium image.
Table 1.
Nominal and measured contrast agent concentrations of the iodine and gadolinium inserts in the phantom are shown in Fig. 5. The errors are obtained from the standard deviations within the region of interests with radii a few pixels less than that of the inserts, as illustrated in Fig. 7. The iodine concentrations are both measured in the basis images obtained from material decompositions with and without applying the look-up table correction.
| Iodine () | Gadolinium () | |
|---|---|---|
| Nominal | 53 | 79 |
| Measured (with correction) | ||
| Measured (without correction) |
In order to illustrate how much model mismatch material decomposition error is being corrected by the look-up table, the decomposition algorithm has been applied to the image data without applying the correction technique described in Sec. 3.2. Basis images obtained from a three basis material decomposition, PMMA, Al, and iodine, are shown in Fig. 10. Severe artifacts appear in these basis images due to the inaccurate ML estimates of obtained by the optimization procedure with an uncorrected expected number of bin counts. The iodine concentration measured in the corresponding insert is shown in Table 1, which deviates from the nominal value with a larger error bar compared with the iodine concentration measured from the basis image in Fig. 7. We lower the number of basis materials to reduce the impact of statistical errors during the decomposition, which results in the reduction of streak artifacts in Fig. 10. Therefore, the measured iodine concentration obtained from the decomposition without the look-up table correction applied might be more deviated from the nominal value if gadolinium is added as the fourth material.
Fig. 10.
Basis material images for PMMA, Al, and iodine obtained from the decomposition without applying the look-up table correction. (a) PMMA image. (b) Al image. (c) Iodine image.
7. Discussions
In Fig. 9, the streak artifacts are quite apparent in the reconstructed images, especially along the direction of the greatest attenuation. This is caused by photon starvation along these projection lines, which results in large statistical errors during the optimization procedure in determining the ML estimates of . Moreover, four basis materials in the decomposition algorithm easily lead to high noise in the basis images since estimating a larger number of parameters from the same data leads to higher variance. As suggested in related publications, the basis image noise might be reduced by optimizing the locations of the threshold energies,24 which could be an interesting topic for our further studies. More advanced image reconstruction techniques, e.g., iterative reconstruction methods, could also be applied instead of filtered back projection since they have shown high potential in reducing noise and artifacts in CT images.25
It has been discussed in our previous work15 that the effect of pulse pileup can be included in the model by attributing a pulse shape to each simulated photon interaction and giving a time structure to these pulses. However, in this study, the model does not account for the pileup effect. In this work, we employ x-ray currents lower than 5 mA and a source-to-detector distance at 95 cm. This results in an input count rate lower than at which the pulse pileup effect can be neglected.
The spectral response model described in this paper is also applicable to other photon-counting detectors. CdTe/CZT detectors, for instance, with readout circuits similar to the one used in this study can be simulated with the same forward model, as is given in Eq. (3).3,23 Accordingly, parameters in the forward model would need to be modified to capture the specific physical characteristics of the applied detector materials. This would involve the additional simulation of K-edge escape photons and a modified charge collection and pulse pileup behavior.
PMMA and Al are employed in the transmission measurements for the correction purpose because they are commonly used as two basis materials in the material decomposition.4,9,10 Due to their distinct difference in the average atomic number, the linear combinations of their attenuation coefficients can accurately describe the attenuation of an object without a K-edge element.26 Therefore, the object-dependent effects in the employed correction technique are expected to be small, except potentially in the case of K-edge contrast agents. From the results presented in this paper, the correction technique that finds one approximate correction works well with the imaging task including K-edge elements iodine and gadolinium. However, additional material calibrations with K-edge elements may increase the accuracy in the quantitative results of material decomposition as has been investigated by Schmidt.9 Further work is, therefore, required to optimize the number and thicknesses of the materials used for the transmission measurements.
8. Conclusions
In this work, we present a spectral response model for a silicon-strip multibin detector for photon-counting spectral CT. The modeling procedure combines the benefit of a detector forward model and a data correction step based on a limited number of transmission measurements. It offers an effective way to accurately predict the binwise response of the detector. This is validated experimentally with two application examples. First, the model is used in combination with the inhomogeneity compensation method proposed by Persson and Bornefalk.5 Images obtained with a multibin detector tend to suffer from ring artifacts due to inhomogeneity between different detector channels. The compensation method reduces ring artifacts by requiring time-consuming transmission measurements to determine the necessary parameters. Our spectral response model successfully replaces these measurements by simulations, saving a significant amount of measurement time. Second, the spectral response model is used as the basis of the ML approach for projection-based material decomposition. The reconstructed basis images show a good separation between the calcium-like material and the contrast agents, iodine and gadolinium. Additionally, the contrast agent concentrations are reconstructed with more than 94% accuracy.
Acknowledgments
This study was supported by the Erling-Persson Family Foundation (Familjen Erling-Perssons stiftelse) as well as the Swiss National Science Foundation and the China Scholarship Council.
Biographies
Xuejin Liu is a PhD student at KTH Royal Institute of Technology in Sweden. Her current research is mainly focused on developing a calibration method for spectral photon-counting detectors.
Mats Persson is a PhD student at KTH Royal Institute of Technology in Sweden. His research is focused on data processing and reconstruction methods for photon counting spectral computed tomography.
Hans Bornefalk received his PhD in 2006 from KTH Royal Institute of Technology in Sweden. He has been active in the field of photon counting mammography and spectral CT imaging techniques at KTH for over a decade.
Staffan Karlsson: Biography is not available.
Cheng Xu received his PhD in 2012 from KTH in Sweden. He then worked as a postdoc at KTH until September 2014, and now he is a system engineer at Prismatic Sensors AB. His research interests focus on the simulation and measurement of silicon photon-counting detectors.
Mats Danielsson is a professor at the KTH Royal Institute of Technology in Stockholm, Sweden. He received his PhD in physics in 1996 from KTH. He is currently sharing his time between KTH and Prismatic Sensors AB, a company commercializing a new technology for photon-counting CT, based on research performed in the group.
Ben Huber is a postdoc at KTH Royal Institute of Technology in Sweden. He received his PhD from the University of Zürich, Switzerland, where he worked on instrumentation and data analysis in gamma-ray astronomy. His current research focuses on the simulation and characterization of a photon-counting silicon-strip detector for spectral CT.
References
- 1.Schmidt T. G., “Optimal image-based weighting for energy-resolved CT,” Med. Phys. 36(3), 3018–3027 (2009). 10.1118/1.3148535 [DOI] [PubMed] [Google Scholar]
- 2.Le H. Q., Ducote J. L., Molloi S., “Radiation dose reduction using a CdZnTe-based computed tomography system: comparison to flat-panel detectors,” Med. Phys. 37(3), 1225–1236 (2010). 10.1118/1.3312435 [DOI] [PMC free article] [PubMed] [Google Scholar]
- 3.Roessl E., Proksa R., “K-edge imaging in x-ray computed tomography using multi-bin photon counting detectors,” Phys. Med. Biol. 52(15), 4679 (2007). 10.1088/0031-9155/52/15/020 [DOI] [PubMed] [Google Scholar]
- 4.Wang X., et al. , “Uniformity correction in photon-counting x-ray detector based on basis material decomposition,” in Proc. of IEEE Nuclear Science Symposium, pp. 4902–4905 (2008). [Google Scholar]
- 5.Persson M., Bornefalk H., “A framework for evaluating threshold variation compensation methods in photon counting spectral CT,” IEEE Trans. Med. Imaging 31(10), 1861–1874 (2012). 10.1109/TMI.2012.2204274 [DOI] [PubMed] [Google Scholar]
- 6.Bornefalk H., Persson M., Danielsson M., “Necessary forward model specification accuracy for basis material decomposition in spectral CT,” Proc. SPIE 9033, 90332I (2014). 10.1117/12.2043702 [DOI] [Google Scholar]
- 7.Bornefalk H., Persson M., Danielsson M., “Allowable forward model misspecification for accurate basis decomposition in a silicon detector based spectral CT,” IEEE Trans. Med. Imaging 34, 788–795 (2015). 10.1109/TMI.2014.2361680 [DOI] [PubMed] [Google Scholar]
- 8.Jakubek J., “Data processing and image reconstruction methods for pixel detectors,” Nucl. Instrum. Methods Phys. Res. Sect. A 576(1), 223–234 (2007). 10.1016/j.nima.2007.01.157 [DOI] [Google Scholar]
- 9.Schmidt T. G., “An empirical method for correcting the detector spectral response in energy-resolved CT,” Proc. SPIE 8313, 831312 (2012). 10.1117/12.912136 [DOI] [Google Scholar]
- 10.Alvarez R. E., “Estimator for photon counting energy selective x-ray imaging with multibin pulse height analysis,” Med. Phys. 38(5), 2324–2334 (2011). 10.1118/1.3570658 [DOI] [PMC free article] [PubMed] [Google Scholar]
- 11.Schirra C., et al. , “Towards in-vivo K-edge imaging using a new semi-analytical calibration method,” Proc. SPIE 9033, 90330N (2014). 10.1117/12.2043539 [DOI] [Google Scholar]
- 12.Gustavsson M., et al. , “A high-rate energy-resolving photon-counting ASIC for spectral computed tomography,” IEEE Trans. Nucl. Sci. 59(1), 30–39 (2012). 10.1109/TNS.2011.2169811 [DOI] [Google Scholar]
- 13.Xu C., et al. , “Evaluation of a second-generation ultra-fast energy-resolved ASIC for photon-counting spectral CT,” IEEE Trans. Nucl. Sci. 60(1), 437–445 (2013). 10.1109/TNS.2012.2228276 [DOI] [Google Scholar]
- 14.Liu X., et al. , “A silicon-strip detector for photon-counting spectral CT: energy resolution from 40 keV to 120 keV,” IEEE Trans. Nucl. Sci. 61, 1099–1105 (2014). 10.1109/TNS.2014.2300153 [DOI] [Google Scholar]
- 15.Liu X., et al. , “Energy calibration of a silicon-strip detector for photon-counting spectral CT by direct usage of the x-ray tube spectrum,” IEEE Trans. Nucl. Sci. 62, 68–75 (2015). 10.1109/TNS.2014.2373641 [DOI] [Google Scholar]
- 16.Xu C., et al. , “Preliminary evaluation of a silicon strip detector for photon-counting spectral CT,” Nucl. Instrum. Methods Phys. Res. Sect A 677, 45–51 (2012). 10.1016/j.nima.2012.02.034 [DOI] [Google Scholar]
- 17.Cranley K., et al. , “Catalogue of diagnostic x-ray spectra and other data,” IPEM Report, The Institute of Physics and Engineering in Medicine (IPEM), New York: (1997). [Google Scholar]
- 18.Berger M., et al. , “XCOM: photon cross section database (version 1.3),” National Institute of Standards and Technology, Gaithersburg, Maryland, http://physics. nist. gov/xcom (8 December 2005). [Google Scholar]
- 19.Ding H., Molloi S., “Image-based spectral distortion correction for photon-counting x-ray detectors,” Med. Phys. 39(4), 1864–1876 (2012). 10.1118/1.3693056 [DOI] [PMC free article] [PubMed] [Google Scholar]
- 20.Persson M., et al. , “Energy-resolved CT imaging with a photon-counting silicon-strip detector,” Phys. Med. Biol. 59(22), 6709 (2014). 10.1088/0022-3727/59/22/6709 [DOI] [PubMed] [Google Scholar]
- 21.Tkaczyk J. E., et al. , “Quantization of liver tissue in dual kVp computed tomography using linear discriminant analysis,” Proc. SPIE 7258, 72580G (2009). 10.1117/12.811374 [DOI] [Google Scholar]
- 22.Alvarez R. E., Macovski A., “Energy-selective reconstructions in x-ray computerised tomography,” Phys. Med. Biol. 21(5), 733 (1976). 10.1088/0031-9155/21/5/002 [DOI] [PubMed] [Google Scholar]
- 23.Schlomka J., et al. , “Experimental feasibility of multi-energy photon-counting K-edge imaging in pre-clinical computed tomography,” Phys. Med. Biol. 53(15), 4031 (2008). 10.1088/0031-9155/53/15/002 [DOI] [PubMed] [Google Scholar]
- 24.Roessl E., Proksa R., “Optimal energy threshold arrangement in photon-counting spectral x-ray imaging,” in Proc. IEEE Nuclear Science Symposium, Vol. 3, pp. 1950–1954 (2006). [Google Scholar]
- 25.Beister M., Kolditz D., Kalender W. A., “Iterative reconstruction methods in X-ray CT,” Phys. Med. 28(2), 94–108 (2012). 10.1016/j.ejmp.2012.01.003 [DOI] [PubMed] [Google Scholar]
- 26.Lehmann L, et al. , “Generalized image combinations in dual KVP digital radiography,” Med. Phys. 8(5), 659–667 (1981). 10.1118/1.595025 [DOI] [PubMed] [Google Scholar]


