Abstract.
The objective was to characterize the changes seen from incident Monte Carlo-based scatter distributions in dedicated three-dimensional (3-D) breast single-photon emission computed tomography, with emphasis on the impact of scatter correction using the dual-energy window (DEW) method. Changes in scatter distributions with 3-D detector position were investigated for prone breast imaging with an ideal detector. Energy spectra within a high-energy scatter window measured from simulations were linearly fit, and the slope was used to characterize scatter distributions. The impact of detector position on the measured scatter fraction within various photopeak windows and the value (ratio of scatter within the photopeak and scatter energy windows) useful for scatter correction was determined. Results indicate that application of a single value with the DEW method in the presence of anisotropic object scatter distribution is not appropriate for trajectories including the heart and liver. The scatter spectra’s slope demonstrates a strong correlation to measured values. Reconstructions of fixed-tilt 3-D acquisition trajectories with a single value show quantification errors up to 5% compared to primary-only reconstructions. However, a variable-tilt trajectory provides improved sampling and minimizes quantification errors, and thus allows for a single value to be used with the DEW method leading to more accurate quantification.
Keywords: molecular breast imaging, single-photon emission computed tomography, scatter, dual-energy window, Monte Carlo
1. Introduction
With a variety of available tracers, including those labeled with Tc-99m (140.6-keV gamma ray), nuclear medicine molecular imaging offers the ability to image various functional aspects of tissue or tumors. In breast imaging with Tc-99m sestamibi (MIBI), such as that used in planar molecular breast imaging (MBI), this information may lead to improved detection or classification of suspicious regions within the breast.1–5 The contrast due to regional radiotracer uptake differences and, in the case of volumetric imaging with single-photon emission computed tomography (SPECT), the potential to accurately quantify radiotracer uptake noninvasively provide a useful tool for improved disease diagnosis and patient breast health care. Accurate quantification with a fully three-dimensional (3-D) imaging system can offer a more detailed radiotracer distribution and corresponding uptake values, potentially yielding improved diagnosis and more precise therapeutic monitoring for patients.6,7 Current clinical practice utilizes relative image contrast metrics for diagnosis and therapeutic monitoring, due to the limitations of planar MBI systems which are incapable of absolute quantification. Imaging the breast with a system capable of accurate absolute quantification will both ensure relative contrast measurements are truly representative of radiotracer distribution and could provide a quantitative metric that may be used to develop thresholds for diagnosis.
For accurate quantification of radiotracer uptake, corrections for the effects of scatter and attenuation are necessary. Scattered photons that are detected by the gamma camera degrade image contrast and reduce quantification accuracy when included in the photopeak energy window.8 Indeed, even for systems incapable of absolute quantification, any relative contrast measurements are impacted by scattered photons. In the case of imaging with Tc-99m, Compton scatter results in the detection of photons with energy below 140-keV emission. Using energy discriminating detectors, along with limited range energy windows, allows for the rejection of many of these events. The photopeak windowed events, however, may still be contaminated by the scatter signal in detectors with finite energy resolution.
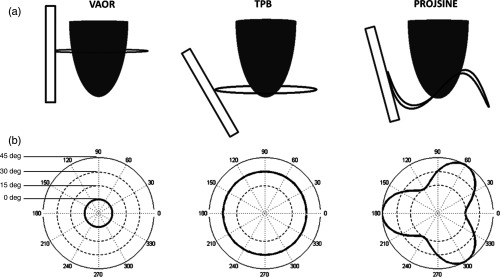
The relative impact of scatter for compressed breast molecular breast imaging (MBI) using Tc-99m sestamibi has previously been investigated.9,10 However, similar studies for tomographic (and semitomographic) imaging of a prone breast have not been performed. Several groups, including our lab, have investigated breast SPECT as a tool for improved detection, diagnosis, or treatment monitoring.11–18 Additionally, both nontraditional acquisition trajectories and variable-angle collimators with dedicated breast SPECT have shown promise for improved lesion detection,11–13,18 but these data acquisition methods may involve inclusion of high-activity regions outside of the breast.19 Examples of possible SPECT trajectories utilized in our lab are shown in Fig. 1, including vertical axis of rotation (VAOR), tilted parallel beam (TPB), and projected sine wave (PROJSINE).11,12 Truly, any arbitrary trajectory in a hemispherical geometry is possible with the dedicated breast SPECT system in our lab.11–13 Understanding the impact of scatter in projections from these nontraditional trajectories is necessary for the application of any scatter correction method for quantitative imaging.
Fig. 1.
(a) Illustration of a gamma camera (rectangle), pendant breast (hemiellipsoid), and detector acquisition trajectory (ring) about the breast. (b) Associated polar plots of the three breast SPECT acquisition trajectories utilized in our lab. Polar plots give the detector tilt (radius from center) as a function of azimuthal 360-deg position around the breast. Both the vertical axis of rotation (VAOR) and tilted parallel beam (TPB) trajectories have fixed detector tilts, whereas the 60-deg offset PROJSINE trajectory utilizes a sinusoidal varying tilt. Note that the example TPB plot is for a fixed tilt of 30 deg, but the detector tilt may be set to any arbitrary fixed or dynamically varying polar angle.
Several scatter correction methods have been employed in traditional SPECT systems,9,19–25 including Monte Carlo estimation,19 spatial deconvolution,20 and dual-energy window (DEW) subtraction methods.19–25 Among these, the DEW method has offered a balance between accuracy and ease of implementation,19 especially in scatter correction of nonuniform distributions. The DEW scatter correction method is reasonably straightforward: it relies on the assumption that the amount of scatter contaminating the photopeak measurement can be estimated by a fixed fraction of the total events detected within a lower energy “scatter window.” This fixed fraction ( value) is determined through a series of calibration experiments and is used when subtracting the images created from the photopeak and scatter window measurements. Thus, the equation for utilizing the DEW method is
where for projection pixel , , True is the estimated number of primary emission events in the photopeak window, and Photopeak and Scatter are the total number of events in the photopeak and scatter energy windows, respectively. Previous studies have shown the DEW method to be effective and robust for estimating and correcting scatter for traditional SPECT acquisitions when calibrated with geometries comparable to the anatomy being imaged.19,21 However, this method of scatter correction assumes a constant shape of the detected scatter distribution profile, with any changes in scatter being reflected only in the total number of integrated events within the lower energy window. For simple, uniform geometries, even those containing nonuniform activity distributions, this assumption is reasonable since all activity is contained within the entire field of view (FOV). However, for imaging geometries (camera and clinical object) with activity outside of the FOV, especially in systems utilizing small FOV cameras and nontraditional acquisition trajectories, this assumption may no longer be valid.
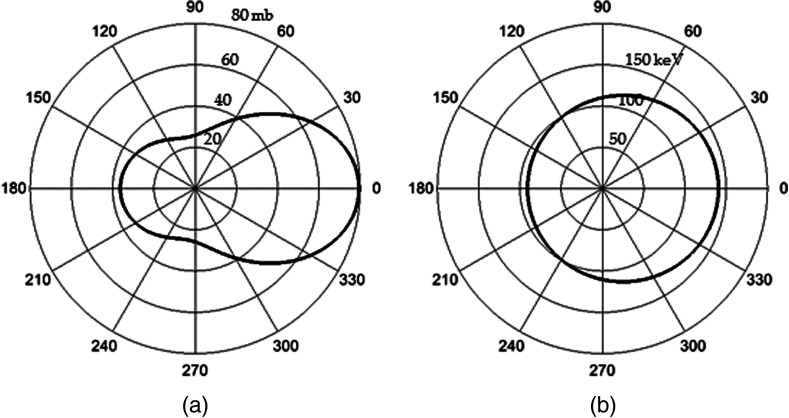
For the relevant photopeak energy range in breast SPECT using Tc-99m, Compton scatter is the dominant degradative interaction within the breast, resulting in photon scattering with energy loss that degrades image quality and quantification capability. The probability distribution for scattering angles at 140 keV, as predicted by Klein–Nishina cross sections (Fig. 2), illustrates preferential low-angle (forward) scattering of photons. The probability of a given scattering angle approximately doubles from 60 deg to , with only minor energy losses. In traditional (e.g., simple circular) trajectories, which contain the source(s) in every projection, the detected scatter distribution is fairly uniform at each detector position; however, in nontraditional trajectories, with asymmetric source geometry, the preferential forward scattering events with minimal energy loss may change the true ratio of scattered events in the energy windows. Significant changes in detected scatter distributions may require trajectory-dependent values with the application of the DEW method.
Fig. 2.
Polar plots for 140-keV photons incident from the left of (a) Klein–Nishina scattering probability cross sections (radius is interaction probability in millibarns) and (b) resultant photon energy (radius in keV) as a function of scatter angle. The cross sections illustrate the preferential low angle scattering, which results in minimal loss of photon energy. For example, a scattering angle of results in only an 8-keV loss of photon energy.
In this study, we characterize the scatter distribution incident on a compact gamma camera when imaging the prone breast with dedicated breast SPECT through Monte Carlo simulations. Both traditional and nontraditional acquisition trajectories, such as those possible with the SPECT subsystem of our dedicated breast SPECT-CT system,11 are included to determine the change in the incident scatter distribution on a detector as a function of detector position. The impact on the application of the DEW scatter correction method with various acquisition trajectories is also investigated.
2. Materials and Methods
To investigate changes in detected scatter distributions, a model of our dedicated breast SPECT system was created using the Monte Carlo N-Particle version 5 simulation package (MCNP5, Los Alamos National Lab). MCNP5 offers the ability to simulate gamma cameras by constructing accurate geometric models, complete with un/matched collimator, and tally detected events. Simulations can be designed to be independent of degrading detector effects that make distinguishing between scattered events (both within the organ and detector) and primary events through energy resolution discrimination difficult or impossible in physical detectors.
In these MCNP5 simulations, an ideal (perfect energy resolution and absorption efficiency) compact gamma camera was modeled. The ideal detector performance allows for the measurement of true incident photon energy distribution, independent of detector material type or performance characteristics. The detector size was chosen to match the gamma camera utilized in our lab, which is comparable to that of other MBI systems.1–5,9 The detector was divided into individual detector elements. A 2.54-cm-thick hexagonal parallel hole lead collimator with 0.2-mm septa and 1.22-mm flat-to-flat holes was also designed to match the dimensions of our physical gamma camera. To verify the model geometry, a point source was simulated, and the percentage of detected primary emissions (geometric sensitivity), , was compared to the expected value calculated from the following equation:
where is the hole diameter, is the effective collimator length, is the septa thickness, and is a coefficient to account for the hole shape.26 For this collimator geometry, the value of is . The resulting measured geometric sensitivity was 0.0124%, which compares favorably with the expected calculated geometric sensitivity of 0.0123%.
For simulating the anatomy, an elliptical cylinder was used as the basis of the patient’s torso. The cylinder was positioned and dimensions were designed to mimic actual patient positioning above a radiopaque bed, which minimizes signal from anatomy outside the desired FOV. Additionally, the heart and liver were simulated using simple cylinders within the torso. These organs are important to include due to the preferential clinical uptake of MIBI in these organs (Table 1) and their proximity to the breast.10,27 The torso, liver, and heart tissues were modeled as tissue-equivalent materials.28 For the breast, a symmetric hemiellipsoid with semimajor and semiminor axis lengths of 10 and 6 cm, comparable to the average observed pendant breast size,29 was placed at the center of rotation, excluding the volume of the ellipsoid intersecting the torso. The breast composition was modeled separately as breast tissue.28 In addition to these four organs, small (1-cm diameter) and large (4-cm diameter) spherical lesions were also individually modeled and centered in the breast. Both were included to determine the effects of a localized high-uptake region within the common FOV. The small lesion is representative of the size of a potential target of interest with breast imaging and is more likely to be obscured or otherwise impacted by uncorrected scattered photons in the reconstruction. The large lesion represents a “worst case” scenario for inclusion of a high-uptake region in the common FOV. While such a large lesion would be easily identified, the large number of relative emissions compared to the breast was thought to potentially impact the incident scatter distribution and lead to increased quantification errors.
Table 1.
Component characteristics of simulated anatomy.
| Component/organ | Shape | Diameter (semi-major/minor axis) (cm) | Volume () | Relative activity concentration () |
|---|---|---|---|---|
| Breast | Hemiellipsoid | () | 754 | 1 |
| Torso | Elliptical cylinder | () | 25447 | 1 |
| Liver | Cylinder | 9 | 1272 | 12 |
| Heart | Cylinder | 8 | 251 | 12 |
| Small lesion | Sphere | 1 | 0.52 | 6 |
| Large lesion | Sphere | 4 | 33.5 | 6 |
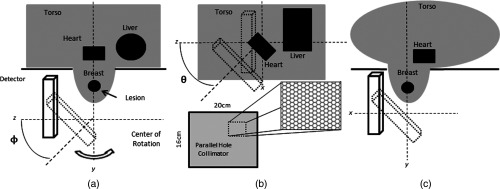
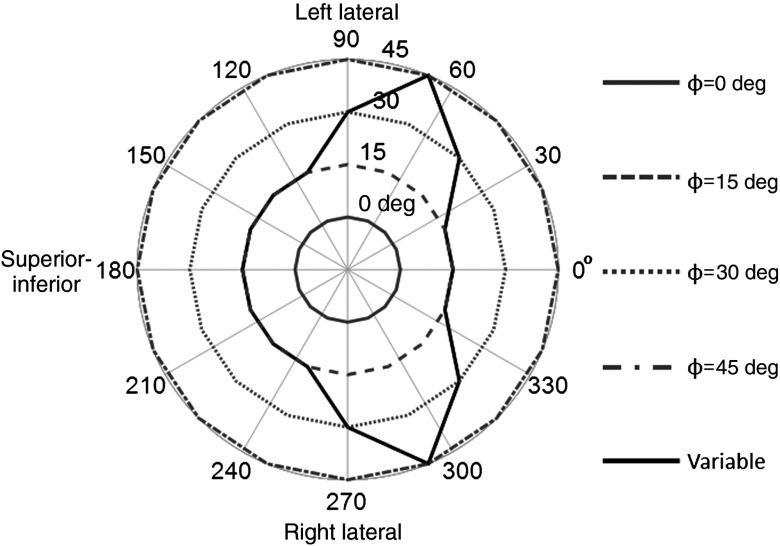
Figure 3 illustrates the modeled anatomic and imaging geometry. The gamma camera was placed at 16 evenly spaced azimuthal ( to 360 deg) positions about the axis of rotation, and four fixed polar tilt ( to 45 deg) angles parallel to or tilting with respect to the rotation axis (e.g., from a vantage perpendicular to the equatorial diameter, to polar tilt angles closer to the southern pole of the hemisphere) (Fig. 4). These positions simulate a range of possible SPECT acquisition trajectories, including one nontraditional trajectory possible with our SPECT system. These trajectories include a simple circular orbit, with the detector varying in azimuthal position only (), as well as more complex positions that utilize detector tilt () to obtain projections into the chest wall. With traditional SPECT systems, the gamma camera is required to orbit the patient’s full thorax,30 resulting in reduced resolution compared to that possible with a dedicated prone breast imaging system. Tilted projections are comparable to the use of slanted collimators, which can accomplish a similar function in imaging into the chest wall as they rotate around the pendant breast,16,18,31,32 with two key differences: an untilted camera with slant-hole collimator will have a varying spatial resolution with respect to the shape of a pendant breast, whereas a tiltable camera with parallel hole collimator has an overall more uniform spatial resolution when viewing the same breast; and variable tilt trajectories, such as those possible with our breast SPECT system, can provide nearly complete sampling of the pendant breast volume beyond that of a fixed-tilt or slant-hole collimator systems.30,33,34 Furthermore, while stationary or rotating slant-hole-type collimators have vastly improved sensitivity, their resolution is highly compromised, and small object visualization is difficult at best.16,31,32 Additionally, a constrained nontraditional trajectory was developed based on the results of the detected scatter distributions. This trajectory is more like the multilobed sinusoidal trajectory that we employ for clinical scanning35 that has both more complete sampling of the volume of interest (VOI), while avoiding hindrances about the pendant breast and also allowing views into the chest wall region.
Fig. 3.
Illustration of simulation geometry including radiopaque patient bed. (a) Lateral view of simulated prone patient geometry indicating the polar tilting angle () of the detector. (b) Posterior–anterior view of geometry indicating the azimuthal rotation angle () and illustration of the hexagonal parallel-hole collimator. (c) Superior–inferior view showing the intersection of the elliptical-cylinder torso and breast.
Fig. 4.
Polar plots of five trajectories simulated from the detector positions with the radius indicating detector tilt ( to 45 deg) about the to 360 deg azimuth. These trajectories were used for determining the impact of changes in the scatter distribution on the application of the dual-energy window (DEW) method. Four trajectories utilize a fixed detector tilt. The variable trajectory was created to minimize direct views of the heart and liver, as is typically done on our physical system for patient imaging. The projection orientation relative to the patient anatomy is also given for three detector positions.
At each position, the detector face was placed 1 cm away from the tangent edge of the breast as is done for clinical imaging. Close proximity to the breast is desired in SPECT imaging to minimize distance-dependent resolution degradation. Each organ was simulated independently with generated histories emitted isotropically from each organ at each detector position, resulting in independent data sets for every detector location.
The simulated energy spectra for each organ at each detector position were then appropriately scaled to match their relative activity concentrations (Table 1), yielding simulations comparable to observed clinical uptake.35 The results from each organ were then summed to create total energy spectra at each detector position. While this method of generating total spectra does not result in clinically proportional noise, it does generate relatively low noise energy spectra useful for characterizing the true underlying shape of the scatter distribution. Each detector position required on a computer with 3.6 GHz with 12-core processors and 32GB of RAM, resulting in approximately 42 CPU-days of processing time.
The scatter distribution within each spectrum was analyzed by first linear fitting the scatter within the 113- to 139-keV range. This energy range was chosen due to both a qualitative assessment of the spectra, indicating this region is approximately linear, and the energy range being most relevant to scatter correction using the DEW method. The slope of the fitted scatter energy range was used to characterize changes in detected scatter, with larger slopes indicating an increase in detected low angle, high-energy scattered photons. The percent of the detected scatter from each organ was determined to identify dominant sources at each detector position.
True scatter within several potential photopeak energy windows (, , ) was calculated at each detector position. The scatter measurements in the photopeak window indicate the true incident scatter on the detector at each position in the absence of detector and electronics effects (i.e., real measurements) that degrade energy resolution. Understanding the potential relative impact of scatter within a chosen photopeak energy window is important for quantitative imaging. Higher percentages of scatter in the photopeak window result in reduced contrast and poorer quantification.
In real measurements with our cadmium zinc telluride-based SPECT system, we have a typical energy resolution of 6.7% FWHM, so we use a window () for imaging about the 140-keV photopeak. Thus, the rest of the analysis metrics will focus on the parameters typically utilized clinically, but the general trends may be extended to alternative energy windows. The ratio of scatter within a photopeak () and lower () energy windows was calculated to determine the value, as given in the following equation:
where is the total number of true-scattered events detected and is the total number of true-scattered events detected in the range of 113 to 133 keV. The value was calculated at each detector position to determine the impact on the application of the DEW method. The correlation between the previously measured slope and the values was determined in order to explore the potential of a projection-dependent value being estimated from the spectral slope. Last, simulated projections were used to reconstruct four sample SPECT trajectories with fixed detector tilts, and one with variable tilts (15 to 45 deg) (Fig. 4). Reconstructions were performed with OSEM (five iterations, four subsets). Projections were created using both primary-only and DEW-corrected photopeak energy window data using a single value. Primary-only and DEW-corrected reconstructions were compared to determine the effects of a single value on quantification accuracy and image noise in trajectories that may include direct views of the heart and liver.
3. Results
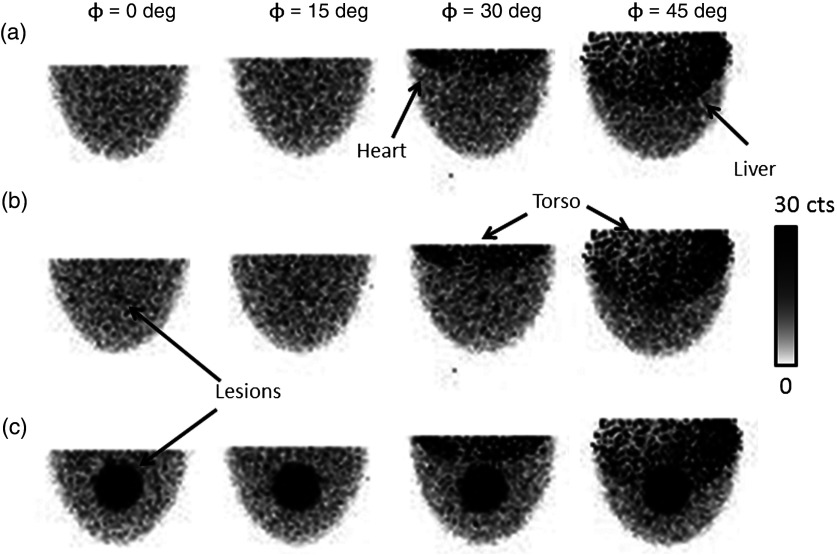
Figure 5 shows example projections obtained from the simulations after normalizing for relative organ uptake. The images show that the heart and liver remain outside of the FOV until the camera is tilted by more than 15 deg.
Fig. 5.
Example scaled, low-noise simulated projections at various indicated polar detector tilts and fixed 225-deg azimuthal angle. As the polar tilt increases, the detector begins to acquire direct views of the heart, liver, and torso, which contribute significantly to the detected events. The radiopaque patient bed minimizes contribution from the other organs near the edges of the field of view (FOV). However, it cannot prevent contamination from the anatomy directly behind the breast in the FOV. Note that the projections were generated by scaling component spectra according to their relative activity concentration, which results in nonproportional noise contributions from each organ. (a) No lesion, (b) 1-cm lesion, (c) 4-cm lesion.
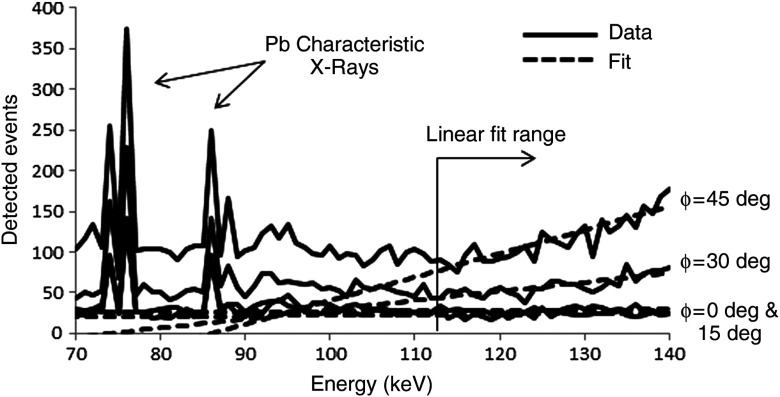
Figure 6 gives an example of detected spectra from four detector positions, with linear fits of the scatter regions. The slopes of the linear fits are used to characterize the scatter distributions as a function of detector position.
Fig. 6.
Example of total spectra with corresponding linear fits from simulations. The linear fit range corresponds to the scatter energy range. Characteristic x-rays from the lead collimator are also seen in the spectra. Note that these spectra are composed entirely of scattered events; the monochromatic 140-keV photopeaks are off scale () and not shown in order to better visualize the fitted scatter region.
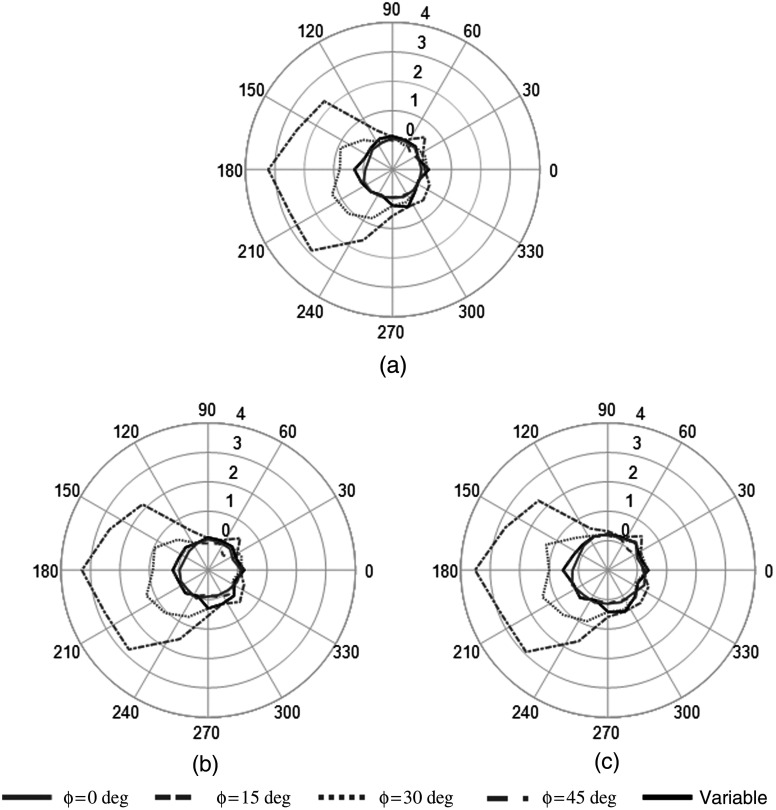
The results of the change in slope for each detector position are shown in Fig. 7, including the conditions with and without the 1- and 4-cm diameter imbedded lesions. As indicated in Fig. 4, the 0-deg position corresponds to the detector facing along the inferior–superior axis. Increasing azimuthal angles simulate clockwise rotation (as viewed from the patient) about the posterior–anterior axis through the center of the breast; this progression yields left lateral, superior–inferior, and right lateral projections, as well as several intermediate projections necessary for tomography. The out-of-field or nontarget organs are viewed 180 deg opposite to the location of the plotted azimuthal position due to the natural opposed displacement of the object in the camera’s line of sight.
Fig. 7.
Polar plots of fitted slope of scatter region of total spectra for each simulated fixed-tilt and variable tilt trajectory. The radius for each trajectory position indicates the slope from the linear fit of the scatter region. (a) No lesion, (b) 1-cm lesion, (c) 4-cm lesion.
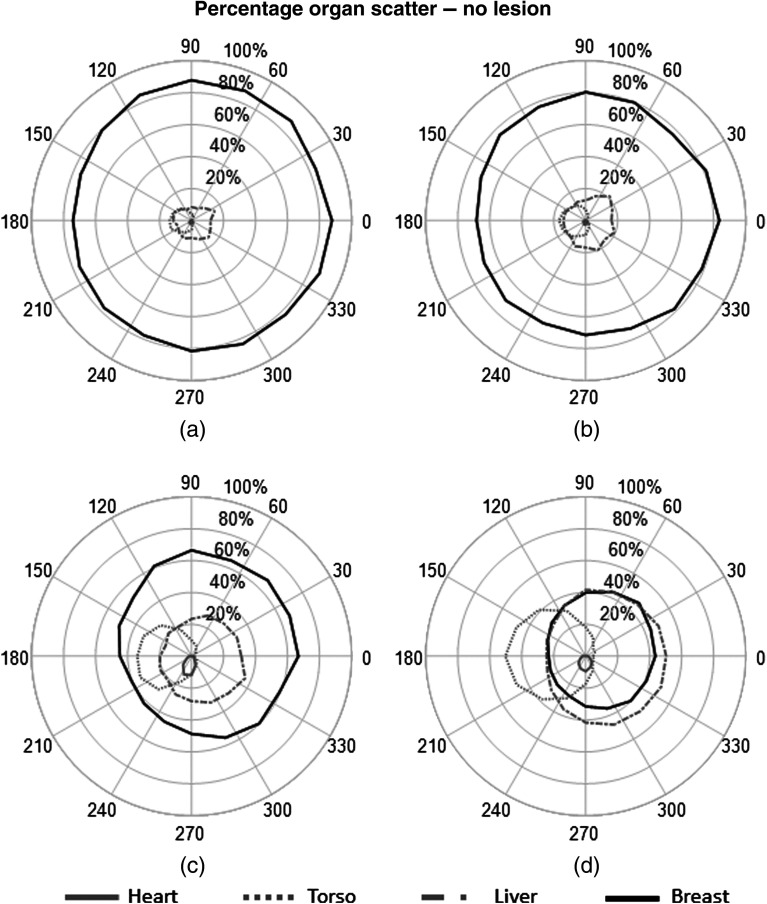
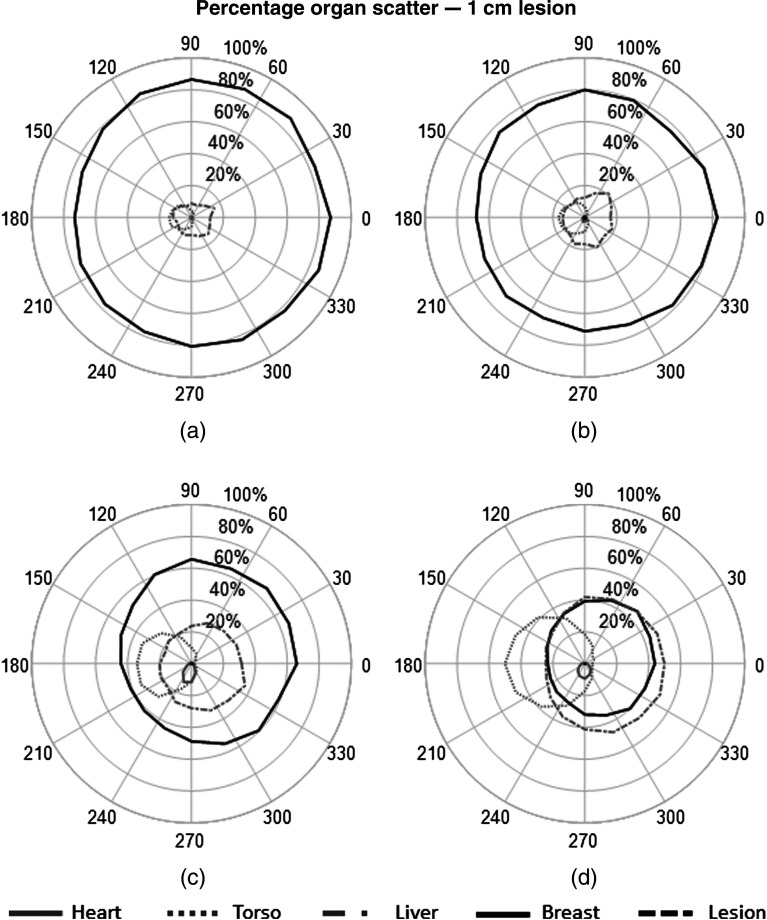
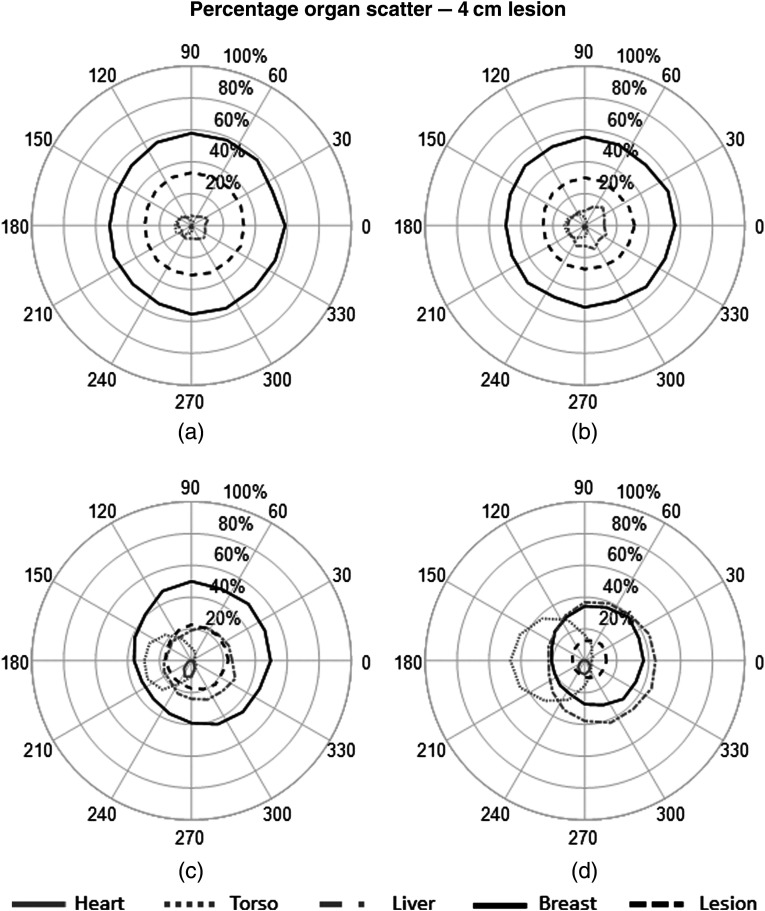
The percent contribution from each source to the fitted scatter energy range was also calculated to determine the primary origins of scattered events and their impact on the detected spectrum at each detector. The plots in Figs. 8–10 show the measured contribution from each source organ simulations with and without the 1- and 4-cm lesions.
Fig. 8.
Polar plots of percent contribution from each organ to the total measured scatter within the 113- to 139-keV energy window. Results from each organ are plotted as a function of detector position for simulation without a lesion. (a) , (b) , (c) , (d) .
Fig. 9.
Polar plots of percent contribution from each organ to the total measured scatter within the 113- to 139-keV energy window. Results from each organ are plotted as a function of detector position for simulation with a 1-cm lesion. (a) , (b) , (c) , (d) .
Fig. 10.
Polar plots of percent contribution from each organ to the total measured scatter within the 113- to 139-keV energy window. Results from each organ are plotted as a function of detector position for simulation with a 4-cm lesion. (a) , (b) , (c) , (d) .
Additionally, while the previous figures illustrate the percent contribution from each organ to the 113- to 139-keV scatter energy range, Table 2 gives the average scatter fraction within various photopeak energy windows for each simulated trajectory. Here, we define the scatter fraction as
where is the number of true-scattered events within the given photopeak energy window and is the total number of detected events (primary + scatter) in the same energy window. These values indicate the relative amount of signal within a given photopeak window that are truly scattered events incident on the detector. Note that due to the simulation of an ideal detector with perfect energy resolution, all incident photons have measured energies at or below the 140-keV emission. No differences were seen with the inclusion of 1- or 4-cm lesions.
Table 2.
Average scatter fraction of typically used photopeak energy windows. Scatter fraction values indicate the relative number of signals within each defined photopeak window that are true scatter events incident on the detector.
| Detector tilt | Photopeak energy window width | ||
|---|---|---|---|
| () | () | () | |
| 0 deg | 0.09 | 0.14 | 0.17 |
| 15 deg | 0.10 | 0.15 | 0.18 |
| 30 deg | 0.12 | 0.19 | 0.22 |
| 45 deg | 0.15 | 0.23 | 0.26 |
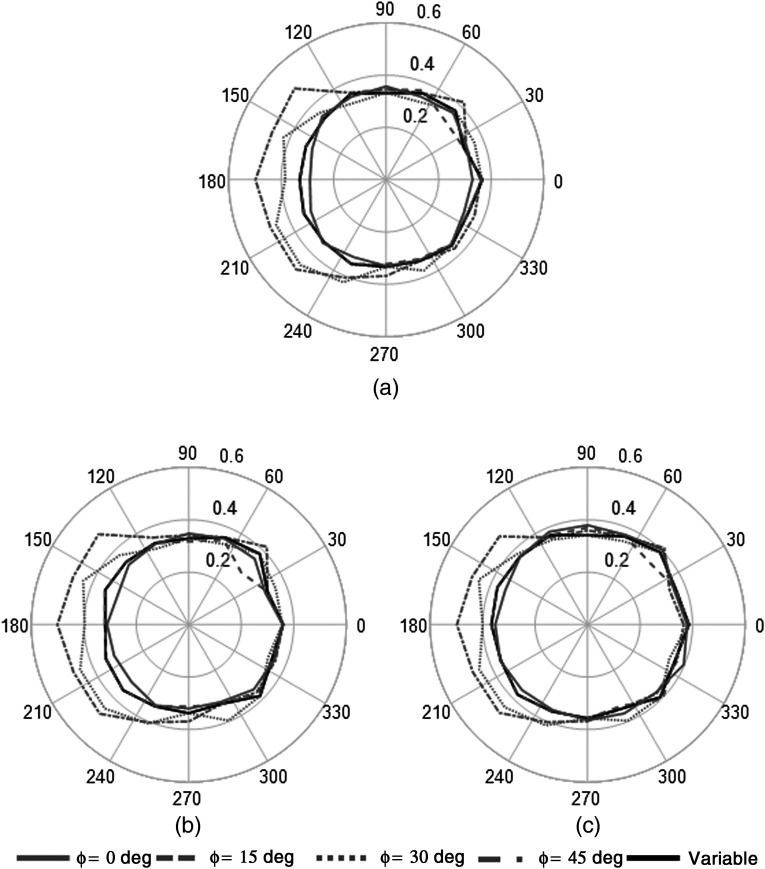
For application to the DEW method, the most important metric for the scatter distribution is the ratio of the scatter within the physically utilized photopeak () and abutting scatter () energy windows used in the real detector. To determine the impact on detector position on our DEW correction, the Monte Carlo data were processed to calculate the ratio of scatter in our typically used scatter and photopeak windows ( value). The value was calculated at each position for five simulated trajectories (Fig. 4): 0 deg, 15 deg, 30 deg, and 45 deg fixed tilt trajectories, as well as a variable tilt trajectory that minimizes direct views of the heart and liver,27 and is currently used in all clinical studies with our system.35 Figure 11 shows plots of the measured values at each detector position for the simulated trajectories. Table 3 gives the average value for each trajectory, as well the average value for projections with and without direct views of the heart and liver (with/without primary events detected from these organs).
Fig. 11.
Polar plots of measured value as a function of detector position. The value (radial component of the data) increased at detector positions with direct views of the heart and liver, which may impact the application of the DEW method using a single global value. Note the relatively constant value for the variable trajectory. (a) No lesion, (b) 1-cm lesion, (c) 4-cm lesion.
Table 3.
Average measured values from each simulated trajectory. Also provided are the mean values for projections with and without direct views of the heart and liver, regardless of detector position.
| Projections | No lesion | 1-cm lesion | 4-cm lesion |
|---|---|---|---|
| Variable |
|
|
|
| No heart/liver | |||
| With heart/liver |
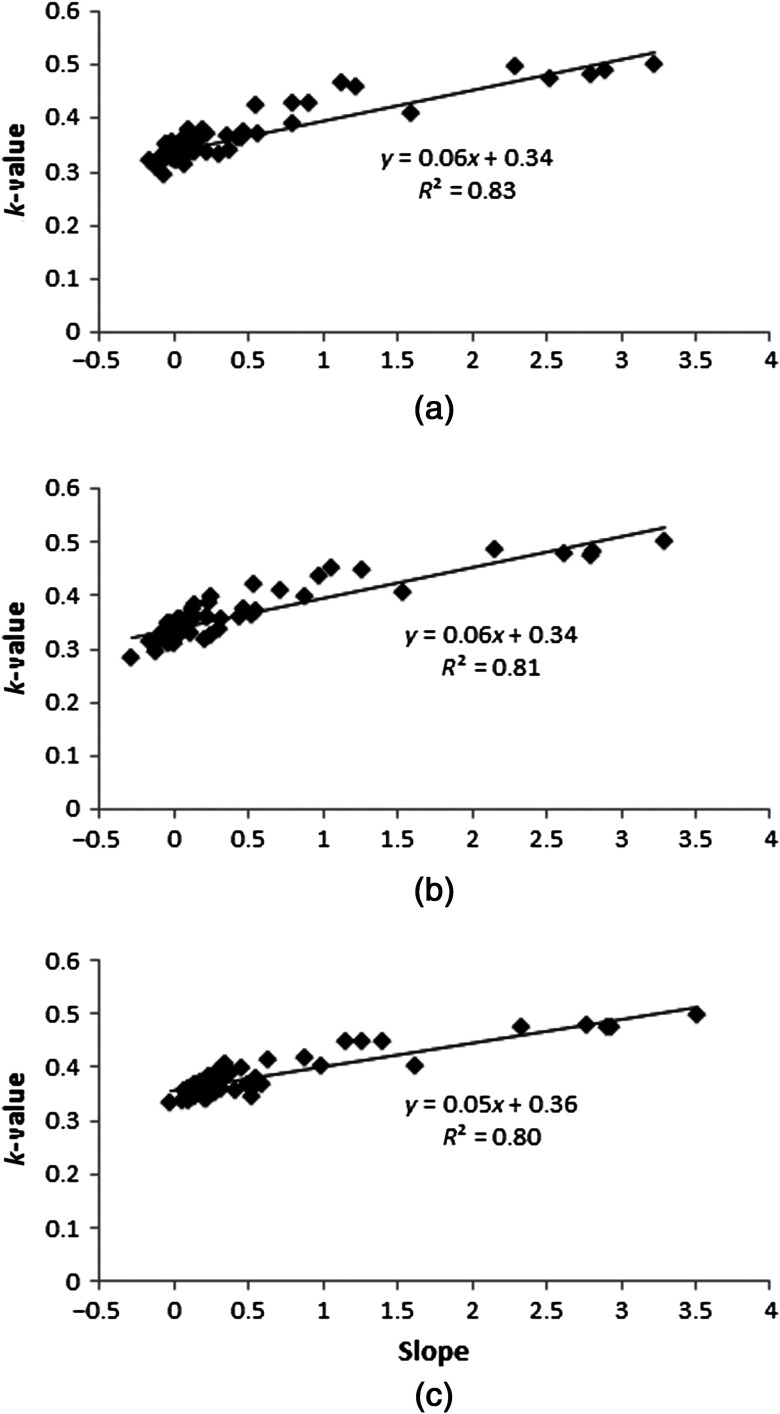
The data show that as long as the complete object being viewed is in the FOV for all projections (i.e., the 180-deg view contains nearly the same anatomy as the conjugate 0-deg view), a constant value can be used, whereas if the object contents of the FOV change due to the inclusion of views containing high-uptake organs, then the value can vary substantially (0.3 to 0.5) across projections within a single trajectory depending on the detector position. Furthermore, a strong correlation between the measured slope of the scatter distribution and the value is observed in both no-lesion and lesion simulations, with correlation coefficients of . Figure 12 shows parametric plots of the measured slope and values at every detector position across all trajectories.
Fig. 12.
Parametric plots of the measured values versus the slope of the scatter distribution for all projections showing the highly linear relationship between the two metrics. (a) No lesion, (b) 1-cm lesion, (c) 4-cm lesion.
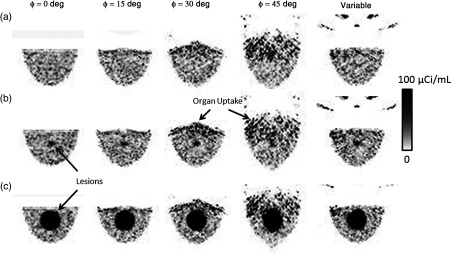
Last, the highly undersampled simulated projections were reconstructed to estimate the effects of changes in detected scatter distributions when using a single global value. Two sets of the five simulated trajectories were iteratively reconstructed using OSEM to five iterations with eight subsets on a grid with 2.5-mm isotropic voxels (Fig. 13). The first set projections utilized true primary events, representing the ground truth for the given trajectory and reconstruction parameters. The second set used projections created with the full energy window. The scatter within the projections was corrected using the DEW method with a fixed value of 0.33 (from Table 3 at ). A large VOI was centered within the no-lesion images in each reconstructed pair, and the percent difference in mean between regions of interest (ROI) measurements was determined. In the 1- and 4-cm lesion images, two VOIs were used for the same measurement: one within the lesion and one background measurement around the lesion. Results given in Table 4 show that regardless of trajectory, differences in the mean are relatively minor, with errors up to 5% compared to primary-only images in the lesion-free and/or 4-cm lesion measurements. Results are somewhat more variable for the 1-cm lesion, likely due to the smaller VOI and small number of projections used in the reconstruction.
Fig. 13.
Central sagittal slices from reconstructed images of each fixed-tilt trajectory and the variable tilt trajectory. (a) No lesion, (b) 1-cm lesion, (c) 4-cm lesion.
Table 4.
Comparison of volumes of interests from reconstructed images using various trajectories. Percent differences in the mean for each dual-energy window (DEW)-reconstructed dataset are determined relative to the primary-only reconstruction.
| % Difference in mean (DEW versus primary-only) | |||||
|---|---|---|---|---|---|
| Trajectory | No lesion | 1-cm lesion | 4-cm lesion | ||
| Background | Lesion | Background | Lesion | Background | |
| 0 deg | 1 | 0 | 4 | 0 | |
| 15 deg | 2 | 7 | 1 | 4 | 0 |
| 30 deg | 2 | 3 | 2 | 4 | 0 |
| 45 deg | 4 | 13 | 4 | 5 | 4 |
| Variable | 1 | 1 | 4 | 0 | |
4. Discussion
As seen in Fig. 7, results from the linear fits of the scatter distribution show an increase in slope of the scatter spectrum with detector tilt, especially for projections including the heart and liver within the FOV. Due to the forward-scattering bias of Compton events given 140-keV incident gamma rays, an increase of low angle, relatively high-energy scattered photons originating from the liver and heart are counted at extreme detector tilts. No significant differences in trends are seen with the inclusion of a 1- or 4-cm diameter lesion embedded in the breast. The asymmetry of the values from the fitted slope with various detector positions reveals the challenges with using nontraditional trajectories for quantification. An analogous situation might be where a traditional SPECT gamma camera uses a short focal length fan- or cone-beam collimator and has incomplete (truncated) projection views of a patient, such as in cardiac scanning.
The percent scatter plots (shown in Figs. 8–10) illustrate the primary source of the changes in detected scatter distributions for all views about the breast. With a traditional, simple circular orbit used in the fits, the breast dominates the total detected scatter within the 113- to 139-keV range. More than 75% of the detected scattered events originated from the breast itself (or breast and lesion) when the detector was positioned with 0-deg tilt to completely and only view the breast in all projections. Similar results have been shown for planar, compressed breast imaging modalities.9,10 However, at large polar tilts , certain azimuthal positions around the breast result in significant, even dominant, asymmetric contributions from the heart and liver. These significant contributions match with views having increased slope (Figs. 6 and 7), indicating that the primary causes of the change in scatter distributions are due to events originating from the liver and heart when included in the FOV. The addition of large, insufficiently sampled contributions from other organs at specific detector positions may impact the ability to employ the DEW method for quantification. More complete sampling, such as from other views that do not have confounding information or when the data out of the camera’s FOV is measured another way30 would aid in estimating those contributions.
Contamination of the typically used photopeak energy windows (, , and ) were measured by computing the fraction of scatter within the photopeak (Table 2). Average scatter fraction values ranged from to 0.26 depending on detector tilt and choice of photopeak energy window, which compares well with others’ Monte Carlo studies for compressed breast imaging.9 Larger scatter fraction values are observed for projections including the heart and liver, revealing the impact that these high-uptake source organs have in some tilted projections. Proper correction of these photopeak energy window measurements is necessary for maximizing quantification accuracy.
To that end, the value was calculated to determine if the observed changes in the scatter distribution may significantly affect application of the DEW method. The energy ranges for the photopeak window and scatter window (113 to 133 keV) were chosen to match those used on our clinical SPECT system. The ratio of scatter within these windows was calculated (Fig. 11). The results show that the value is largely unchanged, regardless of detector tilt and azimuthal position, except at positions including direct views of the heart and liver. With the heart and liver within the FOV, the large changes observed in the scatter distribution play a significant role in the value. The average value in projections excluding the heart and liver is 0.34, whereas the average value for the inclusive projections is 0.45. No significant differences are seen with the presence of a 1-cm and 4-cm centrally located breast lesion. A strong correlation is seen between the fitted slopes and the measured values (Fig. 12), indicating that a simple linear fit to the scatter region serves as a potential surrogate for estimating significant changes in the true value. This may allow for a projection-dependent value to be estimated directly from the energy spectra, improving scatter correction for studies involving large scatter fractions.
The large shift in the value reveals potential problems when using the DEW method when applied to nontraditional trajectories with projections including undesirable or intermittently viewed regions of high radiotracer uptake. Inclusion of projections with significantly different scatter distributions may yield a poor estimate of the scatter within the photopeak with a single value. To estimate the effects in reconstructions, the data from simulated trajectories (i.e., circular trajectories with a fixed tilt and one with variable-tilt) were reconstructed (Fig. 13). The reconstructions included: (1) primary-only projections as the reference for each trajectory and (2) primary + scatter projections that were then corrected with the DEW method using a fixed value determined from the average of projections excluding the heart and liver. Because of the known sampling insufficiencies of tilted trajectories, especially those with fixed tilt orbits, and the limited number of projections, the DEW-corrected reconstructions were compared only to the true primary reconstructions for the same trajectory. The percent differences between measured mean values were used to characterize effects of a single value for all trajectories. Results show that small inaccuracies of up to 5% are observed when applying a global value to all projections, regardless of the inclusion of other high-uptake organs. Utilization of a variable tilt trajectory that avoids direct views of the liver and heart minimizes changes in quantification using a global value. Thus, the variable trajectory both provides more object volume sampling and better quantification than large, fixed tilt trajectories when using a single value.
Generation of a variable tilt trajectory that avoids views of the heart and liver was previously implemented on the real breast SPECT system for patient imaging studies.35 This was accomplished using a “constrained” PROJSINE trajectory, which modifies the polar tilts used at positions that would otherwise view the heart or liver. The resulting variable trajectory of Fig. 4 is very similar to a constrained PROJSINE but one based on the motivation to use a constant value for accurate quantitative reconstruction, whereas initially the motivation for the constrained PROJSINE trajectory was to minimize the “washout” created in some reconstructed images due to the extremely high uptake of the heart and liver (easily seen in the projections, Fig. 5). The washout resulted in poorer visualization near the chest wall, potentially resulting in reduced sensitivity in lesion detection. Serendipitously, such a trajectory may also offer improved scatter correction using the DEW method, as quantitatively demonstrated in these studies. By avoiding direct projections of the heart and liver, a single value can be used with the DEW method for nontraditional trajectories with minimal impact on quantification. This constrained acquisition approach preserves more complete sampling in the VOI,33,34 minimizes out-of-FOV activity which can take up radiopharmaceutical, and with a single value yields quantitatively accurate SPECT images.
5. Conclusion
These Monte Carlo simulations illustrate the detailed effects of out-of-field radioactivity distributions, along with insufficiently sampled volume data resulting from asymmetric inclusion of high-uptake regions with nontraditional trajectories. Specific attention was paid to the detected energy spectral results and how they vary with vantage views of the asymmetrical object VOI (the pendant breast geometry). The simulation results highlight potential problems and one proposed constrained solution using the DEW scatter correction method with nontraditional acquisition trajectories. These acquisition limitations and advantages result in changes in the detected scatter distributions. Correction of the detected scatter from trajectories that incompletely include high-uptake regions outside the VOI using the DEW correction method may yield additional quantification inaccuracies. However, carefully planned trajectories that avoid nontarget high-uptake regions minimize quantification inaccuracies. Fitting of the scatter distribution within a limited upper-energy range showed strong dependence of the value on detector position. The value was shown to increase with detector tilt, with large increases for projections including the heart and liver. However, these significant changes in detected scatter distribution result in modestly reduced quantification accuracy in reconstructed images. Avoidance of direct projections of nontarget high uptake organs further minimizes differences in the scatter distributions, as verified by the detailed simulation results. For the DEW scatter correction method, this avoidance of direct projections allows for a single value to be used for scatter correction with maximum quantification accuracy. Such an approach using judiciously chosen vantages of the object VOI and a global value yields images without significant artifacts from out-of-field activity distributions and more quantitatively accurate reconstructed image volumes. Indeed, even in situations where high uptake organs are not easily avoided, a global value results in relatively minor quantification errors due to the low impact of scatter in pendant breast imaging. Thus, it is possible to use the DEW scatter correction method to take full advantage of the unique imaging capability of nontraditional trajectories with minimal deleterious effects on quantification accuracy and image noise. Additionally, the strong correlation observed between the measured slopes of the scattered energy spectra and values suggests that it may be possible to estimate the value for individual projections through spectral fitting, which may provide a better scatter correction with the DEW method when imaging high-scatter anatomy.
Acknowledgments
The authors would like to thank R. Unz of Mississippi State University for his assistance with debugging and running the MCNP5 simulations. This work was funded by the National Cancer Institute of the National Institutes of Health (Grant Nos. R01-CA096821 and T32-EB007185). M. P. T. is the inventor of this breast SPECT technology and is named as an inventor on the patent for this technology awarded to Duke (no. 7,609,808). If this technology becomes commercially successful, M. P. T. and Duke could benefit financially.
Biographies
Steve Mann is a radiation physicist at Duke University. He received his BS in physics from Mississippi State University in 2009 and earned his PhD in medical physics from Duke University in 2015. His graduate school research interests focused on dedicated breast SPECT-CT, with particular interest in the improved accuracy of absolute quantification of Tc-99m sestamibi uptake in breast tissue.
Martin Tornai is an associate professor of radiology and biomedical engineering and faculty member of the Medical Physics Graduate Program at Duke University. He has a BA in physics from Cornell and a PhD in biomedical physics from UCLA. His research interests include dedicated nuclear and x-ray based breast imaging devices, with which several dozen women have been scanned.
References
- 1.Mueller B., et al. , “Evaluation of a small cadmium zinc telluride detector for scintimammography,” J. Nucl. Med. 44(4), 602–609 (2003). [PubMed] [Google Scholar]
- 2.O’Connor M., et al. , “Molecular breast imaging: advantages and limitations of a scintimammographic technique in patients with small breast tumors,” Breast J. 13(1), 3–11 (2007). 10.1111/j.1524-4741.2006.00356.x [DOI] [PubMed] [Google Scholar]
- 3.O’Connor M., Rhodes D., Hruska C., “Molecular breast imaging,” Expert Rev. Anticancer Ther. 9(8), 1073–1080 (2009). 10.1586/era.09.75 [DOI] [PMC free article] [PubMed] [Google Scholar]
- 4.Khalkhali I., et al. , “Diagnostic accuracy of -sestamibi breast imaging: multicenter trial result,” J. Nucl. Med. 41(12), 1973–1979 (2000). [PubMed] [Google Scholar]
- 5.Rhodes D., et al. , “Molecular breast imaging: a new technique using technetium Tc 99m scintimammography to detect small tumors of the breast,” Mayo Clin. Proc. 80(1), 24–30 (2005). 10.1016/S0025-6196(11)62953-4 [DOI] [PubMed] [Google Scholar]
- 6.Mankoff D. A., et al. , “Monitoring the response of patients with locally advanced breast carcinoma to neoadjuvant chemotherapy using [technetium 99m]-sestamibi scintimammography,” Cancer 85(11), 2410–2423 (1999). [DOI] [PubMed] [Google Scholar]
- 7.Tiling R., et al. , “18F-FDG PET and 99mTc-sestamibi scintimammography for monitoring breast cancer response to neoadjuvant chemotherapy: a comparative study,” Euro. J. Nucl. Med. 28(6), 711–720 (2001). 10.1007/s002590100539 [DOI] [PubMed] [Google Scholar]
- 8.Hutton B., Buvat I., Beekman F., “Review and current status of SPECT scatter corrections,” Phys. Med. Bio. 56, R85–R112 (2011). 10.1088/0031-9155/56/14/R01 [DOI] [PubMed] [Google Scholar]
- 9.Hruska C., O’Connor M., “A Monte Carlo model for energy spectra analysis in dedicated nuclear breast imaging,” IEEE Trans. Nucl. Sci. 55(1), 491–500 (2008). 10.1109/TNS.2007.910882 [DOI] [Google Scholar]
- 10.Williams M., et al. , “Analysis of position-dependent Compton scatter in scintimammography with mild compression,” in IEEE Nuclear Science Symposium Conf. Record, pp. 863–867 (2002). [Google Scholar]
- 11.Brzymialkiewicz C., et al. , “Evaluation of fully 3-D emission mammotomography with a compact cadmium zinc telluride detector,” IEEE Trans. Med. Imaging 24(7), 868–877 (2005). 10.1109/TMI.2005.852501 [DOI] [PMC free article] [PubMed] [Google Scholar]
- 12.Archer C., et al. , “Implementation and initial characterization of acquisition orbits with a dedicated emission mammotomograph,” IEEE Trans. Nucl. Sci. 50(3), 413–420 (2003). 10.1109/TNS.2003.812433 [DOI] [Google Scholar]
- 13.Tornai M., et al. , “A 3D gantry single photon emission tomograph with hemispherical coverage for dedicated breast imaging,” Nucl. Instrum. Methods Phys. Res. A 497(1), 157–167 (2003). 10.1016/S0168-9002(02)01906-X [DOI] [Google Scholar]
- 14.Singh M., Mumcuoglu E., “Design of a CZT based breast SPECT system,” IEEE Trans. Nucl. Sci. 45(3), 1158–1165 (1998). 10.1109/23.681995 [DOI] [Google Scholar]
- 15.Li-Wei W., et al. , “Geometric calibration for a SPECT system dedicated to breast imaging,” Chin. Phys. C 36(10), 1019–1024 (2012). 10.1088/1674-1137/36/10/019 [DOI] [Google Scholar]
- 16.Tenney C., Liang C., DiPirro J., “Slit-slat collimators in a staggered array for dedicated breast SPECT,” Med. Phys. 38, 3438 (2011). 10.1118/1.3611756 [DOI] [Google Scholar]
- 17.Yan S., et al. , “On-board robotic multi-pinhole SPECT system for prone breast imaging,” Med. Phys. 40, 106 (2013). 10.1118/1.4814023 [DOI] [Google Scholar]
- 18.Gopan O., et al. , “Molecular imaging of the breast using a variable-angle slant-hole collimator,” IEEE Trans. Nucl. Sci. 61(3), 1143–1152 (2014). 10.1109/TNS.2014.2322520 [DOI] [Google Scholar]
- 19.Buvat I., et al. , “Comparative assessment of nine scatter correction methods based on spectral analysis using Monte Carlo simulations,” J. Nucl. Med. 36(8), 1476–1488 (1995). [PubMed] [Google Scholar]
- 20.Ljungberg M., Msaki P., Strand S.-E., “Comparison of dual-window and convolution scatter correction techniques using the Monte Carlo method,” Phys. Med. Bio. 35(8), 1099–1110 (1990). 10.1088/0031-9155/35/8/006 [DOI] [Google Scholar]
- 21.Jaszczak R., et al. , “Improved SPECT quantification using compensation for scattered photons,” J. Nucl. Med. 25(8), 893–900 (1984). [PubMed] [Google Scholar]
- 22.Harris C., et al. , “Tc-99m attenuation coefficients in water-filled phantoms determined with gamma cameras,” Med. Phys. 11(5), 681–685 (1984). 10.1118/1.595623 [DOI] [PubMed] [Google Scholar]
- 23.King M., Hademenos G., Glick S., “A dual-photopeak window method for scatter correction,” J. Nucl. Med. 33(4), 605–612 (1992). [PubMed] [Google Scholar]
- 24.Mann S., Perez K., Tornai M., “Comparison of dual-window scatter correction and effective attenuation coefficients for quantification in dedicated breast SPECT,” in IEEE Nuclear Science Symposium. Conf. Record, pp. 3760–3763 (2011). [Google Scholar]
- 25.Mann S. D., Tornai M. P., “Initial evaluation of a modified dual-energy window scatter correction method for CZT-based gamma cameras for breast SPECT,” Proc. SPIE 9413, 94132X (2015). 10.1117/12.2082195 [DOI] [Google Scholar]
- 26.Cherry S. R., Sorenson J. A., Phelps M. E., Physics in Nuclear Medicine, 3rd ed., Elsevier Health Sciences, Philadelphia: (2003). [Google Scholar]
- 27.Perez K., et al. , “Characterizing the contribution of cardiac and hepatic uptake in dedicated breast SPECT using tilted trajectories,” Phys. Med. Bio. 55, 4721–4734 (2010). 10.1088/0031-9155/55/16/007 [DOI] [PMC free article] [PubMed] [Google Scholar]
- 28.McConn R., Jr., et al. , Compendium of Material Composition Data for Radiation Transport Modeling, Technical Report 15870, Rev. 1, Pacific Northwest National Laboratory, Richland, Washington. [Google Scholar]
- 29.Cutler S., Crotty D., Tornai M., “Dynamic laser-guided contouring for dedicated emission mammotomography,” in IEEE Nuclear Science Symposium Conf. Record, pp. 4789–4793 (2008). [Google Scholar]
- 30.Metzler S., et al. , “SPECT breast imaging combining horizontal and vertical axes of rotation,” IEEE Trans. Nucl. Sci. 49(1), 31–36 (2002). 10.1109/TNS.2002.998677 [DOI] [Google Scholar]
- 31.Baird W., et al. , “Evaluation of rotating slant-hole SPECT mammography using Monte Carlo simulation methods,” IEEE Trans. Nucl. Sci. 50(1), 105–109 (2003). 10.1109/TNS.2002.807913 [DOI] [Google Scholar]
- 32.Jingyan X., et al. , “Quantitative rotating multisegment slant-hole SPECT mammography with attenuation and collimator-detector response compensation,” IEEE Trans. Med. Imaging 26(7), 906–916 (2007). 10.1109/TMI.2007.895480 [DOI] [PubMed] [Google Scholar]
- 33.Metzler S. D., Bowsher J. E., Jaszczak R. J., “Geometrical similarities of the Orlov and Tuy sampling criteria and a numerical algorithm for assessing sampling completeness,” in IEEE Conf. Record Nuclear Science Symposium/Medical Imaging Conf., pp. 1241–1245 (2002). [Google Scholar]
- 34.Archer C. N., et al. , “Implementation and initial characterization of acquisition orbits with a dedicated emission mammotomograph,” IEEE Trans. Nucl. Sci. 50(3), 413–420 (2003). 10.1109/TNS.2003.812433 [DOI] [Google Scholar]
- 35.Mann S., et al. , “Initial in vivo quantification of Tc-99m sestamibi uptake as a function of tissue type in healthy breasts using dedicated breast SPECT-CT,” J. Oncol. 2012, 146943 (2012). 10.1155/2012/146943 [DOI] [PMC free article] [PubMed] [Google Scholar]


