Abstract.
This paper presents an imaging-genomic pipeline to derive three-dimensional intra-tumor heterogeneity features from contrast-enhanced CT images and correlates them with gene mutation status. The pipeline has been demonstrated using CT scans of patients with clear cell renal cell carcinoma (ccRCC) from The Cancer Genome Atlas. About 15% of ccRCC cases reported have BRCA1-associated protein 1 (BAP1) gene alterations that are associated with high tumor grade and poor prognosis. We hypothesized that BAP1 mutation status can be detected using computationally derived image features. The molecular data pertaining to gene mutation status were obtained from the cBioPortal. Correlation of the image features with gene mutation status was assessed using the Mann-Whitney-Wilcoxon rank-sum test. We also used the random forests classifier in the Waikato Environment for Knowledge Analysis software to assess the predictive ability of the computationally derived image features to discriminate cases with BAP1 mutations for ccRCC. Receiver operating characteristics were obtained using a leave-one-out-cross-validation procedure. Our results show that our model can predict BAP1 mutation status with a high degree of sensitivity and specificity. This framework demonstrates a methodology for noninvasive disease biomarker detection from contrast-enhanced CT images.
Keywords: imaging-genomics, radiomics, image texture classification, renal cell carcinoma
1. Introduction
Computationally derived texture features from user-defined regions of interest on CT images have been described and shown to be associated with survival and various tumor characteristics such as hypoxia, altered metabolism, and angiogenesis in patients with nonsmall cell lung cancer, esophageal cancer, metastatic renal cell carcinoma (RCC), and, more recently, squamous cell carcinoma of the head and neck.1–5 Computational features are robust and completely eliminate the subjectivity of inter- and intra-observer variance. Image features derived by subjective assessment of tumor appearances in patients with RCC on contrast enhanced CT have been correlated with genetic mutations in recent work by Karlo et al.6 Similar studies have been performed in patients with lung cancer,7 breast cancer,8 and glioblastoma multiforme.9 Although these approaches provide novel noninvasive molecular surrogate biomarkers, which are potentially useful for treatment planning, the scalability of these approaches involving multiple readers from multiple institutions is challenging due to the subjectivity of observer assessments.10,11 Hence, it is important to investigate alternative noninvasive molecular biomarkers, such as computationally derived intra-tumor heterogeneity features, which are robust, scalable, and independent of subjective variability. In this paper, we present a framework for computationally deriving three-dimensional intra-tumor heterogeneity features from diagnostic CT scans and correlating them with gene mutation status. We demonstrate our methodology on images acquired from patients with clear cell renal cell carcinoma (ccRCC) from the Cancer Genome Atlas (TCGA).
1.1. Renal Cell Carcinoma
RCC is the most common carcinoma of the kidneys in adults.12 ccRCC is considered a distinct subtype of RCC, predominantly caused by a mutation of the Von Hippel-Lindau (VHL) tumor suppressor gene in the short arm of chromosome 3. More recently, several other genes have been associated with the advanced form of the disease using whole-genome sequencing of clear cell carcinoma by TCGA.13,14 One such gene is the BRCA1-associated protein 1 (BAP1) gene, which is located close to the VHL gene in the short arm of chromosome 3. Recent whole-exome sequencing studies of ccRCC have reported that BAP1 alterations are present in of ccRCC cases.12 The deletion or mutation of BAP1 is associated with high tumor grade and poorer prognosis.15–18 Following prior investigations for image-based inference of gene mutation status in glioblastoma multiforme brain tumors, lung, and breast tumors, we sought to investigate if BAP1 mutation status can be detected based on computationally derived volumetric and textural image features of the primary tumor from contrast enhanced renal CT scans of these patients. In this paper, we present an imaging-genomic pipeline to extract three-dimensional image features and correlate them with molecular data associated with the disease. The paper is organized as follows: We first describe the feature extraction pipeline to extract three-dimensional tumor heterogeneity features and the classifier to predict gene mutation status from the computationally derived features. We then demonstrate the pipeline on CT scans obtained from a cohort of 78 ccRCC patients with corresponding BAP1 mutation information. We then present the prediction results from our methodology for inference of BAP1 mutation status based on image-derived features. The Discussion section describes the significance of the features extracted using the pipeline and how the current work relates to larger studies in imaging-genomics that provide noninvasive imaging biomarkers for gene mutations and cancer-specific outcomes.
2. Materials and Methods
2.1. Data
The study was performed retrospectively from data obtained from a cohort of 78 patients with ccRCC from TCGA. Diagnostic pretreatment CT scans for these patients were obtained from The Cancer Imaging Archive and the molecular data pertaining to the gene mutations were derived from the cBioPortal.19 We identified 14 patients in this cohort who had BAP1 mutations. The remaining cases (BAP1wt) in the group served as controls. The CT scans were acquired from the noncontrast (nc) phase (before the contrast agent was administered), and the three phases of a standard renal protocol: cortico-medullary (cm), nephrographic (neph), and excretory (ex) phases corresponding to phases of contrast washout through the kidneys. However, the ccRCC patients do not have scans from all the renal phases because the contrast washout rate varies across patients. The variability in contrast washout results in variability of tumor heterogeneity features across renal phases, therefore, BAP1 classification was performed for each renal phase separately. The distribution of cases per renal phase is shown in Table 1.
Table 1.
Distribution of BRCA1-associated protein 1 patients according to renal phases.
| Phase | BAP-mutant | Normal | Total |
|---|---|---|---|
| Noncontrast | 13 | 51 | 64 |
| Cortico-medullary | 8 | 35 | 43 |
| Nephrographic | 9 | 31 | 40 |
| Excretory | 8 | 36 | 44 |
2.2. Method
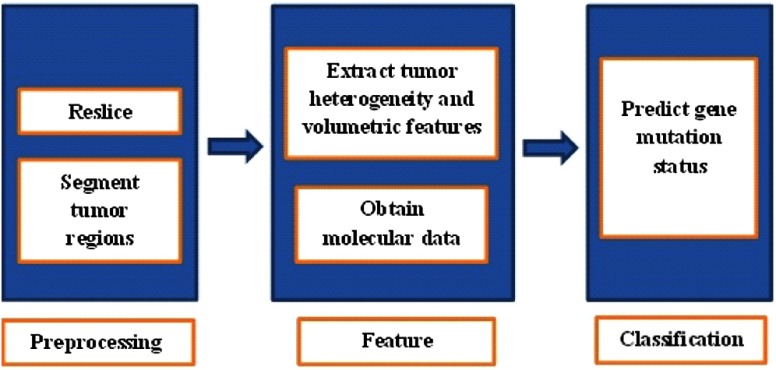
Our imaging-genomic pipeline consists of three main stages: image preprocessing, feature extraction, and classification. The preprocessing stage consists of image reslicing and segmentation of tumor regions, followed by image feature computation. The classification stage consists of feature selection and modeling to correlate the extracted features with molecular information (BAP1 mutation status). Figure 1 shows a schematic diagram of the pipeline used to derive the three-dimensional (3-D) texture and volumetric features from the primary tumor region.
Fig. 1.
Schematic diagram of the imaging-genomics pipeline.
2.2.1. Preprocessing
The contrast enhanced CT (CECT) scans were preprocessed to obtain 3-D tumor volumes by image reslicing to obtain isotropic pixel sizes, followed by semiautomated segmentation to determine the tumor boundaries. The 3-D CECT scans were resliced to 1 mm width along each dimension using the NIFTI toolbox in MATLAB®20 so that subsequent 3-D image filtering could be performed using uniform filter sizes along the three dimensions. A fellowship trained, board certified radiologist with special interest in uroradiology (R.V.) manually segmented the primary tumor in 3-D using the open-source Medical Image Interaction Tool Kit.21 MITK contains features for slice-by-slice contour drawing and correction, 3-D interpolation of tumor outlines, and surface creation by marching cubes. Since we hypothesized that tumor heterogeneity features were affected by gene mutation status, we derived image features from pixels within the segmented tumor regions only.
2.2.2. Feature extraction
CECT scans contain large-scale features such as necrosis and hemorrhage, as well as pleomorphic nuclei and cells at a smaller scale. In order to quantitatively characterize these heterogeneity features of the tumor regions, we extracted both 3-D intra-tumor textural features and volumetric measures from these scans. Multiscale textural features were computed using 3-D image filters and transforms and statistical summary measures as discussed below.
Image filters and transforms
We filtered the CT scans with various spatial filters (as listed in Table 2) at five different scales () to obtain fine, medium, and coarse features from the tumor region. Table 2 lists the 3-D filters incorporated in our pipeline. 3-D textural features were obtained by filtering the images with spatial filters such as Laws’ textural filters, Laplacian of Gaussian (LoG) and Gaussian filters, wavelet transforms (symmetrical, Haar, Daubechies), and Gabor filters using MATLAB® scripts. The LoG and Gaussian filters derive edge-like features from the local intensity variations in images. The Laws’ filters enhance pixel patterns such as level, edge, wave, spot, ripples, and their combinations, and can characterize more complex textural features than edges.22 Multiscale features were obtained by modifying the filter widths used to compute the features. Fine-scale features were obtained using filter widths of 0.2 and 0.4 mm, medium-scale features from 1.5 and 2.5 mm filter widths, while coarse features were obtained using 5 mm filter widths. We derived a total of 360 different 3-D filter responses as listed in Table 2.
Table 2.
Summary of three-dimensional transforms computed from the contrast enhanced CT (CECT) images.
| Three-dimensional filters and transforms | Number of filters |
|---|---|
| Laplacian of Gaussian filter | |
| Gaussian filter | |
| Three-dimensional Laws’ texture filters | |
| Three dimensional Haar wavelet transform | Three-level decomposition = 18 filters |
| Three dimensional Daubechies wavelet transform | Three-level decomposition = 18 filters |
| Three dimensional symmetrical wavelet transform | Three-level decomposition = 18 filters |
| Three dimensional Gabor filters | 144 filters |
| Total | 360 filters |
Statistical summary measures
Two types of summary measures were computed from the 3-D filtered images and original scans: summary measures based on the image histogram and Haralick texture features. Image histogram-based summary measures extracted were the mean intensity of the image [Eq. (1)], and entropy and uniformity [Eqs. (2) and (3)] of the intensity distributions of the original and filtered images.23 Here, are the number of histogram bins and is the probability of occurrence of the ’th gray level in the tumor volume within the image . Mean gray-level intensity () is the average pixel intensity value of the tumor region.
| (1) |
The histogram features measure the global properties of an image. Large histogram bin widths characterize coarse image information, while smaller bin widths quantify the image details. For our analysis, we used eight histogram bins to derive coarse-level image statistics from images. The histogram entropy () is a measure of uncertainty of the gray levels in the image, thereby characterizing gray levels that represent image regions such as homogeneous patches versus noise.
| (2) |
The histogram uniformity () measures intensity variations in an image region.
| (3) |
Haralick texture features were computed from 3-D gray-level co-occurrence matrices (GLCM) of the original and filtered images using the code by Philips et al.24 GLCMs compute quantitative measures of image patterns at specified distances and angles using the spatial distribution of pixels. We used 16 gray levels, four distance values (of 1, 2, 4, and 8 pixels), and four orthonormal directions to compute 13 different second-order Haralick texture features as shown in Table 3.25,26 The features were averaged over multiple directions to obtain a total of 572 rotation-invariant textural features (summing the features derived from the original and filtered images) for each image. Volumetric features of the 3-D tumor region were derived using the regionprops function in MATLAB®.
Table 3.
Thirteen second-order Haralick features computed from the gray-level co-occurrence matrix of original and filtered CECT images.
| Haralick features | |
|---|---|
| Angular second moment | Sum entropy |
| Contrast | Inertia |
| Correlation | Entropy |
| Sum of squares variance | Difference entropy |
| Local homogeneity or inverse difference moment | Cluster prominence |
| Sum average | Cluster shade |
| Variance | |
2.2.3. Feature normalization
The computed features were normalized across different scales using two kinds of ratios:
-
1.
Ratios of textural features computed at different spatial scales to the features obtained from the original image were computed. These are referred to as ratio type 1 features.
-
2.
Ratios of textural features computed at coarser scales to the finest spatial scale () were computed. These are referred to as ratio type 2 features.
2.3. Classification
2.3.1. Univariate analysis
To assess the predictive accuracy of image features associated with image features, we performed a univariate area under the curve (AUC) analysis to determine the association of each feature with the BAP1 mutation status. The values obtained using the Mann-Whitney-Wilcoxon tests are reported here. Multiple testing corrections for values were performed using Benjamini-Hochberg procedure for controlling false discovery rate on 4037 nephrographic features correction27 using the p.adjust function in R, for finding image features associated with BAP1 status.
2.3.2. Multivariate analysis
We used the coefficient of variation (CV) criterion,28 , to reduce the dimension of the feature set before performing multivariate classification. A random forest (RF) classifier was trained in the Waikato Environment for Knowledge Analysis (WEKA) software29 to predict the BAP1 mutation status with the subset of image-derived features. The RF classifier uses an ensemble approach to predict values by aggregating (bagging) the outcomes of several classification trees. The RF ensemble consisted of 1000 trees, each constructed with a random subset of features. An external cross-validation was performed using the filtered classifier of WEKA and features were selected within each cross-validation fold using the attribute selection filter. The attribute selection filter used CfsSubsetEval as the evaluator function and particle swarm optimization search algorithm with a population size of 1000.30 This ensured that the test data were separate from the training data used to build the model in each fold. We report prediction performance using leave-one-out-cross-validation for each renal phase separately.
3. Results
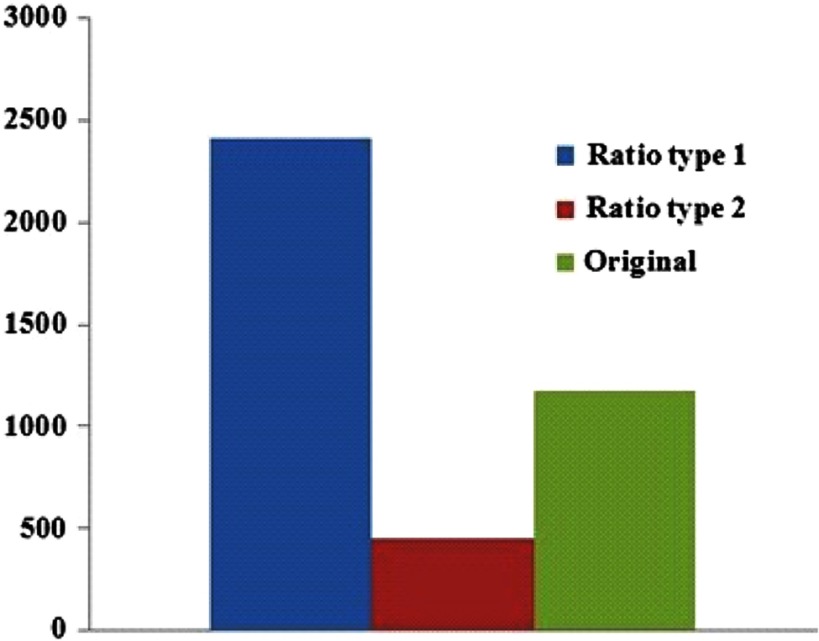
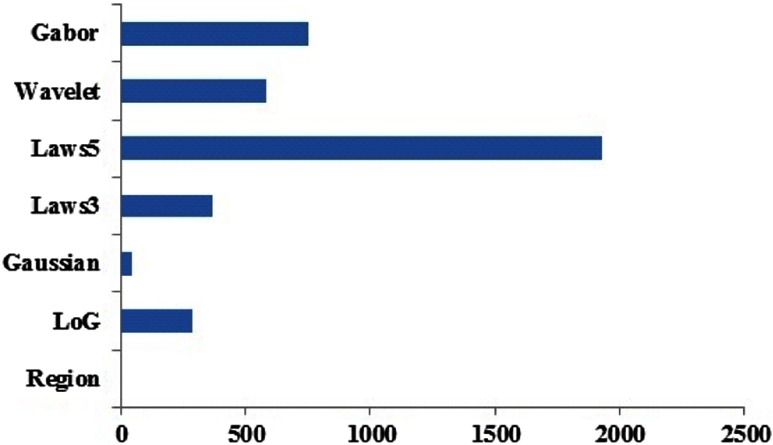
Combining the textural, volumetric, and ratio features from all the 78 cases, we derived a total of 73,684 features for each phase of the renal CT scan (nc, cm, neph, and ex). The AUC analysis followed by multiple testing corrections produced adjusted values for all computed features and indicated the association of each feature with the BAP1 mutation status. The best adjusted values corresponded to a subset of 4037 nephrographic features that were significantly predictive of BAP1 mutation status. No significant features with adjusted were obtained from other phases of renal CT scans. Figure 2 shows the distribution of the 4037 nephrographic features that were associated with BAP1 mutations in each category: original, ratio type 1, or ratio type 2. Greater numbers of ratio type 1 normalized ratio features were found to be associated with mutation status than ratio type 2 normalized features or original features. Figure 3 shows the distribution of the 4037 nephrographic features according to feature class. The Laws’ filters were found to be most abundant among the significant features found using univariate analysis.
Fig. 2.
The distribution of the 4037 nephrographic features associated with BRCA1-associated protein 1 (BAP1) mutations in each category: original, ratio type 1, or ratio type 2.
Fig. 3.
The distribution of the 4037 nephrographic features associated with BAP1 mutations according to feature type.
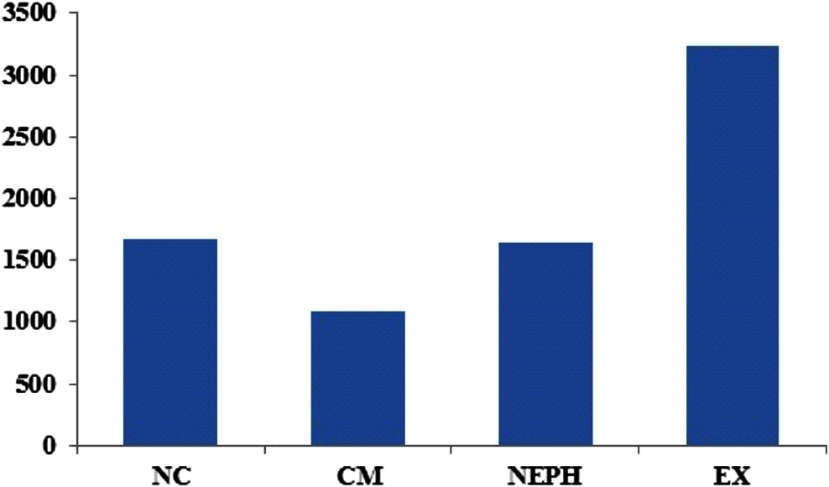
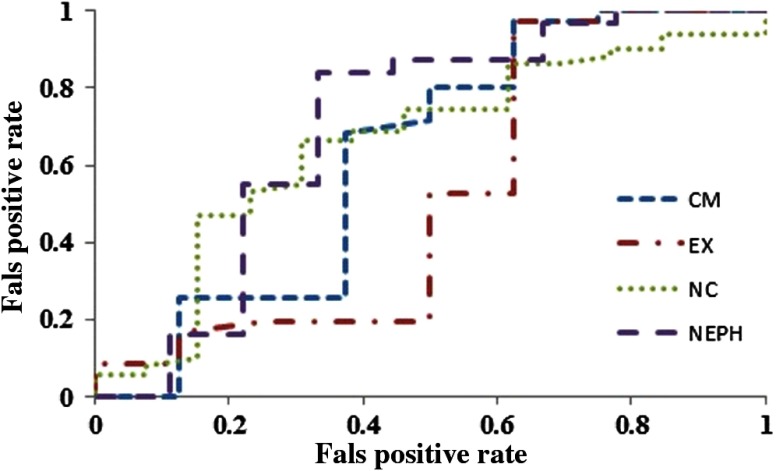
The CV criterion reduced the dimensionality of the feature set to 1677 (nc), 1080 (cm), 1636 (neph), and 3235 (ex) features before multivariate classification was performed (shown in Fig. 4). The RF classifier trained to predict the gene mutation status from 3-D texture features obtained AUC values of 0.66 (nc), 0.62 (cm), 0.71 (neph), and 0.52 (ex), respectively, for BAP1 mutation as shown in Fig. 5.
Fig. 4.
Number of features derived from each renal phase with coefficient of variation .
Fig. 5.
Area under the curves from the random forest classifier derived for different phases of renal CT.
4. Discussion
We showed that computationally derived 3-D features from CT scans can be associated with molecular information obtained from patients by demonstrating the application of our pipeline on ccRCC images. These features were derived from standard diagnostic CECT scans, which suggest that the image processing pipeline presented here can be broadly used as a noninvasive biomarker for testing associations between diagnostic scans and gene mutations.
We observed that ratio features were more discriminative than original features for discriminating genetic mutations. This is concordant with the approach and observations in prior studies.1,2 We also observed that features derived from the Laws’ filter were more strongly associated with BAP1 mutations. The Laws’ filters enhance pixel patterns such as level, edge, wave, spot, ripples, and their combinations, and, therefore, are able to characterize complex textural features. Thus, subtle complex textural features on diagnostic scans were found to be associated with gene mutation status.
We also observed that nephrographic study had the highest predictive potential when compared to noncontrast or other contrast enhanced phases of the study. This is concordant with the notion that the nephrographic phase is considered the most sensitive phase for visual assessment by radiologists for abnormal contrast enhancement for detection of renal masses. The relatively poor AUC using the excretory phase may likely be due to differences in acquisition timing in various institutes.
There are a few limitations to this study as in several other retrospective studies. The molecular data were obtained from analyses on a small sample of tissue taken at the time of surgery, which can be subject to intra-tumor genetic variations as shown by a variety of tumors including ccRCC.31 Second, as this is a discovery-phase study, validation of these image-derived features needs to be performed on other cohorts.32 Third, the imaging data were derived from multiple institutions with potential differences in scanning, acquisition, and data processing. Another source of bias is the volume of contrast used, which may lead to significant variations in the degree of enhancement of the tumors. Replicating this study in a single institution with uniform imaging parameters may be needed in further validation studies.
In the future, the study would be extended to find radiomic associations of ccRCC with other gene mutations such as VHL and polybromo (PBRM). Somatic inactivation of the VHL gene is the most frequent genetic event observed in ccRCC and is seen in 60 to 90% of patients with this cancer. It has been found that the presence of an inactivating VHL mutation may be associated with better survival in patients with early stage disease, but the same does not hold true in stage IV ccRCC.33 While BAP1 mutated tumors are associated with poorer clinical outcomes, exclusively PBRM1 mutated tumors have been found to have a favorable outcome. PBRM1 activity regulates pathways associated with chromosomal instability and cellular proliferation. PBRM1 was found to be associated with major prognostic factors in renal cancer and was also associated with tumor recurrence and tumor-related death.34 Characterization of gene expression and downstream pathways associated with these mutations may facilitate future targeted drug development.
5. Conclusions
Our study shows that CT texture analysis and summary measures on pretherapy baseline images are predictive of BAP1 mutation status in patients with ccRCC. These measures were derived from standard diagnostic CECT scans, which suggest that such image-derived techniques as we describe can be replicated easily with minimal additional cost and have potential applicability for widespread use as noninvasive biomarkers for other diseases.
Acknowledgments
This research work was supported by Institutional Startup funds from the UT MD Anderson Cancer Center (to A.R.) and the NIH/NCI Cancer Center Support Grant–Bioinformatics Shared Resource (NCI P30 CA016672).
Biographies
Payel Ghosh is a research scientist in the Department of Diagnostic Radiology at the University of Texas MD Anderson Cancer Center, prior to which she was a postdoctoral fellow in the Department of Bioinformatics and Computational Biology. Her research interests are medical informatics, image processing, and machine learning.
Pheroze Tamboli is a professor in the Section of Genitourinary Pathology in the Department of Pathology at the University of Texas MD Anderson Cancer Center. Pathology of renal cell carcinoma and other renal tumors are his area of expertise and main research interest. As a disease site expert, he is also a member of the Analysis Working Group for all the renal cell carcinomas evaluated by The Cancer Genome Atlas (TCGA) project.
Raghu Vikram is an associate professor of radiology in abdominal imaging at University of Texas MD Anderson Cancer center. His areas of interest include imaging of abdominal and pelvic malignancies with special emphasis on genito-urinary malignancies, and identification of imaging surrogates of genetic aberrations in malignancies. He has published more than 50 peer-reviewed articles, 4 book chapters, and more than 75 abstracts.
Arvind Rao is an assistant professor in the Department of Bioinformatics and Computational Biology at the University of Texas MD Anderson Cancer Center. He obtained his PhD from the University of Michigan, Ann Arbor. His work focuses on building decision algorithms that integrate imaging and genetics data in the context of cancer prognosis and treatment.
References
- 1.Ganeshan B., et al. , “Non-small cell lung cancer: histopathologic correlates for texture parameters at CT,” Radiology 266(1), 326–336 (2013). 10.1148/radiol.12112428 [DOI] [PubMed] [Google Scholar]
- 2.Ganeshan B., et al. , “Tumour heterogeneity in non-small cell lung carcinoma assessed by CT texture analysis: a potential marker of survival,” Eur. Radiol. 22(4), 796–802 (2012). 10.1007/s00330-011-2319-8 [DOI] [PubMed] [Google Scholar]
- 3.Ganeshan B., et al. , “Tumour heterogeneity in oesophageal cancer assessed by CT texture analysis: preliminary evidence of an association with tumour metabolism, stage, and survival,” Clin. Radiol. 67(2), 157–164 (2012). 10.1016/j.crad.2011.08.012 [DOI] [PubMed] [Google Scholar]
- 4.Goh V., et al. , “Assessment of response to tyrosine kinase inhibitors in metastatic renal cell cancer: CT texture as a predictive biomarker,” Radiology 261(1), 165–171 (2011). 10.1148/radiol.11110264 [DOI] [PubMed] [Google Scholar]
- 5.Zhang H., et al. , “Locally advanced squamous cell carcinoma of the head and neck: CT texture and histogram analysis allow independent prediction of overall survival in patients treated with induction chemotherapy,” Radiology 269(3), 801–809 (2013). 10.1148/radiol.13130110 [DOI] [PubMed] [Google Scholar]
- 6.Karlo C. A., et al. , “Radiogenomics of clear cell renal cell carcinoma: associations between CT imaging features and mutations,” Radiology 270(2), 464–471 (2014). 10.1148/radiol.13130663 [DOI] [PMC free article] [PubMed] [Google Scholar]
- 7.Gevaert O., et al. , “Non-small cell lung cancer: identifying prognostic imaging biomarkers by leveraging public gene expression microarray data—methods and preliminary results,” Radiology 264(2), 387–396 (2012). 10.1148/radiol.12111607 [DOI] [PMC free article] [PubMed] [Google Scholar]
- 8.Yamamoto S., et al. , “Radiogenomic analysis of breast cancer using MRI: a preliminary study to define the landscape,” AJR Am. J. Roentgenol. 199(3), 654–663 (2012). 10.2214/AJR.11.7824 [DOI] [PubMed] [Google Scholar]
- 9.Zinn P. O., et al. , “Radiogenomic mapping of edema/cellular invasion MRI-phenotypes in glioblastoma multiforme,” PLoS One 6(10), e25451 (2011). 10.1371/journal.pone.0025451 [DOI] [PMC free article] [PubMed] [Google Scholar]
- 10.Jaffe C. C., “Imaging and genomics: is there a synergy?,” Radiology 264(2), 329–331 (2012). 10.1148/radiol.12120871 [DOI] [PubMed] [Google Scholar]
- 11.Rutman A. M., Kuo M. D., “Radiogenomics: creating a link between molecular diagnostics and diagnostic imaging,” Eur. J. Radiol. 70(2), 232–241 (2009). 10.1016/j.ejrad.2009.01.050 [DOI] [PubMed] [Google Scholar]
- 12.Siegel R., et al. , “Cancer statistics, 2014,” CA: Cancer J. Clin. 64(1), 9–29 (2014). 10.3322/caac.21208 [DOI] [PubMed] [Google Scholar]
- 13.Cancer Genome Atlas Research, “Comprehensive molecular characterization of clear cell renal cell carcinoma,” Nature 499(7456), 43–49 (2013). 10.1038/nature12222 [DOI] [PMC free article] [PubMed] [Google Scholar]
- 14.Ricketts C. J., Hill V. K., Linehan W. M., “Tumor-specific hypermethylation of epigenetic biomarkers, including SFRP1, predicts for poorer survival in patients from the TCGA kidney renal clear cell carcinoma (KIRC) project,” PLoS One 9(1), e85621 (2014). 10.1371/journal.pone.0085621 [DOI] [PMC free article] [PubMed] [Google Scholar]
- 15.Joseph R. W., et al. , “Loss of BAP1 protein expression is an independent marker of poor prognosis in patients with low-risk clear cell renal cell carcinoma,” Cancer 120(11), 1752–1753 (2014). 10.1002/cncr.28615 [DOI] [PMC free article] [PubMed] [Google Scholar]
- 16.Gossage L., et al. , “Clinical and pathological impact of VHL, PBRM1, BAP1, SETD2, KDM6A, and JARID1c in clear cell renal cell carcinoma,” Genes Chromosomes Cancer 53(1), 38–51 (2014). 10.1002/gcc.22116 [DOI] [PubMed] [Google Scholar]
- 17.Kapur P., et al. , “Effects on survival of BAP1 and PBRM1 mutations in sporadic clear-cell renal-cell carcinoma: a retrospective analysis with independent validation,” Lancet Oncol. 14(2), 159–167 (2013). 10.1016/S1470-2045(12)70584-3 [DOI] [PMC free article] [PubMed] [Google Scholar]
- 18.Pena-Llopis S., et al. , “BAP1 loss defines a new class of renal cell carcinoma,” Nat. Genet. 44(7), 751–759 (2012). 10.1038/ng.2323 [DOI] [PMC free article] [PubMed] [Google Scholar]
- 19.Gao J., et al. , “Integrative analysis of complex cancer genomics and clinical profiles using the cBioPortal,” Sci. Signal 6(269), pl1 (2013). 10.1126/scisignal.2004088 [DOI] [PMC free article] [PubMed] [Google Scholar]
- 20.Shen J., “Tools for NIFTI and ANALYZE images,” 2014, http://in.mathworks.com/matlabcentral/fileexchange/8797-tools-for-nifti-and-analyze-image (14 September 2014).
- 21.Wolf I., et al. , “The medical imaging interaction toolkit (MITK)—a toolkit for facilitating the creation of interactive software by extending VTK and ITK,” Med. Image Anal. 9(6), 594–604 (2005). 10.1016/j.media.2005.04.005 [DOI] [PubMed] [Google Scholar]
- 22.Theodoridis S., Koutroumbas K., Pattern Recognition, 3rd ed., Elsevier, San Diego, California: (2006). [Google Scholar]
- 23.Ganeshan B., et al. , “Three-dimensional textural analysis of brain images reveals distributed grey matter abnormalities in schizophrenia,” Eur. Radiol. 20(4), 941–948 (2010). 10.1007/s00330-009-1605-1 [DOI] [PubMed] [Google Scholar]
- 24.Philips C., et al. , “An analysis of co-occurrence and Gabor texture classification in 2D and 3D,” in Proc. Computer Assisted Radiology and Surgery Congress, Barcelona, Spain: (2008). [Google Scholar]
- 25.Haralick R. M., “Statistical and structural approaches to texture,” Proc. IEEE 67(5), 786–804 (1979). 10.1109/PROC.1979.11328 [DOI] [Google Scholar]
- 26.Haralick R. M., Shanmugam K., Dinstein I. H., “Textural features for image classification,” IEEE Trans. Syst. Man Cybern. 3, 610–621 (1973). 10.1109/TSMC.1973.4309314 [DOI] [Google Scholar]
- 27.Benjamini Y., Hochberg Y., “Controlling the false discovery rate: a practical and powerful approach to multiple testing,” J. R. Stat. Soc. Ser. B 57(1), 289–300 (1995). [Google Scholar]
- 28.Forkman J., “Estimator and tests for common coefficients of variation in normal distributions,” Commun. Stat. Theory Methods 38(2), 233–251 (2009). 10.1080/03610920802187448 [DOI] [Google Scholar]
- 29.Hall M., et al. , “The WEKA data mining software: an update,” SIGKDD Explor. 11(1), 10–18 (2009). 10.1145/1656274.1656278 [DOI] [Google Scholar]
- 30.Moraglio A., Togelius J., “Inertial geometric particle swarm optimization,” in Proc. of IEEE Congress on Evolutionary Computation, pp. 1973–1980 (2009). [Google Scholar]
- 31.Gerlinger M., et al. , “Intratumor heterogeneity and branched evolution revealed by multiregion sequencing,” N. Engl. J. Med. 366, 883–892 (2012). 10.1056/NEJMoa1113205 [DOI] [PMC free article] [PubMed] [Google Scholar]
- 32.Kuo M. D., Jamshidi N., “Behind the numbers: decoding molecular phenotypes with radiogenomics-guiding principles and technical considerations,” Radiology 270, 320–325 (2014). 10.1148/radiol.13132195 [DOI] [PubMed] [Google Scholar]
- 33.Rathmell W. K., Chen S., “VHL inactivation in renal cell carcinoma: implications for diagnosis, prognosis and treatment,” Expert Rev. Anticancer Ther. 8(1), 63–73 (2008). 10.1586/14737140.8.1.63 [DOI] [PMC free article] [PubMed] [Google Scholar]
- 34.Da Costa W. H., et al. , “Polybromo-1 (PBRM1), a SWI/SNF complex subunit is a prognostic marker in clear cell renal cell carcinoma,” BJU Int. 113, E157–E163 (2014). 10.1111/bju.12426 [DOI] [PubMed] [Google Scholar]


