Abstract.
Volumes reconstructed from tracked planar ultrasound images often contain regions where no information was recorded. Existing interpolation methods introduce image artifacts and tend to be slow in filling large missing regions. Our goal was to develop a computationally efficient method that fills missing regions while adequately preserving image features. We use directional sticks to interpolate between pairs of known opposing voxels in nearby images. We tested our method on 30 volumetric ultrasound scans acquired from human subjects, and compared its performance to that of other published hole-filling methods. Reconstruction accuracy, fidelity, and time were improved compared with other methods.
Keywords: ultrasound, volume, reconstruction, interpolation
1. Introduction
1.1. Purpose
Spatially tracked two-dimensional ultrasound images (hereafter referred to as images) are often reconstructed into three-dimensional (3-D) ultrasound volumes (hereafter referred to as volumes). This process is known as volume reconstruction. Volumes cover larger regions than images, allowing exploration of 3-D anatomical structures, such as the vasculature of organs. Reconstructed ultrasound volumes are useful in both diagnosis and guidance of interventions. Several methods have been proposed in the literature for ultrasound volume reconstruction.1 While in the past they had been generally satisfactory, in the modern era of real-time 3-D ultrasound image guidance, their manifest shortcomings limit further progress. This paper introduces a new method to significantly improve on existing ultrasound volume reconstruction techniques. We tested our method in 30 ultrasound volumes collected from human subjects and compared its performance to that of the most commonly used volume reconstruction methods (those using nearest neighbor and Gaussian-weighted interpolation).
1.2. Technical Background
There are three major groups of volume reconstruction methods.1 Function-based methods use input image pixels to create three-dimensional mathematical functions, which are then used to estimate voxel intensities. These are heavy on computation which can result in long computation times,1,2 and blurring may also be noticeable.2,3 Voxel-based methods estimate voxel intensities as a function of nearby images. They are considered to be fast, but at least some information from all of the images needs to be loaded into memory for these computations to be performed. If there are many images scattered over a large region, or only limited hardware is available, memory management becomes slow and costly. Pixel-based methods are the third group and are the focus of this paper. Their time and memory requirements are relatively low (generally each input image needs to be read into memory only once), but there is no guarantee that the output volume will be a continuous volume – there may be blank regions (holes). The presence of these blank regions—and limitations in existing methods to deal with them—is the critical problem that we address in this paper. Before continuing, it is important to first explain why these regions occur.
Pixel-based methods feature a distribution step where input pixels are assigned to output voxels. The most common distribution method is called nearest neighbor distribution, where each individual pixel intensity is assigned to the spatially nearest voxel.4,5 That voxel then becomes a filled voxel. Overlapping intensities are usually dealt with by computing an average or maximum intensity.4–7
If there is a voxel that is not assigned at least one pixel intensity, then it is considered to be a hole. Holes can occur when the image sampling is too sparse for the output volume, or when the image sampling is uneven (e.g., when there is a rotation component in transducer movement). As a preventative measure, a single pixel intensity may be distributed over a kernel region,8–13 but this introduces blurring. Additional intermediate images can also be interpolated from the original set of input images prior to the distribution step14 in order to increase image sampling, but there is no guarantee that all holes will be filled. A hole filling step may be necessary, especially when using tracked freehand ultrasound.
The most common hole filling method is nearest neighbor hole filling,2,4,7,9,12,14 where a kernel region surrounding the hole is searched for filled voxels. The kernel is a cube-shaped grid of voxels, centered on the hole, with an isotropic width. If one or more filled voxels are found in the kernel, then the hole is assigned the average intensity of the filled voxels inside of it. If there are no filled voxels, then a larger kernel is searched up to some maximum size. The maximum kernel size thus determines the size of the holes that can be filled. Filled holes are typically ignored for the purposes of this computation (so only original filled voxels are used).
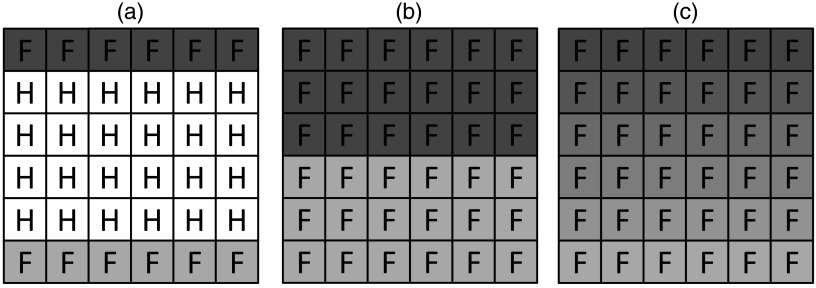
Although nearest neighbor hole filling is popular,2,4,7,9,12,14 has few parameters, and is considered relatively fast,9 it has three notable deficiencies. First, it introduces blurring because it uses a mean over many surrounding voxels. Second, since only the nearest filled voxels are used to fill holes, there can be a sharp transition in intensity values across large holes (Fig. 1). Finally, the computational speed of nearest neighbor hole filling is , with as the maximum size of the kernel region – which means that we might expect slow performance for large kernel regions. Scheipers et al.14 investigate further variants of nearest neighbor hole filling, but these are shown to be inferior.14
Fig. 1.
Example of hole-filling result. The dimensionality is reduced to allow for illustration. (a) Volume prior to hole filling, F = filled voxel, H = hole. (b) Volume after nearest neighbor hole filling, each hole is filled with the nearest filled voxel value. No smooth transition is seen. The maximum kernel size is 5. (c) An ideal result with a smooth gradient between the original filled values.
Another hole-filling method redistributes filled voxels according to a Gaussian-weighted kernel,7 but there still appears to be blur. San José-Estépar et al.15 apply a normalized convolution filter to the sparse ultrasound data, but the speed of the method is not reported on.
This paper describes a hole-filling method for ultrasound volume reconstruction. It is more accurate and faster than nearest neighbor hole filling (which we quantitatively demonstrate), and it is free from excessive blurring and sharp transitions between adjacent images (which we qualitatively show from ultrasound slices through the resulting volumes).
2. Materials and Methods
2.1. Hole Filling with Directed Sticks
We draw inspiration from Trobaugh et al.16 and Coupé et al.,17 who describe voxel-based methods that force interpolation to occur between two images that are on (near) opposite sides of the hole. The principle of our proposed approach is that when a hole exists between two images, the pixels which most likely correspond to the true value are those that are nearest. A hole can be filled by examining the nearest voxels resulting from two opposing images and interpolating between them. We contrast this with a nearest neighbor approach where only one filled voxel is required.
The sticks hole-filling method searches the isotropic volume for holes. When a hole is found, a filled voxel is searched for along one of the several predefined directions from the hole. Once a filled voxel has been found, the volume is traversed along the opposite direction in search of second filled voxel. Only original filled voxels are considered, not filled holes. The combination of the direction and the opposite direction is called a stick, inspired by Czerwinski et al.18 (In Czerwinski et al. sticks are kernels in an image processing filter, unlike in our study where they are simply direction vectors).
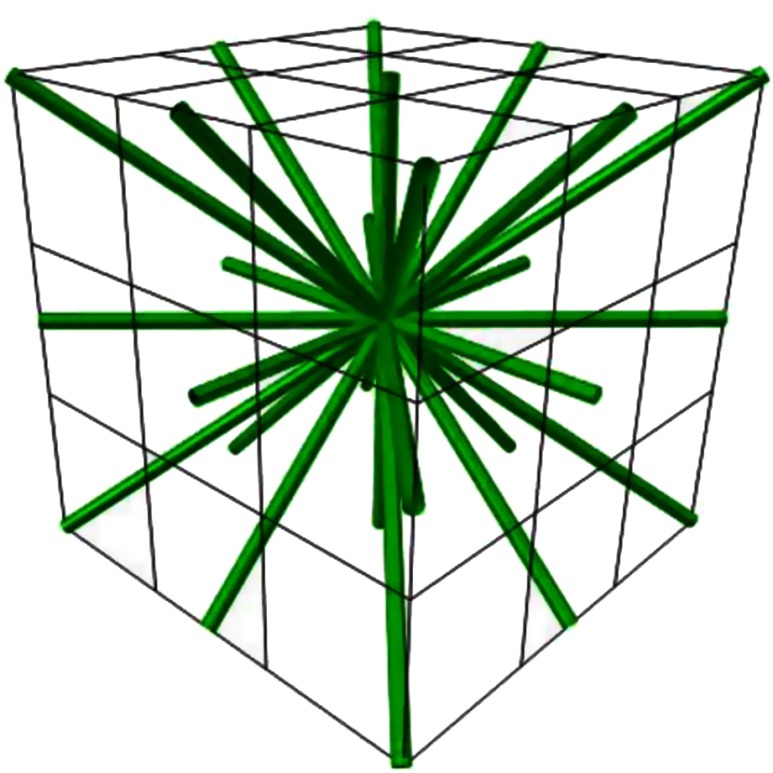
The sticks are chosen such that any change in any coordinate is always an integer, either , 0, or 1. One might think a stick corresponds to each of the voxels immediately surrounding a voxel (Fig. 2). This is not quite the case since each direction is represented twice (one should note that the vectors () and (1,0,0), for example, describe a direction and opposite direction pair – a stick in other words). A total of 13 sticks are possible, and our implementation uses all of them (Fig. 2).
Fig. 2.
The 13 stick directions (green lines) shown in voxel space (black grid) around a central voxel.
The stick is considered successful when two filled voxels are found. An intensity value is linearly interpolated according to distance. This stick intensity and the total stick length (in the Euclidean sense) are both recorded together as a pair.
The stick is considered unsuccessful if two filled voxels have not been found along that stick after traversing a maximum length, as chosen by the user. Typically, the maximum length should be chosen to be the distance (in voxels) between adjacent images. If this is not sufficient to fill all holes, then the parameter can be increased. However, increasing the maximum length will also increase the computational time.
Once all sticks have been searched, the stick intensities associated with the smallest stick lengths are used to fill the hole according to a weighted average:
Each stick intensity is given a weight inversely proportional to the stick length. This particular weight, similar to inverse distance-weighing used by Barry et al.,8 is used because voxels closer to the hole are more likely to be correct.
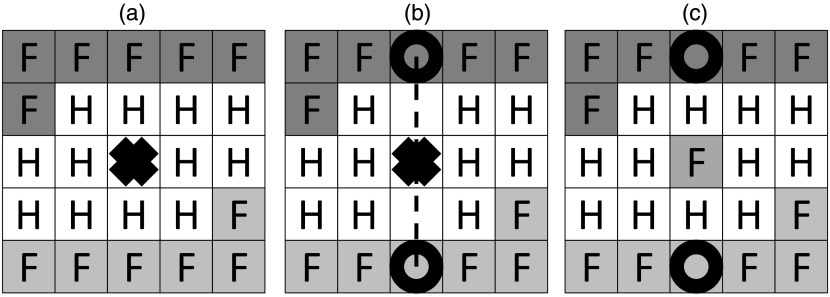
There can be a maximum number of sticks used for this computation. If more sticks are successful, then those with larger stick lengths are ignored. For example, if the number of sticks is 1, then only the shortest stick is used to fill the hole. At this point, the hole becomes a filled hole. The full process is illustrated in Fig. 3.
Fig. 3.
Hole filling using sticks is demonstrated. The dimensionality is reduced to allow for illustration. A filled voxel is denoted with an “F,” and a hole voxel is denoted with an “H.” (a) A hole we wish to fill is at the center of the image, marked with a bolded “X”; (b) the stick is traversed along the dashed line to find a pair of voxels on opposite sides of the hole, marked by empty bolded circles; (c) the voxel intensity is linearly interpolated between the pair of voxels with the shortest distance between them (i.e., number of sticks is 1).
If no sticks are successful, then the hole is left unfilled.
2.2. Implementation
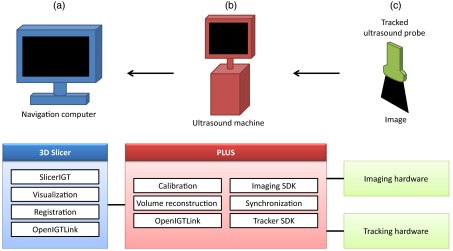
System implementation is a major consideration for any software tool. Volume reconstruction is available to end-users through the SlicerIGT open source application development platform for building image-guided therapy systems for translational clinical research,19,20 built on a 3-D slicer.21,22 The architecture of a complete tracked ultrasound volume reconstruction system is depicted in Fig. 4. At the lowest level, the public software library for the ultrasound (PLUS)23 toolkit communicates with the ultrasound imaging and spatial tracking hardware, synchronizes, interpolates, processes the data, and then streams the live data through standard OpenIGTLink protocol24 to a navigation computer with SlicerIGT. Volume reconstruction is implemented in PLUS and it can run on either the ultrasound computer or the navigation computer.
Fig. 4.
System layout. (a-c) The navigation computer acts as the front-end user interface. Public software library for ultrasound (PLUS) (red) is an intermediate layer which communicates data between the navigation computer and the tracking equipment, also handling various aspects of the tracking. The tracked equipment (green) are physically used by the surgeon on the patient, and relay information back through PLUS and to the navigation computer.
The PLUS toolkit allows for plug and play integration of a variety of ultrasound scanners and spatial tracking devices. For the work presented in this paper, we used a SonixTouch system with a C5-2 ultrasound transducer that is electromagnetically tracked using the SonixGPS extension (Ultrasonix, Richmond, British Columbia, Canada). An electromagnetic reference sensor is taped on the skin of the patient near the region of interest in order to detect and compensate for gross patent motion during image acquisition, with the reference sensor acting as the coordinate frame of reference for all volume reconstructions.
The hole filling method is implemented within the existing framework of PLUS, in the vtkFillHolesInVolume class. The volume reconstruction software parses a configuration file prepared by the user to determine which reconstruction methods to use with what parameters.
The open source aspect allows for a fully transparent and reproducible implementation. The Berkeley software distribution license allows any use without any restrictions, which is hoped to foster further collaborative development and inclusion in comparative evaluations.
2.3. Validation
2.3.1. Image acquisition
We collect images of human organs in order to evaluate the sticks hole-filling method for clinical data. The image sets are dense in order to minimize holes. Holes are later induced for validation purposes by removing images from the sets.9
We choose three organs of clinical interest for imaging and volume reconstruction: the liver, the kidney, and the spine. A volume of the liver can be used to aid in intraoperative registration to a preoperative needle insertion plan.25 Images of the kidney can be used to translate a computed tomography-based preoperative surgical plan to an intraoperative environment.26 Spine volumes have seen increasing use for procedures such as facet joint injection.27
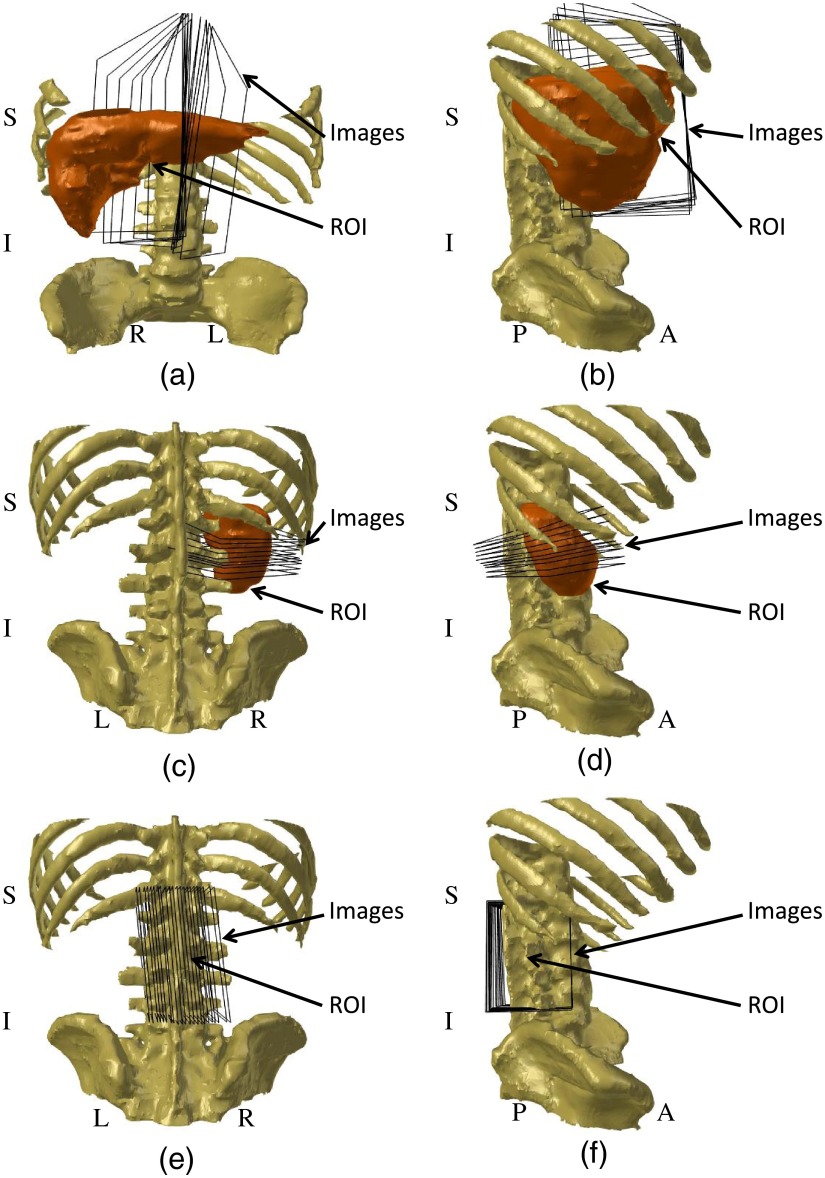
Ten healthy human participants (five male, five female, ages ranging from 21 to 26) were recruited. The liver, right kidney, and spine are scanned using freehand ultrasound in each participant (Fig. 5). Image sets are acquired using a SonixTouch system with a C5-2 ultrasound transducer that is electromagnetically tracked using the SonixGPS extension. A biomedical sciences student performed all image set acquisitions. Properties of the image sets are summarized in Table 1 for each organ.
Fig. 5.
Schematic diagrams showing ultrasound image orientation with respect to the region of interest (ROI). (a) Frontal view of liver image acquisition. (b) Right lateral view of liver image acquisition. (c) Dorsal view of kidney image acquisition. (d) Right lateral view of kidney image acquisition. (e) Dorsal view of spine image acquisition. (f) Right lateral view of spine image acquisition. The ROI labels show only the organs/bones of interest, and not specific locations within or on them. All diagrams were prepared using the anatomical atlas from Talos et al.27, and are intended only for general visualization.
Table 1.
Properties for image sets on each of the three target organs (approximate values).
| Organ | Liver | Kidney | Spine |
|---|---|---|---|
| Number of images | 600 | 500 | 850 |
| Rate of translation | |||
| Rate of rotation |
Each individual data collection is repeated multiple times, but only a single image set for each organ of each participant is used for evaluation. The image set which provides the best coverage of the region of interest, and which has the most distinctive features, is used.
2.3.2. Volume reconstruction
We use the nearest neighbor distribution method. Whenever more than one pixel intensity is inserted into a single voxel, the voxel intensity is compounded as a weighted average. All volumes are reconstructed with an isotropic resolution of 0.5 mm.
Similarly to earlier works,4,7,9,14 the volume reconstructed from the full set of images is used as the ground-truth volume. Due to dense sampling, the number of holes is minimized. When we test hole filling on volumes, we compare the resulting filled hole values to the corresponding voxel values in the ground truth.
Similarly to previous works,2,7,9 holes are simulated by reconstructing the volumes using reduced image sets. Let the sparsity of a volume be a number greater than 1, which indicates how much of the original image set we use. Only one image out of that number is used during the distribution step. If the sparsity is 5, for example, then only images 1, 6, 11, 16, and so on would be used. This simulates uniformly faster probe movement and results in realistic hole shapes. Experimental volumes are thus defined as volumes constructed from such reduced image sets. Several sparsity values are used in order to create hole regions of various sizes. We arbitrarily choose sparsity to be 2, 5, 10, and 25. These particular values result in volumes with varying amounts of holes between 0% and 93.5% of the whole volume.
After nearest neighbor distribution, we individually apply each of three different hole filling methods on each experimental volume for comparison. First, we apply the sticks hole filling method. Two parameters for the sticks hole filling method need to be defined: the maximum length and the number of sticks. We test various values for the maximum lengths: 3, 5, 7, and 9. We choose 9 as the upper range on this parameter because we find that the majority of holes are filled when the maximum length is 9. We use different values for the number of sticks to evaluate its effect on volume reconstruction quality (we arbitrarily choose to compare number of sticks = 1, 3, 6, 9, and 13 as a reasonable sampling on that parameter).
Second, since sticks hole filling is intended to improve upon nearest neighbor hole filling,4,7,9,14 we are interested to see how these methods compare. Therefore, nearest neighbor hole filling (using a cube-shaped kernel) is used as our main baseline for comparison. Similarly to the maximum length in sticks hole filling, we test nearest neighbor hole filling with maximum kernel sizes of 3, 5, 7, and 9.
Third, we fill holes using a Gaussian-weighted average of surrounding filled voxels using a spherical kernel with a 95% cutoff. Similarly to the previous hole filling methods, we use kernels’ sizes of 3, 5, 7, and 9.
All volume reconstructions are performed on a computer with processor Intel Core i7-2600K at 3.4GHz, memory 16GB RAM, and Windows 7 64-bit operating system.
2.3.3. Evaluation metrics
Numerical metrics are obtained for the anatomically relevant region of interest in each volume, which is manually segmented. For the liver, this is the vasculature-rich area minimally affected by the beating heart, anterior to the portal vein. For the kidney, this is the renal hilum. For the spine, this is any nonshadowed region of the vertebrae contained in the volume, including the facet joints.
We compare all of the methods using these same metrics. All methods can be applied to any volume that has holes. This direct comparison allows us to study how the choice of method and parameters affect volume reconstruction.
Volume root-mean-square error
This metric represents the hole filling method’s ability to accurately reconstruct missing data in the volume. The error for each filled hole is defined as the absolute difference between its intensity and the intensity of the corresponding ground-truth voxel:
If the voxel from the ground truth is a hole, then that voxel is ignored for the purposes of this computation. The volume root-mean-square error (volume RMS error) is then calculated:
where the total number of filled holes in the experimental volume’s region of interest is used. RMS values are used to give high error values more weight.
Fraction of filled holes
We take into consideration a hole filling method’s ability to reliably fill holes. We report the fraction of filled holes in the experimental volume as a second evaluation metric:
where the total number of holes in the region of interest prior to hole filling is used.
Execution time
The speed of a hole filling method is important if it is used in a clinical setting. We report the execution time of each hole filling method on the full volume using only a single execution thread on the CPU. Using the full volume simulates a more realistic clinical scenario where the region of interest may not be clearly defined in advance.
On average, liver volumes are voxels in size, kidney volumes are voxels, and spine volumes are voxels. These numbers are shown to two significant figures.
Visual analysis
Depending on the application, the final volume could be read by a human interpreter. It is important to visually verify whether or not the hole filling method produces values that are realistic, and also to consider reconstruction artifacts (if any).
Fraction of holes
The above evaluation metrics are of interest as a function of the density of holes. We define the fraction of holes in the experimental volume prior to hole filling:
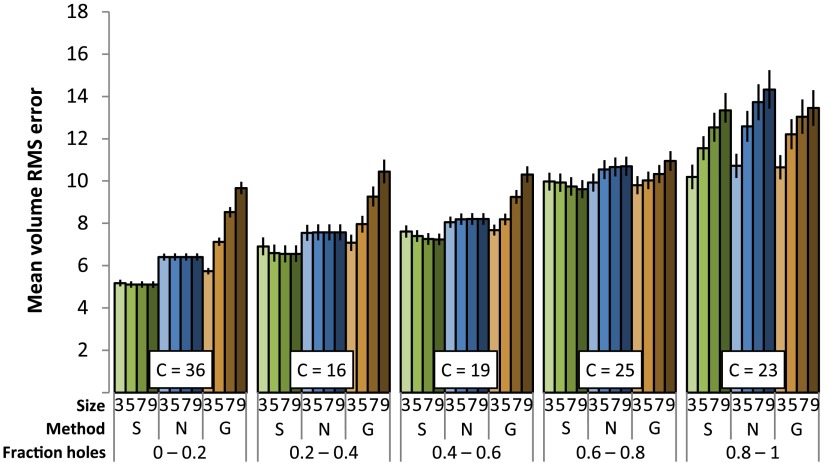
where the total number of voxels within the region of interest is used. In our dataset, we place each volume in a bin according to the fraction of holes, and conducted analysis on each bin. The bins correspond to 0–0.2 fraction of the filled holes (this contained 36 volumes), 0.2–0.4 (16 volumes), 0.4–0.6 (19 volumes), 0.6–0.8 (25 volumes), and 0.8–1.0 (23 volumes).
3. Results
All slices of volumes are displayed using the reformat module of 3-D slicer (Version 4.2.2-1).25 Holes appear as black pixels.
3.1. Optimization on the Number of Sticks
Figure 6 shows the slices that are in-plane with filled holes of a spine volume. Results are shown using various values for the number of sticks, with a stick length 9. It can be seen that increasing the number of sticks blurs the image. This is a typical result seen across the experimental volumes. Setting the number of sticks to 1 produces the least blurry image.
Fig. 6.
Cross-sectional slices shown in-plane with a region of holes in a spine volume. The fraction of holes is 0.52. Results are shown using various values for number of sticks. (a)-(d) Ground truth, number of sticks = 1, 3, and 6.
In terms of volume RMS error, it can be seen in Table 2 that setting the number of sticks to 1 is generally optimal. Comparing the top two results, using number of sticks = 1 outperforms number of sticks = 3 in 78 cases, and 40 cases vice versa. Using the binomial test (ignoring ties and assuming equal probability), we obtain a two-tailed , which is statistically significant.
Table 2.
Mean volume root-mean-square (RMS) error over all volumes using various values for the number of sticks. RMS errors cannot be presented for when no hole-filling method is used because unfilled hole voxels have no value.
| Volume RMS error | ||
|---|---|---|
| Number of sticks | 1 | 8.112 |
| 3 | 8.272 | |
| 6 | 8.598 | |
| 9 | 8.819 | |
| 13 | 8.940 |
Setting the number of sticks to 1 for all future analysis is consistent with the goal of preserving image features.
3.2. Comparison of Methods
The mean volume RMS error (Fig. 7) increases as the fraction of holes increases. Sticks hole filling generally performs with the least error (using the binomial test, we obtained a two-tailed against each of nearest neighbor and Gaussian hole filling methods), but all of the methods under study perform comparably poorly when the fraction of holes is between 0.8 and 1. Error increases as the kernel size in the nearest neighbor or Gaussian-weighted hole filling increases. Error decreases as the maximum length increases in sticks hole filling.
Fig. 7.
Mean volume root-mean-square (RMS) error under different conditions (-axis). “Size” is the size parameter for the hole-filling method (maximum length or kernel size), “Method” is the hole-filling method used (S = sticks, N = nearest neighbor, G = Gaussian). C indicates the count of volumes in each bin. The error bars indicate standard error.
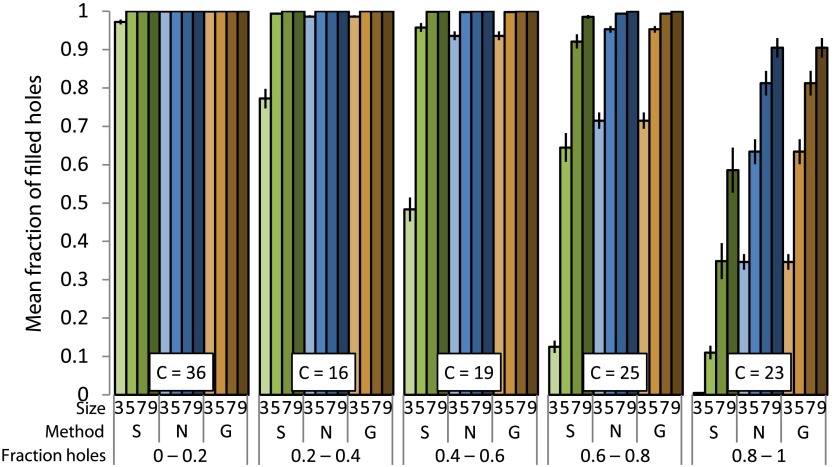
The mean fraction of filled holes (Fig. 8) decreases as the fraction of holes increases. Sticks hole filling results in a reduced fraction of filled holes when compared with nearest neighbor or Gaussian-weighted hole filling (using the binomial test, we obtained a two-tailed against each of nearest neighbor and Gaussian hole filling methods). All methods have a higher fraction of filled holes as the size parameter (kernel size or maximum length) increases.
Fig. 8.
Mean fraction of filled holes under different conditions. Figure layout is the same as Fig. 7.
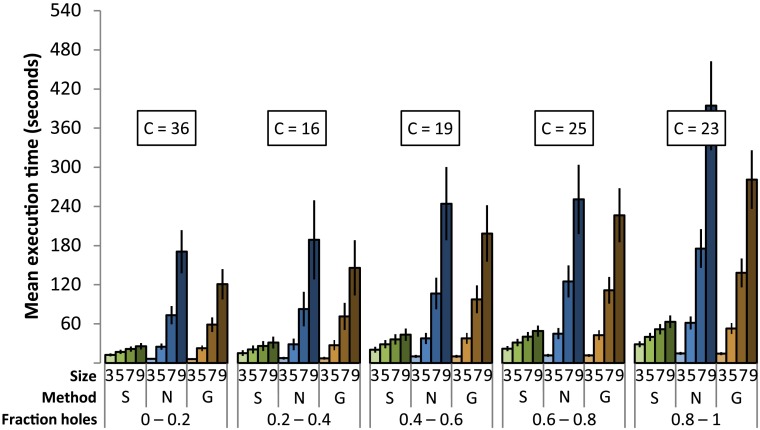
The mean execution time (Fig. 9) increases as the fraction of holes increases. Sticks generally performed the fastest (using the binomial test, we obtained a two-tailed against each of nearest neighbor and Gaussian hole-filling methods). As the size parameter increases, the time requirement for nearest neighbor and Gaussian-weighted hole filling increases at faster rate than that for sticks hole filling. With size parameter 3, sticks hole filling performs more slowly than nearest neighbor and Gaussian-weighted hole filling. As the size parameter increases above 5, sticks performs noticeably faster than the nearest neighbor hole filling and Gaussian-weighted hole filling. Times are reported using a single execution thread on the CPU with processor Intel Core i7-2600K at 3.4GHz.
Fig. 9.
Mean execution time under different conditions. Figure layout is the same as Fig. 7.
In-plane slices of filled holes show that sticks hole filling results in less blur than nearest neighbor or Gaussian-weighted hole filling (Figs. 10, 11, and 12). Blur is especially visible in the in-plane slices because of sharp transitions between smoothed and noisy data. This results in stripe artifacts in the slices showing Gaussian and nearest neighbor hole filling. Slices of sticks hole filling more closely resemble the ground truth than slices of other methods. There is still noticeable blur when there is a high fraction of holes (Fig. 12). Gaussian-weighted hole filling results in less blur than nearest neighbor hole filling.
Fig. 10.
Kidney slices are shown for an experimental volume with fraction of holes = 0.21. (a)-(f): Slices in-plane with holes. (g)-(l) Slices transverse to holes. From left to right: ground truth, no hole filling, sticks hole filling, nearest neighbor hole filling, Gaussian-weighted hole filling (kernel size 3), Gaussian-weighted hole filling (kernel size 5). The in-plane slice without hole filling is black because it consists entirely of holes.
Fig. 11.
Spine slices are shown for an experimental volume with fraction of holes = 0.44. (a)–(f): Slices in-plane with holes. (g)–(l) Slices transverse to holes. From left to right: ground truth, no hole filling, sticks hole filling, nearest neighbor hole filling, Gaussian-weighted hole filling (kernel size 3), Gaussian-weighted hole filling (kernel size 5). The in-plane slice without hole filling is black because it consists entirely of holes.
Fig. 12.
Liver slices are shown for an experimental volume with fraction of holes = 0.66. (a)–(f): Slices in-plane with holes. (g)–(l) Slices transverse to holes. From left to right: ground truth, no hole filling, sticks hole filling, nearest neighbor hole filling, Gaussian-weighted hole filling (kernel size 3), Gaussian-weighted hole filling (kernel size 5). The in-plane slice without hole filling and the image showing Gaussian (size 3) are black because they consist entirely of holes.
Transverse slices show few (if any) artifacts for any of the hole-filling methods when the fraction of holes is low (Fig. 10). For a higher fraction of filled holes, nearest neighbor and Gaussian-weighted hole filling produce noncontinuous seams parallel with the plane of holes (Figs. 11 and 12). In Fig. 11, the seam arises from excessive blurring from surrounding voxels. In Fig. 12, the seam arises from a combination of blur and a sharp transition (as shown earlier in Fig. 1). Sticks hole filling, on the other hand, may produce streaks that are transverse to the plane of holes.
4. Discussion
When applied to our data, sticks hole filling performs with improved accuracy compared to nearest neighbor and Gaussian-weighted hole filling (Fig. 7), except when the fraction of holes is very high. Image artifacts observed when using nearest neighbor and Gaussian-weighted hole filling (such as blurring and sharp transitions, see Figs. 11 and 12) were not observed when using sticks hole filling. The ability to reliably fill holes is comparable for all of these methods, provided that the maximum length or size is sufficiently high (Fig. 8). The execution time of the sticks hole filling method is improved compared to the nearest neighbor and Gaussian-weighted hole filling methods when the size parameter is large (Fig. 9).
The main limitation of sticks hole filling is that it does not fill as many holes as nearest neighbor or Gaussian-weighted hole filling (Fig. 8) if the maximum length parameter is set too low. However, if reconstruction accuracy or time is more important, then sticks may be preferred over those methods. If time is the most important consideration and a very small kernel size (diameter 3) for nearest neighbor or Gaussian-weighted hole filling is known to be sufficient in a specific application, then either of those methods may be preferable to sticks due to shorter computation times (Fig. 9), assuming that blur is not a concern. The choice of reconstruction method would depend on the application.
Our evaluation study of the sticks hole filling method is not without limitations. Although we use clinical images for testing, the clinical significance of improved volume reconstruction remains to be investigated. Volume RMS error is an intuitive metric, but it is not comprehensive. The volume RMS errors we report are probably not representative of all datasets – in the present study we are interested in comparing how methods perform with respect to one another. The way in which we generate ground-truth volumes may not be clinically realistic (due to the length and density of scan). By skipping input images during the reconstruction, we can simulate uniformly faster transducer movement, which creates clinically realistic experimental volumes with holes. One of the spine experimental volumes has no holes when the sparsity is 2 because the image sampling is too dense. We ignore this experimental volume in our analysis. All other volumes had holes. Since the testing dataset is sufficiently large, no bias should occur. In addition, the reported execution times do not feature any optimization or implementation on multiple cores or the GPU, and as a result, it may be possible to achieve faster times for all hole filling methods. During algorithm development, we tested the methods on phantom data so that there would be no systematic bias in this study.
All hole filling methods under study experience poor performance in large regions of continuous holes (Figs. 7 and 8). Although we have shown that hole filling methods can fill small or moderate regions of continuous holes, this result emphasizes that reasonably dense and uniform image sampling is still required.
The sticks hole filling method performs faster than the nearest neighbor and Gaussian-weighted hole filling method when the size parameter is greater than 5 (Fig. 9). We explain this by considering the worst case number of voxels which must be searched in terms of the size parameter (n). In nearest neighbor hole filling, an region would be searched, making it . The sticks hole filling method would search only 13*n voxels, making it . Thus, as the size parameter () increases, the sticks hole filling method performs faster.
It is interesting to see how this special case of linear interpolation (sticks hole filling) performs when compared against averaging (nearest neighbor hole filling) and low-pass filtering (Gaussian-weighted hole filling). The reason why sticks perform well could be because we take advantage of the known planar geometry of the original filled voxels. To find an appropriate value to fill a hole between two planes, it is perhaps best to interpolate directly between the two nearest two opposite images, which is what the sticks hole filling method attempts to do. Averaging (nearest neighbor or Gaussian-weighted hole filling) seems to introduce blur and cause loss of resolution.
Finally, the fact that this software is freely available and open source is an important aspect of this study. It means that this method is immediately available to researchers worldwide for further modification and evaluation. PLUS has been downloaded over 1300 times in the last year (between April 2014 and April 2015). Anyone can sign up to follow the PLUS project to ask questions, request enhancements, report bugs, or contribute patches. As time goes on, PLUS continues to evolve – it currently has 3694 commits made by 35 contributors representing 145,616 lines of code and an estimated 37 years of development effort (based on COCOMO model, computed by Ref. 28). Although over 60 papers refer to the PLUS toolkit, its licensing does not mandate citations, so the true number of papers PLUS contributes to may be higher. The SlicerIGT end-user platform website has had more than 9300 visitors from 86 countries in the last year.
5. Conclusions
Sticks hole filling performs with improved accuracy over nearest neighbor hole and Gaussian-weighted filling, is better able to preserve image features, and is faster for larger search regions. The method has been implemented in PLUS, which is open source and is freely available online.
Acknowledgments
This work was co-funded as an Applied Cancer Research Unit of Cancer Care Ontario with funds provided by the Ontario Ministry of Health and Long-Term Care. Gabor Fichtinger is supported as a Cancer Care Ontario Research Chair in Cancer Imaging. Thomas Vaughan was funded by a Canada Natural Sciences and Engineering Research Council (NSERC) Undergraduate Student Research Award and a NSERC Postgraduate Research Award. The abdominal atlas from Talos et al.29 (used only for visualization purposes in Fig. 5) was supported by the following grants P41 RR013218/RR/NCRR NIH HHS/United States, R01 MH050740/MH/NIMH NIH HHS/United States. Thomas Vaughan, Andras Lasso, Tamas Ungi, and Gabor Fichtinger declare that they have no conflicts of interest.
Biographies
Thomas Vaughan is a PhD student at Queen’s University in Kingston, Ontario, Canada. His academic interests include computer-assisted surgery, patient-specific instrumentation, and mesh-based algorithms. Currently, he is funded by an Alexander Graham Bell Canada Graduate Scholarship (Doctoral Program) from the Natural Sciences and Engineering Research Council (NSERC) of Canada.
Andras Lasso is a senior research engineer in the School of Computing at Queen’s University, Kingston, Ontario. He received his PhD in electrical engineering from the Budapest University of Technology, Hungary, in 2011. His research interests are building high-quality and reusable software for research and clinical use.
Tamas Ungi received his MD and PhD degrees from the University of Szeged, Hungary, in 2006 and 2011. He is an adjunct assistant professor at the School of Computing at Queen’s University in Kingston, Ontario, Canada. His research interests include image-guided medical interventions and interventional skills education. He is a primary contributor to the SlicerIGT open source platform for navigated medical interventions.
Gabor Fichtinger is a professor in the School of Computing and the director of the Laboratory for Percutaneous Surgery at Queen’s University in Kingston, Ontario, Canada. His research specializes in medical image computing and computer-assisted interventions, primarily for the diagnosis and therapy of cancer.
References
- 1.Solberg O. V., et al. , “Freehand 3D ultrasound reconstruction algorithms-a review,” Ultrasound Med. Biol. 33, 991–1009 (2007). 10.1016/j.ultrasmedbio.2007.02.015 [DOI] [PubMed] [Google Scholar]
- 2.Rohling R., Gee A., Berman L., “A comparison of freehand three-dimensional ultrasound reconstruction techniques,” Med. Image Anal. 3, 339–359 (1999). 10.1016/S1361-8415(99)80028-0 [DOI] [PubMed] [Google Scholar]
- 3.Sanches J. M., Marques J. S., “A Rayleigh reconstruction/interpolation algorithm for 3D ultrasound,” Pattern Recognit. Lett. 21, 917–926 (2000). 10.1016/S0167-8655(00)00053-2 [DOI] [Google Scholar]
- 4.Dewi D., et al. , “3D ultrasound reconstruction of spinal images using an improved Olympic hole-filling method,” in Proc. Intl. Conf. on Instrumentation, Communication, Information Technology and Biomedical Engineering pp. 1–5 (2009). [Google Scholar]
- 5.Nelson R., Pretorius D. H., “Interactive acquisition, analysis, and visualization of sonographic volume data,” Int. J. Imaging Syst. Technol. 8, 26–37 (1997). [DOI] [Google Scholar]
- 6.Hernandez A., et al. , “Spatial compounding in ultrasonic imaging using an articulated scan arm,” Ultrasound Med. Biol. 22, 229–238 (1996). 10.1016/0301-5629(95)02038-1 [DOI] [PubMed] [Google Scholar]
- 7.San José-Estépar R., et al. , “A theoretical framework to three-dimensional ultrasound reconstruction from irregularly sampled data,” Ultrasound Med. Biol. 29, 255–269 (2003). 10.1016/S0301-5629(02)00762-7 [DOI] [PubMed] [Google Scholar]
- 8.Barry C., et al. , “Three-dimensional freehand ultrasound: image reconstruction and volume analysis,” Ultrasound Med. Biol. 23, 1209–1224 (1997). 10.1016/S0301-5629(97)00123-3 [DOI] [PubMed] [Google Scholar]
- 9.Solberg O. V., et al. , “3D ultrasound reconstruction algorithms from analog and digital data,” Ultrasonics 51, 405–419 (2011). 10.1016/j.ultras.2010.11.007 [DOI] [PubMed] [Google Scholar]
- 10.Meairs S., Beyer J., Hennerici M., “Reconstruction and visualization of irregularly sampled three- and four-dimensional ultrasound data for cerebrovascular applications.” Ultrasound Med. Biol. 26, 263–272 (2000). 10.1016/S0301-5629(99)00130-1 [DOI] [PubMed] [Google Scholar]
- 11.Ohbuchi R., Fuchs H., “Incremental volume rendering algorithm for interactive 3D ultrasound imaging,” Lec. Notes Comput. Sci. 511, 486–500 (1991). [Google Scholar]
- 12.Dai Y., et al. , “Real-time visualized freehand 3D ultrasound reconstruction based on GPU,” IEEE Trans. Inform. Technol. Biomed. 14, 1338–1345 (2010). 10.1109/TITB.2010.2072993 [DOI] [PubMed] [Google Scholar]
- 13.Gobbi D. G., Peters T. M., “Interactive intra-operative 3D ultrasound reconstruction and visualization,” Lec. Notes Comput. Sci. 2489, 156–163 (2002). 10.1007/3-540-45787-9_20 [DOI] [Google Scholar]
- 14.Scheipers U., et al. , “3-D ultrasound volume reconstruction using the direct frame interpolation method.” IEEE Trans. Ultrasond Ferroelectr. 57, 2460–2470 (2010). 10.1109/TUFFC.2010.1712 [DOI] [PubMed] [Google Scholar]
- 15.San José-Estépar R., et al. , “Freehand ultrasound reconstruction based on ROI prior modeling and normalized convolution,” Med. Image. Comput. Comput. Assist. Interv., http://link.springer.com/chapter/10.1007%2F978-3-540-39903-2_47 (2003).
- 16.Trobaugh J. W., Trobaugh D. J., Richard W. D., “Three-dimensional imaging with stereotactic ultrasonography,” Comput. Med. Imaging Graph. 18, 315–323 (1994). 10.1016/0895-6111(94)90002-7 [DOI] [PubMed] [Google Scholar]
- 17.Coupé P., et al. , “3D freehand ultrasound reconstruction based on probe trajectory,” Med. Image. Comput. Comput. Assist. Interv. 8(Pt 1), 597–604 (2005). 10.1007/11566465_74 [DOI] [PubMed] [Google Scholar]
- 18.Czerwinski R., Jones D., O'Brien W. D., “Detection of lines and boundaries in speckle images-application to medical ultrasound,” IEEE Trans. Med. Imaging 18, 126–136 (1999). 10.1109/42.759114 [DOI] [PubMed] [Google Scholar]
- 19.Tamas Ungi, SlicerIGT, 2015, www.slicerigt.org (July 2015).
- 20.Ungi T., et al. , “Perk Tutor: an open-source training platform for ultrasound-guided needle insertions,” IEEE Trans. Biomed. Eng. 59(12), 3475–3481 (2012). 10.1109/TBME.2012.2219307 [DOI] [PubMed] [Google Scholar]
- 21.Fedorov A., et al. , “3D slicer as an image computing platform for the quantitative imaging network,” Magn. Reson. Imaging 30, 1323–1341 (2012). 10.1016/j.mri.2012.05.001 [DOI] [PMC free article] [PubMed] [Google Scholar]
- 22.Steve Pieper, 3D Slicer, 2015, www.slicer.org (July 2015)
- 23.Lasso A., et al. , “PLUS: open-source toolkit for ultrasound-guided intervention systems,” IEEE Trans. Biomed. Eng. 61(10), 2527–2537 (2014). 10.1109/TBME.2014.2322864 [DOI] [PMC free article] [PubMed] [Google Scholar]
- 24.Tokuda J., et al. , “OpenIGTLink: an open network protocol for image-guided therapy environment,” Int. J. Med. Robot. 5, 423–434 (2009). 10.1002/rcs.274 [DOI] [PMC free article] [PubMed] [Google Scholar]
- 25.Aylward S. R., et al. , “Intra-operative 3D ultrasound augmentation,” in Proc IEEE Int. Symp. on Biomedical Imaging, pp. 421–424, IEEE; (2002). 10.1109/ISBI.2002.1029284 [DOI] [Google Scholar]
- 26.Mozer P., et al. , “Computer-assisted access to the kidney,” Int. J. Med. Robot. 1, 58–66 (2005). 10.1002/rcs.58 [DOI] [PubMed] [Google Scholar]
- 27.Khallaghi S., et al. , “Registration of a statistical shape model of the lumbar spine to 3D ultrasound images,” Lec. Notes Comput. Sci. 6362, 68–75 (2010). 10.1007/978-3-642-15745-5_9 [DOI] [PubMed] [Google Scholar]
- 28.Black Duck Software Inc., Open Hub, 2015, www. openhub.net (July 2015)
- 29.Talos I.-F., Jakab M., Kikinis R., “SPL Abdominal Atlas,” Surgical Planning Laboratory, March 2008, http://www.spl.harvard.edu/ (July 2013).


