Abstract
Ventricular fibrillation is the major underlying cause of sudden cardiac death. Understanding the complex activation patterns that give rise to ventricular fibrillation requires high resolution mapping of localized activation. The use of multi-electrode mapping unraveled re-entrant activation patterns that underlie ventricular fibrillation. However, optical mapping contributed critically to understanding the mechanism of defibrillation, where multi-electrode recordings could not measure activation patterns during and immediately after a shock. In addition, optical mapping visualizes the virtual electrodes that are generated during stimulation and defibrillation pulses, which contributed to the formulation of the virtual electrode hypothesis. The generation of virtual electrode induced phase singularities during defibrillation is arrhythmogenic and may lead to the induction of fibrillation subsequent to defibrillation. Defibrillating with low energy may circumvent this problem. Therefore, the current challenge is to use the knowledge provided by optical mapping to develop a low energy approach of defibrillation, which may lead to more successful defibrillation.
Keywords: Optical mapping, fibrillation, defibrillation, arrhythmias, imaging, virtual electrodes, stimulation, heart, re-entry, shock
Introduction
Ventricular tachyarrhythmias are responsible for 300,000 sudden cardiac deaths (SCD) a year in the United States of America.[1] The mechanisms underlying these arrhythmias in the majority of cases are ventricular tachycardia and/or ventricular fibrillation.[2] Extensive research over the past decades have resulted in the development of internal and external cardiac defibrillators, which have contributed to a significant reduction of the number of SCD.[3] The development of defibrillators has been preceded by a vast gain in understanding of the molecular and organ-level mechanism underlying complex arrhythmias. In the early 1900s, re-entry was discovered and proposed as a simple mechanism underlying tachycardia in patients with structurally abnormal hearts and later as a mechanism underlying atrial and ventricular fibrillation in patients with structurally normal hearts.[4] The ability to visualize these complex arrhythmias by electrical mapping and later optical mapping gave insight into the complicated re-entrant activation patterns that give rise to the abnormal body surface electrocardiograms indicative of ventricular fibrillation.
The life-saving effects of electric defibrillation have been known for more than two centuries.[5] The mechanisms of defibrillation, however, have been difficult to study with conventional electrical instrumentation because the shock potential obscures the local electrograms, which contain critical electrophysiological information. The development of computer bidomain models offered the opportunity to simulate potential fields during electrical stimulation and defibrillation and led to the hypotheses of “virtual” electrodes.[6, 7] The optimization of the optical mapping technique enabled testing and direct visualization of these simulated potential fields during defibrillation and the “virtual electrode hypothesis”.[8–10]
In this chapter we briefly discuss the mechanism underlying re-entrant arrhythmias and how the development of optical imaging techniques have unraveled the mechanisms of defibrillation and the critical role of virtual electrodes. Furthermore, we will elaborate on how optical mapping influenced defibrillation in the clinical setting.
Mechanisms of arrhythmias and fibrillation
Cardiac arrhythmias arise from either abnormal impulse formation (focal activity) or abnormal (re-entrant) conduction.[11] In this paragraph we focus on how an ectopic beat is caused by re-entrant excitation. This theory is relevant for understanding the mechanism of arrhythmogenesis caused by a defibrillating shock, especially for understanding how shocks fail to restore sinus rhythm. For a detailed classification of other mechanisms of arrhythmias we refer to the review by Hoffman and Rosen[11] and preceding chapters in this book.
An activation sequence can be considered as re-entry when an activation front re-enters the same myocardial area repeatedly with some periodicity.[12] The first prerequisite for re-entry is that the wavefront needs to meet an area of unidirectional block, where the wavefront is able to propagate in one direction but not the other. The second requirement is the presence of a substrate, or re-entrant path, which enables the activation front to travel around the area of block and “re-enter” the previously activated myocardium causing a second activation. An area of block can be caused by the presence of an anatomical obstacle, like a scar formed after a myocardial infarction, [13] or it can have a functional origin, like heterogeneity in refractoriness.[14] The time period where one area is already excitable but the adjacent area is still refractory is called the vulnerable window. When an ectopic beat arises in this time window then re-entry may occur. In contrast, during a re-entrant activation sequence the vulnerable window becomes the period where an extra stimulus may arrest re-entry.[15] This principle is the basis for anti-tachycardia pacing.
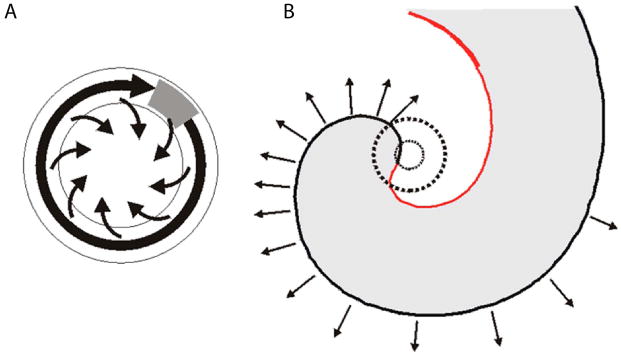
The critical requirement for re-entry to occur is that the available path length must be longer than the wavelength, which is the product of conduction velocity and the refractory period.[16, 17] Reentry cannot sustain when the wavelength is longer than the available path length within the tissue. The leading circle theory (Figure14_1A) states that when a wavefront travels around an area of functional block it will take the shortest pathway that allows the wavefront to re-circulate. This leaves no excitable gap, or vulnerable window. The core that the wavefront circles around or the region where a wavebreak occurs is often referred to as a phase singularity. The leading circle concept states that the activation front that circulates around a center will keep it refractory.[14] Another theory, the spiral wave theory, advocates that an activation front that travels around a center may reach a critical curvature, which prevents activation of the core of the rotating wavefront leaving an excitable gap in the middle (Figure14_1B).[18] These re-entrant waveforms are interchangeably called spiral waves, vortices, or rotors. Multiple rotors can be simultaneously present in the myocardium[19] and generate the seemingly chaotic pattern on the electrocardiogram that is the hallmark of ventricular fibrillation.
Figure14_1.
A) The leading circle concept: Activity establishes itself in the smallest pathway that can support reentry, shown as a large black arrow. Inside the leading circle, centripetal wavelets (small arrows) emanating from it constantly maintain the central core in a refractory state. B) Spiral wave model: Schematic diagram of a spiral wave with the activation front shown in black and the repolarization front in red. The point at which the red and black curves meet has an undefined voltage state and is usually referred to as the phase singularity point. Modified from Comtois et al.[72]
Imaging of fibrillation
Electrical mapping
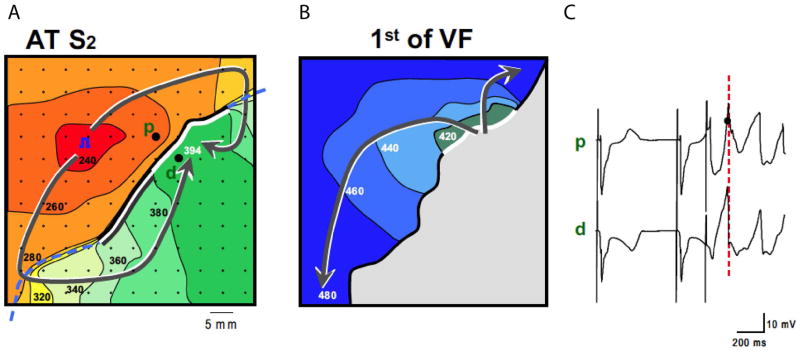
On the electrocardiogram, ventricular fibrillation presents as irregular and random waveforms with no clearly identifiable QRS complexes or P waves. Therefore, the electrocardiogram cannot be used for understanding the underlying mechanism of fibrillation. To study the re-entrant activation patterns, underlying local ventricular activation needs to be recorded. In the explanted perfused heart, multi-electrode grids enable the simultaneous recording of local extracellular electrograms at multiple locations. In a clean unipolar local electrogram the minimal dV/dt of the RS complex corresponds to the local time of myocardial activation under the electrode.[20, 21] From these local times of activation a map can be generated, which reveals the activation sequence and the possible re-entrant pathway as shown in. Figure14_2. Multi-electrode grids can be placed on the endocardium and the epicardium in order to simultaneously measure the activation pattern on both sides. Needle electrodes can be use to record the transmural activation patterns.[22]
Figure14_2.
Electrical mapping of ventricular fibrillation. At the right, an activation map is reconstructed of a premature beat (following S2). In the middle, the activation pattern is reconstructed VF is induced, because local distal activation coincided with local proximal repolarization. The dashed line indicates the epicardial interface between the perfusion beds. Small dots indicate electrode positions. Bold dots indicate positions from which electrograms (right panels) were recorded (p, proximal; d distal). Lines are 20 ms isochrones. Red dotted vertical line in the electrograms indicate the moment of distal activation. This figure is a courtesy of Dr. Ruben Coronel.[73]
In the clinic, catheter mapping is used to record activation times.[23] For monomorphic arrhythmias, a single roving catheter can be used, which will be sequentially placed on numerous sites (for instance the CARTO system (Biosense-Webster, Baldwin Park, CA, USA)). The position of the electrode is monitored using a heterogeneous magnetic field of which the strength can be detected by a sensor at the tip of the catheter. This enables the 3D reconstruction of the activation pattern. However, this technique is not suitable for mapping irregular arrhythmias because it is based on sequential recordings. Newer CARTO mapping systems use catheters with multiple electrodes and begin to circumvent this problem. Another often-used system is EnSite (St. Jude Medical, Inc., St. Paul, MN, USA), which is based on multi-electrode non-contact mapping. With this method the inverse solution is used to calculate the local moments of activation on the endocardium.[24] The introduction of catheter non-contact and contact mapping has improved diagnosis and led to treatment of arrhythmias by ablation or antitachycardia pacing.[25, 26] However, electrical mapping techniques are not suitable for recording the tissue response directly after defibrillation because the overwhelming shock-induced artifacts mask the signal.
Optical mapping
Electrical mapping has been a useful tool for studying the mechanisms of arrhythmia origin and perpetuation and even led to a variety of therapies. However, there are shortcomings of electrical mapping. The spatial resolution is limited and it is not possible to measure local electrical activity during or after a defibrillating shock (for reasons that will be discussed in detail later). Optical mapping provides an alternative method for measuring cardiac electrical activity and addresses the aforementioned shortcomings of electrical mapping.[27] Since optical mapping requires the use of fluorescent dyes the method is currently restricted to the experimental ex vivo settings.
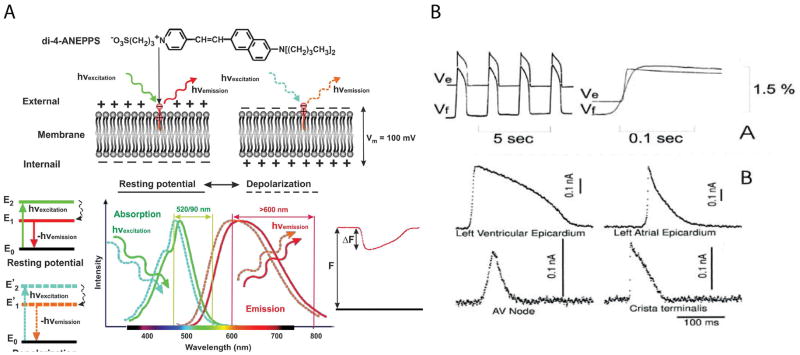
Cardiac electrical activity can be transduced into fluorescent signals by using voltage sensitive dyes that bind to the membrane of cardiomyocytes. When a dye molecule binds to the membrane, emitted fluorescence can be recorded upon excitation of the dye. The wavelength of the emitted light depends on the membrane potential of the cardiomyocyte. When the membrane potential changes (i.e during the action potential), the dynamic wavelength of the emitted light can be recorded as a loss in fluorescence with appropriate filter settings on the acquisition hardware. Filters are specific for particular dyes (e.g. excitation 520±20 and emission >650 nm for di-4-ANEPPS). The change in emitted light is linearly related to the membrane potential, which enables the recording of “optical action potentials”. This mechanism is illustrated in Figure14_3. The number of myocytes that give rise to an optical action potential signal depends on the type of the dye, the optical magnification, the focal plane and the pixel size of the sensor that is used for recording. Optical action potentials are not only derived from fluorescence collected from the surface of tissue but also of fluorescence from deeper layers.[28] Therefore, the optical action potential is an underestimation of the transmembrane potential on the surface and should be compared with transmembrane potential averaged over depth.[29] Commonly used sensors for recording optical action potentials are photodiode arrays, CCD and CMOS cameras.[30]
Figure14_3.
Optical recording of cardiac action potentials using fluorescent dyes. A. The upper panel illustrates the conformation change of di-4-ANEPPS upon a change in membrane potentials. The lower panel shows the shift in emission spectrum results in a change in the amount of recorded fluorescence. B. The upper panel, Simultaneous fluorescent (Vf) and microelectrode (Ve) recordings of action potentials in the frog heart stained with Merocyanine- 540. The lower panel, Optical recording of action potentials from different regions of the heart stained with di-4-ANEPPS: ventricular and atrial working myocardium, AV node, and Crista terminalis. Modified from Boukens et al and Efimov et al.[27, 74]
Although, optical mapping is often the method of choice in experimental cardiology there are some disadvantages of this technique that need to be considered. Excitation of the fluorescent dye has been shown to produce toxic free radicals and may cause death of cardiomyoctyes. This side effect is most prominent when single myocytes or monolayers are measured. Also, the excitation of deeper located layers cause light scattering and distortion of the optical signal [28, 31]. Another disadvantage is that contractions of the heart lead to changes in emission intensity related to motion artifacts not the membrane potential. Therefore, in order to accurately measure the shape of optical action potentials, the excitation and contraction must be pharmacologically uncoupled. A common uncoupler agent is blebbistatin [32], but cytochalasin D and 2,3-butane-dion monoxime have also been used.
Panoramic imaging
Although optical mapping and, to a lesser extent, conventional multi-electrode grids, increases spatial resolution, neither can track conduction when the activation front propagates outside the limited field of view. This hampers the reconstruction, and thereby interpretation, of the activation sequence, especially during complex re-entrant patterns. Panoramic imaging refers to optical imaging using multiple cameras or mirrors to measure from at least three different angles. This technique allows reconstruction of complete epicardial activation patterns[33] and has given insight into complex activation patterns during ventricular fibrillation. Figure14_4 is an example of a re-entrant activation pattern of a rabbit heart using panoramic optical mapping.[34, 35]
Figure14_4.
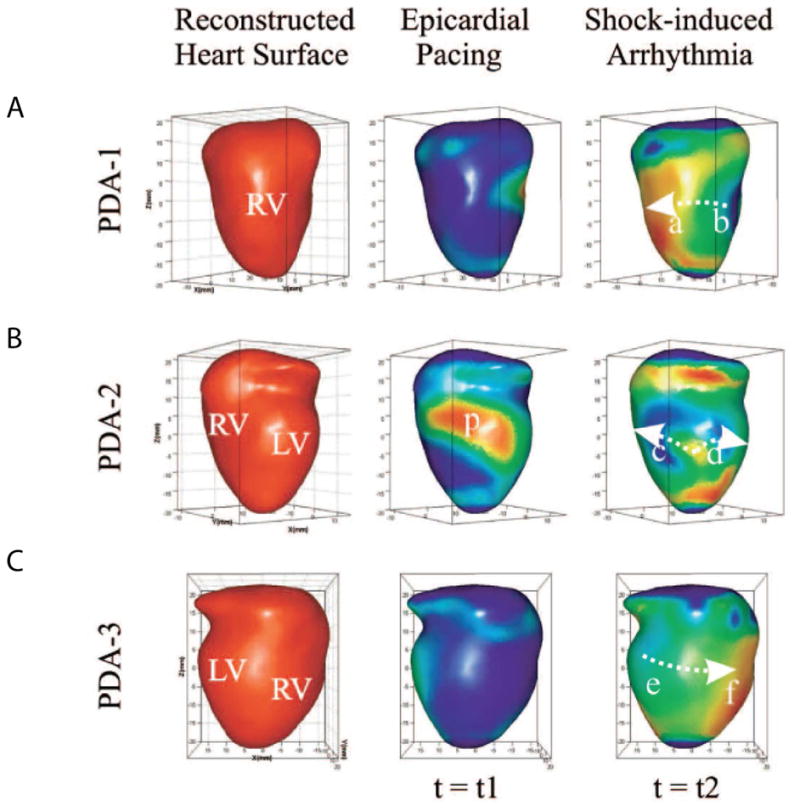
Reconstructed heart surface and epicardial action potential texture mapping. (A) Left: reconstructed heart surface visualized from projections of PDA arrays. Middle: epicardial action potential texture mapping during epicardial pacing (p in PDA-2 projection is the pacing site). Right: epicardial action potential texture mapping during shock-induced ventricular tachycardia. Modified from Qu et al. [75]
Another problem with conventional optical mapping is that a curved epicardial surface is projected onto a 2-dimensional sensor. This means that distance in the “Z” direction is not taken into account. This is a limitation, when conduction velocity is calculated, because it leads to underestimation of conduction velocity, especially near the edges of the field of view. Panoramic imaging enables the projection of a 3-dimensional conduction pattern on the surface of the heart.[36] Conduction velocity can be more precisely measured thereby improve our understanding of conduction during normal and re-entrant activation patterns.
Optical imaging of ventricular fibrillation
As mentioned above the optics of a set-up can be fined tuned to specific applications, providing control over the spatial resolution and depth of the recorded signals. The fine spatial resolution of optical mapping makes it an ideal platform for tracking the dynamics of ventricular fibrillation, pinpointing focal discharges and the critical points of reentrant wavefronts as well as the critical points that are created when energy is applied during electrotherapy. Chapter XX (Gray et al.) outlines how optical mapping can be used to study the mechanisms that maintain ventricular fibrillation including phase singularity tracking.
Bidomain Model of Cardiac Muscle
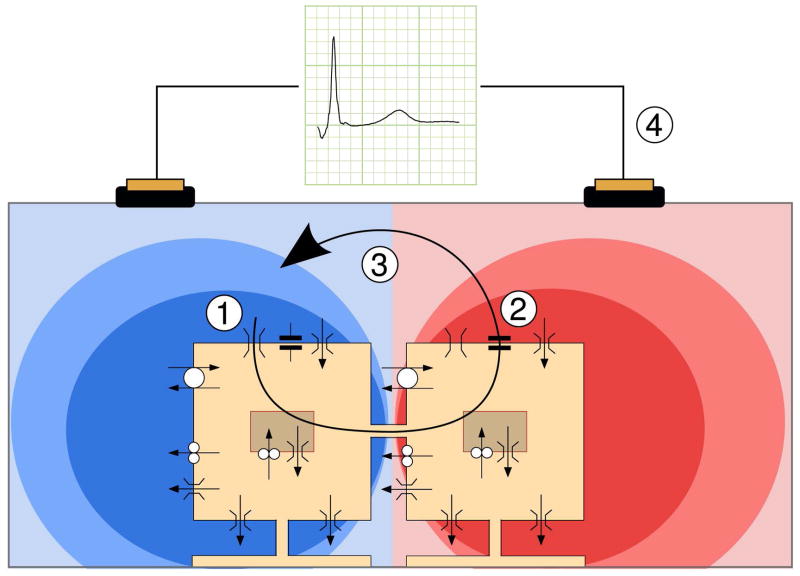
Activation of a myocyte causes passive flow of current into an adjacent quiescent myocyte through gap junctions. This leads to membrane depolarization of the adjacent myocyte and, when threshold is reached, activation of the sodium channels causing excitation. Since an electrical circuit needs to be closed in order to let current flow the intracellular current that flows from cell 1 to cell 2 leads to extracellular flow of current from cell 2 to cell 1. A schematic representation of the relation between intra and extra cellular potentials is shown in Figure14_5. This mechanism underlies propagation of the activation front in the myocardium.[19] Thus, propagation can be sub-divided to an intracellular domain, representing activation of myocytes and passive conduction through gap junction, and an extracellular domain, composed of all other tissue components. The Bidomain Model of Cardiac Muscle is based on this concept and was first published in the late 1970s.[37] The bidomain model describes the relation between intra and extracellular potentials thereby contributing to the understanding of unipolar electrograms and the simulation of the body surface electrocardiogram.[38] Current bidomain models use multiple membrane models to compute the intracellular domain and allow to simulate complete ventricular activation based on up to 100 million elements.[39] These so-called “Reaction-Diffusion” models make it possible to study the effect of a single ion current on local propagation and even on the body surface electrocardiogram. It is also possible to inject extracellular current and study the effect on intracellular electrophysiology. This approach was used by many groups to study the mechanism of defibrillation computationally.[40]
Figure14_5.
Principle underlying membrane-based heart models. Two model cells are depicted schematically, with their ion channels, pumps, and exchangers. Gap junctions connect the cells. In depolarizing cells, a large inward sodium current flows along its electrochemical gradient (1). This current passes through gap junctions to neighboring cells. There, part of it serves to charge the cell membrane (2) represented by a capacitor symbol, and another part leaks through potassium channels that are still open (3). The two parts form an outward current in this cell, and the current loop is closed in the interstitium and outside the heart (4), where it generates a potential field, schematically indicated here in red for positive potentials and blue for negative potentials. This potential field is picked up as an ECG. This figure is a courtesy of Dr. Mark Potse.[38]
Virtual Electrodes
Electrical stimulation
Programmed electrical stimulation is essential for studying electrophysiology of the intact myocardium. Stimulation is established by generating a potential difference between two electrodes, causing electrons to flow between the negative (cathode) and the positive (anode) electrode. If the two electrodes both make contact with the cardiac tissue and are in close proximity, this is called bipolar stimulation. If one electrode makes contact with cardiac tissue and the other (indifferent) electrode makes contact elsewhere, ground or the bath solution, it is called unipolar stimulation. When a unipolar cathode is used for stimulation then the tissue under the electrodes depolarizes, which leads to excitation. Adjacent virtual anodes hyperpolarize tissue and transiently slow activation in lateral directions. Anodal stimulation causes hyperpolarization under the electrode and depolarization under two virtual cathodes, which stimulate the tissue at the lateral borders of the hyperpolarized tissue. The current flow during anodal and cathodal stimulation will be discussed in more detail in the section “Virtual electrode make and break excitation”.
The method of stimulation may influence stimulation threshold or refractoriness of the tissue. For instance, the repolarizing effect of anodal stimulation may shorten action potential duration and lead to short refractory periods or even completely de-excite the tissue restoring full excitability.[41] During bipolar stimulation refractory periods are shorter than during cathodal stimulation as well due to anodal stimulation at the proximal electrode.[42] However, the incidence of inducing arrhythmias is not different between bipolar or unipolar stimulation, [43] unless anodal and cathodal shocks are considered, which do have significant differences in arrhythmogenic potential.
Virtual electrodes
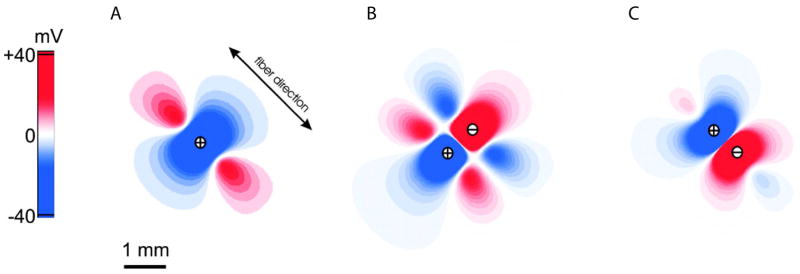
During cathodal stimulation the cardiac tissue right under the electrode depolarizes. However, the myocardium adjacent to the depolarized myocardium hyperpolarizes due to virtual anodes. Thus, the “real” cathode generates two “virtual” anodes. This phenomenon is referred to as “virtual electrodes”.[6, 44] To avoid confusion in the nomenclature, often investigators refer to all areas of positive and negative polarizations as “virtual electrodes”, regardless of their proximity to real stimulation electrodes. We will follow this convention. Figure14_6a shows a computed (passive bidomain model) potential field during central anodal stimulation in a two-dimensional cardiac tissue sheet. The center is highly hyperpolarized (red) whereas the lateral adjacent sides are highly depolarized (blue). In this example the fiber direction is diagonal. The depolarized field expands up and down and shows a “dog-bone-like” morphology. The morphology of the virtual electrode depends on the stimulus strength, fiber direction, and both extra and intracellular resistance.[45] A higher stimulus current causes an increase in the amplitude of positive and negative polarization of corresponding regions. Inversion of the current (i.e. cathodall stimulation) leads to the inverse potential field and virtual electrode pattern. Bipolar stimulation generates virtual electrodes as well.[46] The number of virtual electrodes that is generated depends on the location and spacing of the bipole with respect to the fiber direction under the electrodes. When the anode and the cathode are positioned perpendicular to the fiber direction a total of 6 virtual electrodes will be generated (Figure14_6b). If the electrodes are positioned in parallel with the fiber direction a total of 4 virtual electrodes are observed (Figure14_6c).[47] For comparison, the unipolar stimulation produces a total of 3 virtual electrodes.
Figure14_6.
Numerically simulated virtual electrode patterns for an interelectrode distance of 0.8 mm. Results were obtained from the passive two-dimensional bidomain model with unequal anisotropy ratios. A: 40 mA/cm anodal current applied to the center of the 8 × 8-mm square sheet; B: bipolar stimulation with the two electrodes located perpendicular to the direction of the fibers; C: bipolar stimulation with the electrodes located along the direction of the fibers. Zero level corresponds to the resting transmembrane potential (white). This figure is modified from Nikolski et al.[47]
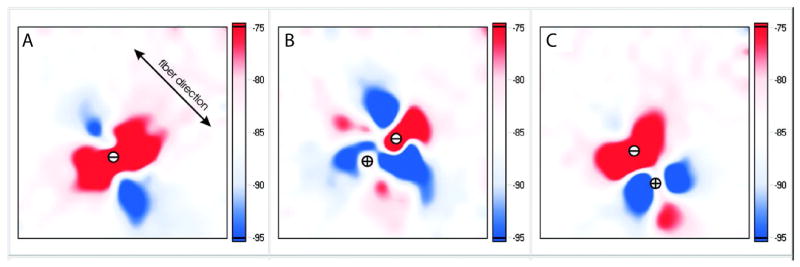
Optical imaging enables experimental testing of the virtual electrode hypothesis in ex vivo heart preparations. Figure14_7 shows the transmembrane potential during stimulation of rabbit epicardium. The measured potential field closely resembles the expected morphology based on the computer simulation.
Figure14_7.
Virtual electrode patterns optically recorded from a 4 × 4-mm area of the rabbit anterior epicardium during unipolar and bipolar stimulation. A: conventional “dogbone”-shaped virtual electrode polarizations (VEP) during unipolar cathodal stimulation. B: VEP during bipolar stimulation with a pacing dipole placed perpendicular to myocardial fibers. C: results of bipolar stimulation with electrodes along the fibers. The interelectrode distance was 0.8 mm. Images were collected in the middle of a 2-ms diastolic stimulus. This figure is modified from Nikolski et al.[47]
Virtual electrode make and break excitation
During electrical stimulation not only the “real” electrode can cause excitation but the simultaneously generated surrounding virtual electrodes can produce wavefronts as well. The wavefront will propagate from the virtual cathode to the virtual anode. The direction and lifetime of the induced wavefront is directly dependent of the specific VEP pattern. In this section we will only discuss unipolar cathodal and anodal stimulation, because it is directly relevant for understanding the mechanism of defibrillation, which will be reviewed below. There are four mechanisms of unipolar electrical stimulation: cathode make, anode make, cathode break and anode break.[48] The “make” excitation occurs just after the beginning of the stimulus pulse, whereas “break” excitation happens after the end of the pulse.
Cathodal make stimulation resembles normal activation of the cardiac tissue during direct injection of depolarizing current via a microelectrode. The negatively charged real cathode causes depolarization of the myocardium right under the electrode. This depolarization causes the membrane to reach excitation threshold and initiates an activation front. Depending on the stimulus current the activation front will start directly under the electrode or from a point farther from the electrode. Nearby negative virtual anodes will slow the conduction but ultimately will be depolarized by the actively propagating wavefront.
The mechanism of excitation during anodal make stimulation resembles that of cathode make stimulation. However, the positively charged real anode causes hyperpolarization of the myocardium right under the electrode. This means that excitation starts at the lateral sides near the virtual cathode. The amplitude of depolarization near virtual cathode during anodal stimulation is lower than near real cathode during cathodal stimulation. Therefore, the threshold of excitation is lower during cathode make than for anode make stimulation.
As mentioned above, break excitation happens at the end or break of the stimulus. Cathode break stimulation occurs when the myocardial tissue directly under the electrode is refractory and unexcitable. However, the shock does still de-excite the tissue at the virtual anodes, rapidly repolarizing the membrane potential even if the tissue was refractory. At the end of the stimulus the current diffuses to the hyperpolarized tissue, exiting to the myocardium through the virtual anodes. This leads to excitation. The path that is created by the shock is parallel with the fiber direction, and the propagation direction into excitable tissue is different than cathode make excitation. The virtual anode is usually much weaker than the real cathode and therefore cathode make excitation will occur over cathode break excitation.
During anodal break excitation the hyper excitable path is perpendicular to the fiber direction. Thus, after the stimulus pulse, the tissue at the virtual cathode repolarizes slowly allowing current to flow into the tissue directly under the anode, which was rapidly de-excited during the shock. This will lead to excitation and a wave front that will propagate transversely before conducting into the normal myocardium.
Mechanisms of Defibrillation
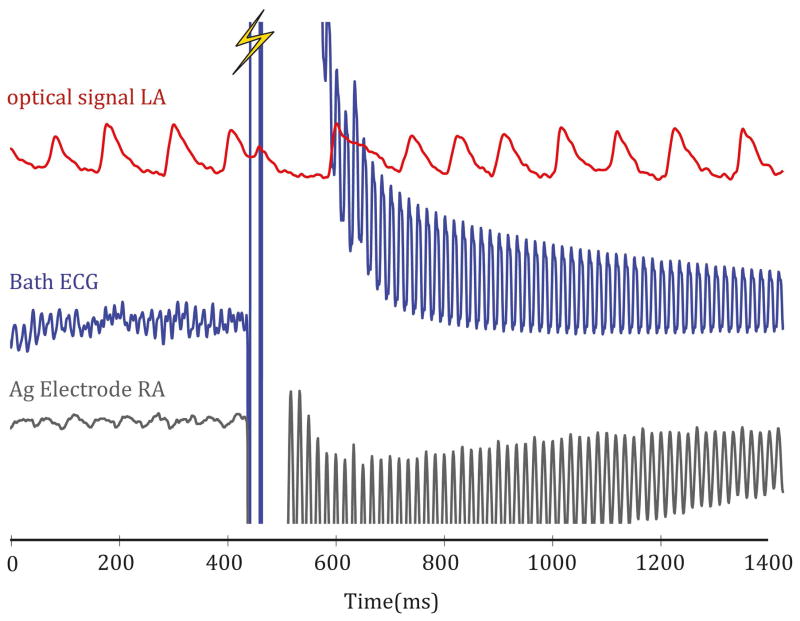
As a therapy, defibrillation has a simple objective: restore a synchronized rhythm to the entire myocardium by terminating fibrillation and allowing restoration of normal sinus rhythm. A large electrical shock has been known to successfully achieve this objective for over a century with a long history of clinical use.[5] However, the precise physiological mechanism of the electrical requirements for success has proven to be a much more complex problem. Across decades the principle hypotheses have been shifting and sometimes even contradictory. Optical mapping has played, and continues to play, a critical role in the evolution of the mechanistic hypotheses for successful defibrillation. Before the development of this technique, investigators were hindered by limitations in available recording instrumentation. Electrical shocks of near defibrillation threshold strengths produce large artifacts in signals recorded with both extracellular and intracellular electrodes. These artifacts overwhelm all intrinsic electrical activity in the presence of the applied electric field and blind investigators to the immediate post-shock tissue interactions. The polarization of the electrodes delays the recovery of the recording integrity even after the shock is completely delivered. Figure14_8 shows an example of this phenomenon from an ex vivo rabbit heart study. The optical and electrical signals are recorded simultaneously when the shock is delivered at the lightning bolt. Both the local bipolar electrogram in contact with the tissue and the far field bath electrode require >1000ms to recover with this instrumentation amplifier. Meanwhile the immediate shock-induced depolarization is visible in the optical signal as well as the delay until the arrhythmia resumes.
Figure14_8.
Example of shock-induced artifact on simultaneously acquired electrical and optical signals. These artifacts can be reduced with changes to the instrumentation but cannot be eliminated.
Some researchers developed creative attempts to minimize the time that the electrical signal was overloaded, including using a non-polarizable reference electrode (only useful if both the tissue and the field are uniform) or by switching amplifier gains or connectivity on the acquisition systems during shock delivery.[49] These techniques decreased the recovery lapse in recording time down to 20ms but it was still too long to observe the immediate shock response. Membrane bound potentiometric dyes translate the intrinsic electrical signal into an optical signal, which is isolated from the applied electric field but reflects the tissue’s response. In so doing optical mapping allows for the uninterrupted exclusive visualization of the electrical activity of the tissue before, during, and immediately after the shock application. The path of current from an externally applied field flows through the extracellular and intracellular subdomains of the myocardium differently, creating voltage gradients that result in changes in transmembrane potentials. The transmembrane changes are the driving forces of the shock-induced restoration of sinus rhythm through initiated wavefronts. Membrane potential dyes measure the electrical activity with specificity for the signal that is mechanistically determining a successful defibrillation that cannot be achieved with extracellular electrodes.
Historical Mechanisms of Defibrillation
The lingering shock artifacts on electrical recordings limited the ability to predict the post-shock response to applied electrical shocks. However, there were still many theories postulated from the available data on what makes for a successful defibrillation attempt and these theories evolved with advancing technology. The mechanistic theories were also shaped be the changing hypotheses of the substrates that maintain fibrillatory patterns in the heart. Most mechanistic principles are founded in ventricular fibrillation research and are subsequently applied to atrial fibrillation. The main premise of the early electrophysiological theories was that the electric field produced by the shock needed to be strong enough to stimulate the entire myocardium, including regions in various states of repolarization and refractoriness. This theory of total extinction states that only a homogenous depolarization interrupted the fibrillatory patterns and reset the tissue.[50]
Some researchers amended this theory asserting that it was sufficient to capture enough tissue to halt all activation fronts, which did not necessarily include the entire excitable epicardium.[51] From this idea the critical mass (CM) hypothesis was formed. The CM hypothesis began as an investigation into the mechanism of maintaining continuous ventricular fibrillation but was quickly applied to achieving successful defibrillation as well. Since the early 20th century, scientists proposed that there existed a minimum mass of tissue that was able to maintain a sustained fibrillatory pattern.[17] If a mass below that limit was selectively isolated, a continuous arrhythmia could not be induced. Correspondingly, a shock could succeed if it interrupted enough activation fronts to isolate the patterns to small regions below the critical mass. Any remaining activation fronts would then self-terminate, leading to successful restoration of sinus rhythm.[52]
An alternate theory born of the same early concept is the extension of refractoriness. This idea suggested that an applied shock uniformly extended the refractory period of the captured tissue. Extending action potential durations across the tissue resulted in simultaneous recovery, which wipes away the “memory” of the fibrillatory waves maintaining the arrhythmia.[53] A third theory began to gain ground in the late 1960s. Again, this theory was formed while considering VF induction. Experimentally, applying a shock to the tissue during the vulnerable period of repolarization can induce VF. It was observed that there was an upper limit in shock strength that would induce an arrhythmia.[54] The value empirically corresponded well to the defibrillation threshold shock strength. This observation led researchers to consider whether they could predict the location of reentry caused by incrementally increasing shock strength until they reached the upper limit of vulnerability. From these studies, it was determined that the earliest activation after a shock delivery was located in regions of lowest potential gradient. Therefore in order to be successful a shock must halt activation fronts and achieve a sufficient potential gradient everywhere in the myocardium so as to not re-induce an arrhythmia.
Optical Mapping Shapes Defibrillation Mechanism Theories
Although these theories are not necessarily mutually exclusive, the introduction of optical mapping began to clarify the conflicting elements of existing hypotheses. Optical mapping experiments could target both root causes of the failure of defibrillation: 1) the persistence of pre-shock fibrillatory waves and 2) successful defibrillation followed by re-initiation of new shock-induced wavefronts. Dillon and colleagues conducted the first optical mapping study directly applied to defibrillation mechanisms in 1991.[55] During this study defibrillation shocks were delivered during various phases of a paced rhythm between ring electrodes around the base and apex of isolated hearts. By analyzing the latency between upstroke and shock delivery, the authors could estimate the amount of tissue that is directly captured by various shock strengths compared to tissue that is excited by a shock induced wavefront originating elsewhere in the tissue. Additionally, the authors observed a coupling interval dependent increase in the optical action potential duration in the region of tissue they observed. A shock always elicited an increase in action potential duration in this study. However, the prolongation was not uniform across the ventricle because the tissue was spatially dispersed in states of refractoriness based on the coupling interval. They also did not clearly observe a successful defibrillation, followed by re-induction in the case of failure. Therefore a new theory was proposed called progressive depolarization, attempting to connect each of the existing theories with observed phenomena via optical mapping. This theory states, “Progressively stronger shocks depolarize, progressively more refractory myocardium, to progressively prevent postshock wavefronts, and prolong and synchronize postshock repolarization, in a progressively larger volume of the ventricle, to progressively decrease the probability of fibrillation after the shock”.[56] Perhaps the most interesting concept out of this theory is the idea the defibrillation does not have to happen instantaneously, but rather in a continuous fashion as the response spreads spatially across the myocardium. This hypothesis failed to notice that electric shock is capable of both depolarizing and hyperpolarizing the tissue due to virtual cathode and virtual anode effects. If the hyperpolarization is ignored then the progressive depolarization hypothesis presents an incomplete description of defibrillation.
Over two decades of experiments conducted with optical mapping techniques have provided further insight into the mechanisms of defibrillation. This technique has been used to study the effects of electrostimulation across multiple scales, including single cell, cellular monolayers, tissue wedges, and intact hearts. As more questions arose based on how changes in the shape of the applied shocks altered the defibrillation mechanisms, optical mapping experiments rose to attempt to provide an answer. Although computer models were created to predict the cellular response to an applied electric field, voltage-sensitive dyes provided the experimental evidence to rigorously assess these predictions. By shocking isolated myocytes that were aligned with the applied electric field, researchers were able to observe that the transmembrane potential is distributed across the length of a cell when a shock is applied.[57] This phenomenon results in a hyperpolarized end near the anode and a depolarized end near the cathode. The strength, timing, and polarity of the shock determine the distribution of the transmembrane potential differences.[58] However, an isolated myocyte cannot be used to study the response of intact tissue to electrical stimulation, therefore, many studies were conducted in cell culture and isolated hearts of various mammalian species.
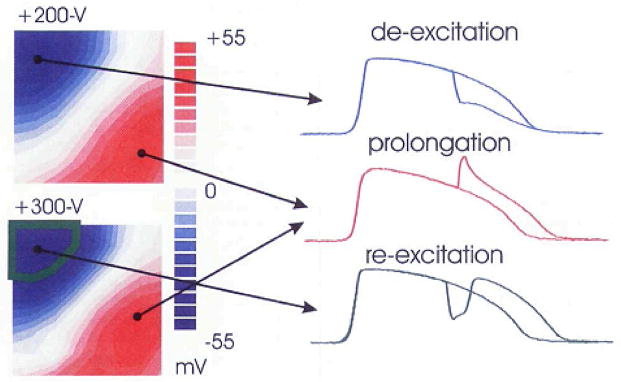
The virtual electrode hypothesis of defibrillation is presently the most comprehensive explanation of defibrillation. It is based on solid experimental evidence and theoretical foundation.[59] Numerous optical mapping studies presented evidence that in addition to depolarization, shock also was capable to hyper-polarize or de-excite other regions of the heart resulting in action potential shortening instead of the consistent prolongation observed in Dillon’s first study. Figure14_9 shows the results of one such study from an anterior rabbit ventricle with recorded optical action potentials displaying both shock-induced shortening (observed at the virtual anode) and prolongation (observed at the virtual cathode). This observation confirms the Virtual Electrode Hypothesis that was described in detail in the beginning of this chapter. The emergence of the virtual electrode hypothesis provided an alternative theory for defibrillation failure that was not tied to only potential field gradients. Subsequent generalized activation function theory was formulated by Sobie et al, which laid the theoretical foundation for the virtual electrode hypothesis.[60] The generalized activating function shows mathematically how a combination of field gradients, underlying heterogeneities in refractoriness and anatomical discontinuities in conduction properties could create neighboring regions of virtual anodes and cathodes, which hyperpolarize and depolarize tissue serving as secondary sources to stimulate the tissue or to induce new fibrillatory wavefronts [9, 59, 61, 62].
Figure14_9.
Examples of three local effects to applied shocks: de-excitation, prolongation and re-excitation demonstrating heterogeneous effects on action potential duration. The shock induced responses are shown superimposed on top of control optical action potentials from the same point pre-shock. Modified from Efimov et al.[76]
Using cellular monolayers with patterned regions of discontinuity in the conduction properties, researchers were able to demonstrate how virtual electrode shapes and positions were predictably dependent on shock polarity.[63] The spatial regions of hyperpolarization and depolarization mirrored each other with reversed polarity. Additional studies showed that the chirality of the VEP-induced reentrant path could be predicted from the postshock VEP pattern as the wavefront moves into the de-excited region.[64] Combining the research of polarity dependent spatial patterns of secondary sources and the reentry chirality dependence, optical mapping experiments were used to explain the mechanism for monophasic anodal shock superiority compared to cathodal shocks.[65] The VEP distribution after anodal shocks behaves like a sink; with the induced pathways traveling inward and colliding with each other to self terminate any shock-induced wavefronts. The VEP distribution of cathodal shocks behaves more like a source, leaving more spatial room to develop into a sustainable reentrant wave. Figure14_10A illustrates the sink phenomenon of anodal shocks with a schematic drawing showing a simple VEP pattern and the crowded inward propagation that is more difficult for a reentrant path to escape. Alternatively Figure14_10B shows the source behavior of cathodal shocks, illustrating the space that the virtual anodes provide for a reentrant path to thrive and direct propagation outward to the excitable regions. The pattern in the schematic also shows how phase singularities (represented by solid black circles) can arise at the transition between the virtual electrodes with opposing polarity. In this case, the cathodal shock induces quatrefoil reentry. The conduction velocity of the induced reentry is also dependent on the degree of polarization in the virtual anode; a more negative polarization increases conduction velocity. If the conduction is fast enough, the propagating wave will hit a line of conduction block before this tissue can recovery and an induced wavefront with self- terminate. Furthermore, optical mapping helped reveal the mechanism behind the empirical observation that biphasic shocks were superior compared to monophasic shocks. Biphasic shocks immediately reverse the polarity and distribution of the virtual electrodes, greatly decreasing the heterogeneity in the post-shock tissue response. The mirrored VEP pattern also removes the excitable de-excited tissue, reducing the risk of VEP-induced phase singularities.[66] Another example of the application of optical mapping to explain defibrillation optimization is observed when comparing the VEP elicited by various waveform shapes. Multiple studies have shown that ascending waveforms are advantageous empirically, resulting in a lower defibrillation threshold. Mechanistically this is because the ascending VEP pattern achieves a greater degree of polarization, leading to a faster conduction velocity and an induced wavefront that is more susceptible to self-termination.
Figure14_10.
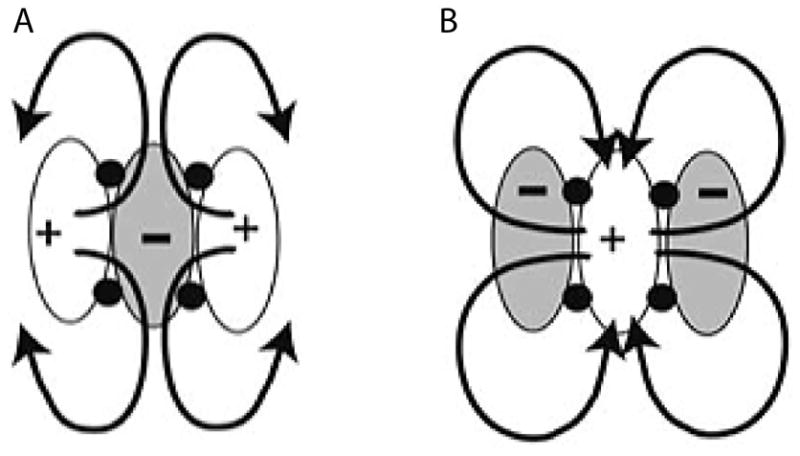
Schematic of shock induced effects that can lead to re-entry. A) Post-shock activation of an anodal shock. B) Post-shock activation of a cathodal shock, which is more likely to sustain reentry. Modified from Yamanouchi et al.[77]
Virtual Electrode Hypothesis of Defibrillation in the Clinic
Optical mapping studies conducted in 1990s have helped to explain the mechanisms of electrical stimulation of the myocardium by point near-field stimulation and by far field shocks. Prior to the advent of voltage-sensitive dyes this was impossible. Subsequent optical mapping studies focusing on defibrillation explained numerous empirically known phenomena including: superiority of anodal versus cathodal monophasic shock defibrillation, superiority of cathodal versus anodal pacing, superiority of biphasic versus monophasic defibrillation, lower and upper limits of vulnerability, role of electroporation, etc. However, the defibrillation paradigm used presently is not without limitations. It requires significant shock strength to achieve successful defibrillation. Several studies have suggested that such strong electric shocks could be associated with myocardial damage and lead to increased mortality and progression of heart failure.[67] Therefore, researchers are looking for new methods for reducing the energy required for defibrillation. One such method has emerged from the finding that local tissue heterogeneities lead to the development of virtual cathodes and anodes during far field stimulation.[68] When a low energy shock is applied during critical phase of reentry, it can unpin and terminate a reentry-based arrhythmia.[69] Subsequent optical mapping studies have explained the mechanism of this low energy approach [34] and can be used to guide the development of new defibrillation strategies, some of which are currently being tested clinically.[70, 71]
Conclusion
Optical mapping with voltage sensitive dyes has revolutionized cardiac electrophysiology, providing a platform for high-resolution investigation of fundamental mechanisms of normal and pathological electrophysiological processes. Cardiac conduction and repolarization, re-entry and focal activity, pacing and defibrillation could not be fully understood without this powerful technology. However, we would advocate that the studies of defibrillation and pacing are especially indebted to optical mapping, because alternative electrode-based techniques could not be used in studies involving application of strong electric fields. Optical mapping is the critically important methodology, which allowed elucidating the mechanisms of pacing and defibrillation.
References
- 1.Kong CY, Nattinger KJ, Hayeck TJ, Omer ZB, Wang YC, Spechler SJ, et al. The impact of obesity on the rise in esophageal adenocarcinoma incidence: estimates from a disease simulation model. Cancer Epidemiol Biomarkers Prev. 2011 Nov;20:2450–6. doi: 10.1158/1055-9965.EPI-11-0547. [DOI] [PMC free article] [PubMed] [Google Scholar]
- 2.Huikuri HV, Castellanos A, Myerburg RJ. Sudden death due to cardiac arrhythmias. N Engl J Med. 2001 Nov 15;345:1473–82. doi: 10.1056/NEJMra000650. [DOI] [PubMed] [Google Scholar]
- 3.Jeffrey K. Machines in Our Hearts: The Cardiac Pacemaker, the Implantable Defibrillator, and American Health Care. Baltimore: Johns Hopkins University Press; 2001. [Google Scholar]
- 4.Janse MJ, Rosen MR. History of arrhythmias. Handb Exp Pharmacol. 2006:1–39. doi: 10.1007/3-540-29715-4_1. [DOI] [PubMed] [Google Scholar]
- 5.Gutbrod SR, Efimov IR. Two centuries of resuscitation. J Am Coll Cardiol. 2013 Dec 3;62:2110–1. doi: 10.1016/j.jacc.2013.07.026. [DOI] [PubMed] [Google Scholar]
- 6.Sepulveda NG, Roth BJ, Wikswo JP. Current injection into a two-dimensional anisotropic bidomain. Biophysical Journal. 1989 May;55:987–999. doi: 10.1016/S0006-3495(89)82897-8. [DOI] [PMC free article] [PubMed] [Google Scholar]
- 7.Sepulveda NG, Wikswo JP. Bipolar stimulation of cardiac tissue using an anisotropic bidomain model. Journal of Cardiovascular Electrophysiology. 1994 Mar;5:258–267. doi: 10.1111/j.1540-8167.1994.tb01162.x. [DOI] [PubMed] [Google Scholar]
- 8.Cheng Y, Mowrey KA, Van Wagoner DR, Tchou PJ, Efimov IR. Virtual Electrode Induced Re-excitation: A Basic Mechanism of Defibrillation. Circulation Research. 1999;85:1056–1066. doi: 10.1161/01.res.85.11.1056. [DOI] [PubMed] [Google Scholar]
- 9.Efimov IR, Cheng YN, Biermann M, Van Wagoner DR, Mazgalev T, Tchou PJ. Transmembrane voltage changes produced by real and virtual electrodes during monophasic defibrillation shock delivered by an implantable electrode. Journal of Cardiovascular Electrophysiology. 1997;8:1031–1045. doi: 10.1111/j.1540-8167.1997.tb00627.x. [DOI] [PubMed] [Google Scholar]
- 10.Wikswo JP, Lin SF, Abbas RA. Virtual electrodes in cardiac tissue: a common mechanism for anodal and cathodal stimulation. Biophysical Journal. 1995 Dec;69:2195–2210. doi: 10.1016/S0006-3495(95)80115-3. [DOI] [PMC free article] [PubMed] [Google Scholar]
- 11.Hoffman BF, Rosen MR. Cellular mechanisms for cardiac arrhythmias. Circ Res. 1981 Jul;49:1–15. doi: 10.1161/01.res.49.1.1. [DOI] [PubMed] [Google Scholar]
- 12.Mines GR. On dynamic equilibrium of the heart. J Physiol. 1913;46:349–382. doi: 10.1113/jphysiol.1913.sp001596. [DOI] [PMC free article] [PubMed] [Google Scholar]
- 13.de Bakker JM, van Capelle FJ, Janse MJ, Wilde AA, Coronel R, Becker AE, et al. Reentry as a cause of ventricular tachycardia in patients with chronic ischemic heart disease: electrophysiologic and anatomic correlation. Circulation. 1988 Mar;77:589–606. doi: 10.1161/01.cir.77.3.589. [DOI] [PubMed] [Google Scholar]
- 14.Allessie MA, Bonke FI, Schopman FJ. Circus movement in rabbit atrial muscle as a mechanism of tachycardia. III. The “l” eading circle” concept: a new model of circus movement in cardiac tissue without the involvement of an anatomical obstacle. Circ Res. 1977 Jul;41:9–18. doi: 10.1161/01.res.41.1.9. [DOI] [PubMed] [Google Scholar]
- 15.Mines GR. On circulating excitations in heart muscle and their possible relation to tachycardia and fibrillation. Trans Roy Soc Can. 1914:43–52. [Google Scholar]
- 16.Wiener N, Rosenblueth A. The mathematical formulation of the problem of conduction of impulses in a network of connected excitable elements, specifically in cardiac muscle. Arch Inst Cardiol Mex. 1946 Jul;16:205–65. [PubMed] [Google Scholar]
- 17.Garrey W. The nature of fibrillary contraction of the heart: its relation to tissue mass and form. American journal of Physiology. 1914;33:17. [Google Scholar]
- 18.Fast VG, Kleber AG. Role of wavefront curvature in propagation of cardiac impulse. Cardiovasc Res. 1997 Feb;33:258–71. doi: 10.1016/s0008-6363(96)00216-7. [DOI] [PubMed] [Google Scholar]
- 19.Kleber AG, Rudy Y. Basic mechanisms of cardiac impulse propagation and associated arrhythmias. Physiol Rev. 2004 Apr;84:431–88. doi: 10.1152/physrev.00025.2003. [DOI] [PubMed] [Google Scholar]
- 20.Spach MS, Barr RC, Serwer GA, Kootsey JM, Johnson EA. Extracellular potentials related to intracellular action potentials in the dog Purkinje system. Circ Res. 1972 May;30:505–19. doi: 10.1161/01.res.30.5.505. [DOI] [PubMed] [Google Scholar]
- 21.Dower GE. In Defence of the Intrinsic Deflection. Br Heart J. 1962 Jan;24:55–60. doi: 10.1136/hrt.24.1.55. [DOI] [PMC free article] [PubMed] [Google Scholar]
- 22.Pogwizd SM, Corr PB. Reentrant and nonreentrant mechanisms contribute to arrhythmogenesis during early myocardial ischemia: results using three-dimensional mapping. Circ Res. 1987 Sep;61:352–71. doi: 10.1161/01.res.61.3.352. [DOI] [PubMed] [Google Scholar]
- 23.Shenassa BM, Briethardt G. Cardiac Mapping. 4. Elsmford Blackwell Publishing/Futura Division; 2013. [Google Scholar]
- 24.Taccardi B, Arisi G, Macchi E, Baruffi S, Spaggiari S. A new intracavitary probe for detecting the site of origin of ectopic ventricular beats during one cardiac cycle. Circulation. 1987 Jan;75:272–81. doi: 10.1161/01.cir.75.1.272. [DOI] [PubMed] [Google Scholar]
- 25.Josephson ME, Horowitz LN, Farshidi A. Continuous local electrical activity. A mechanism of recurrent ventricular tachycardia. Circulation. 1978 Apr;57:659–65. doi: 10.1161/01.cir.57.4.659. [DOI] [PubMed] [Google Scholar]
- 26.Durrer D, Schoo L, Schuilenburg RM, Wellens HJ. The role of premature beats in the initiation and the termination of supraventricular tachycardia in the Wolff-Parkinson-White syndrome. Circulation. 1967 Nov;36:644–62. doi: 10.1161/01.cir.36.5.644. [DOI] [PubMed] [Google Scholar]
- 27.Boukens B, Efimov I. A Century of Optocardiography. IEEE Rev Biomed Eng. 2013 Oct 23; doi: 10.1109/RBME.2013.2286296. [DOI] [PMC free article] [PubMed] [Google Scholar]
- 28.Bishop MJ, Gavaghan DJ, Trayanova NA, Rodriguez B. Photon scattering effects in optical mapping of propagation and arrhythmogenesis in the heart. J Electrocardiol. 2007 Nov-Dec;40:S75–80. doi: 10.1016/j.jelectrocard.2007.06.020. [DOI] [PMC free article] [PubMed] [Google Scholar]
- 29.Janks DL, Roth BJ. Averaging over depth during optical mapping of unipolar stimulation. IEEE Trans Biomed Eng. 2002 Sep;49:1051–4. doi: 10.1109/TBME.2002.802057. [DOI] [PubMed] [Google Scholar]
- 30.Efimov I, Salama G. The future of optical mapping is bright: RE: review on: “O” ptical Imaging of Voltage and Calcium in Cardiac Cells and Tissues. In: Jalife Herron Leeand., editor. Circ Res. Vol. 110. May 11, 2012. pp. e70–1. [DOI] [PubMed] [Google Scholar]
- 31.Ramshesh VK, Knisley SB. Spatial localization of cardiac optical mapping with multiphoton excitation. J Biomed Opt. 2003 Apr;8:253–9. doi: 10.1117/1.1559831. [DOI] [PubMed] [Google Scholar]
- 32.Fedorov VV, Lozinsky IT, Sosunov EA, Anyukhovsky EP, Rosen MR, Balke CW, et al. Application of blebbistatin as an excitation-contraction uncoupler for electrophysiologic study of rat and rabbit hearts. Heart Rhythm. 2007 May;4:619–26. doi: 10.1016/j.hrthm.2006.12.047. [DOI] [PubMed] [Google Scholar]
- 33.Kay MW, Amison PM, Rogers JM. Three-dimensional surface reconstruction and panoramic optical mapping of large hearts. IEEE Trans Biomed Eng. 2004;51:1219–1229. doi: 10.1109/TBME.2004.827261. [DOI] [PubMed] [Google Scholar]
- 34.Ripplinger CM, Lou Q, Li W, Hadley J, Efimov IR. Panoramic imaging reveals basic mechanisms of induction and termination of ventricular tachycardia in rabbit heart with chronic infarction: implications for low-voltage cardioversion. Heart Rhythm. 2009 Jan;6:87–97. doi: 10.1016/j.hrthm.2008.09.019. [DOI] [PMC free article] [PubMed] [Google Scholar]
- 35.Rogers JM, Walcott GP, Gladden JD, Melnick SB, Kay MW. Panoramic optical mapping reveals continuations epicardial reentry during ventricular fibrillation in the isolated swine heart. Biophys. 2007;92:1090–1095. doi: 10.1529/biophysj.106.092098. [DOI] [PMC free article] [PubMed] [Google Scholar]
- 36.Lou Q, Li W, Efimov IR. The role of dynamic instability and wavelength in arrhythmia maintenance as revealed by panoramic imaging with blebbistatin vs. 2,3-butanedione monoxime. Am J Physiol Heart Circ Physiol. 2012 Jan 1;302:H262–9. doi: 10.1152/ajpheart.00711.2011. [DOI] [PMC free article] [PubMed] [Google Scholar]
- 37.Miller WT, Geselowitz DB. Simulation studies of the electrocardiogram. I. The normal heart. Circ Res. 1978 Aug;43:301–15. doi: 10.1161/01.res.43.2.301. [DOI] [PubMed] [Google Scholar]
- 38.Potse M. Mathematical modeling and simulation of ventricular activation sequences: implications for cardiac resynchronization therapy. J Cardiovasc Transl Res. 2012 Apr;5:146–58. doi: 10.1007/s12265-011-9343-6. [DOI] [PMC free article] [PubMed] [Google Scholar]
- 39.Niederer S, Mitchell L, Smith N, Plank G. Simulating human cardiac electrophysiology on clinical time-scales. Front Physiol. 2011;2:14. doi: 10.3389/fphys.2011.00014. [DOI] [PMC free article] [PubMed] [Google Scholar]
- 40.Trayanova N, Plank G, Rodriguez B. What have we learned from mathematical models of defibrillation and postshock arrhythmogenesis? Application of bidomain simulations. Heart Rhythm. 2006 Oct;3:1232–5. doi: 10.1016/j.hrthm.2006.04.015. [DOI] [PMC free article] [PubMed] [Google Scholar]
- 41.Mehra R, Furman S, Crump JF. Vulnerability of the mildly ischemic ventricle to cathodal, anodal, and bipolar stimulation. Circ Res. 1977 Aug;41:159–66. doi: 10.1161/01.res.41.2.159. [DOI] [PubMed] [Google Scholar]
- 42.Mehra R, Furman S. Comparison of cathodal, anodal, and bipolar strength-interval curves with temporary and permanent pacing electrodes. Br Heart J. 1979 Apr;41:468–76. doi: 10.1136/hrt.41.4.468. [DOI] [PMC free article] [PubMed] [Google Scholar]
- 43.Stevenson WG, Wiener I, Weiss JN. Comparison of bipolar and unipolar programmed electrical stimulation for the initiation of ventricular arrhythmias: significance of anodal excitation during bipolar stimulation. Circulation. 1986 Apr;73:693–700. doi: 10.1161/01.cir.73.4.693. [DOI] [PubMed] [Google Scholar]
- 44.Furman S, Hurzeler P, Parker B. Clinical Thresholds of Endocardial Cardiac Stimulation: A long-Term Study. Journal of Surgical Research. 1975;19:149–155. doi: 10.1016/0022-4804(75)90074-8. [DOI] [PubMed] [Google Scholar]
- 45.Wikswo Jp, Jr, Wisialowski TA, Altemeier WA, Balser JR, Kopelman HA, Roden DM. Virtual cathode effects during stimulation of cardiac muscle. Two-dimensional in vivo experiments. Circulation Research. 1991 Feb;68:513–530. doi: 10.1161/01.res.68.2.513. [DOI] [PubMed] [Google Scholar]
- 46.Nikolski V, Efimov IR. Virtual electrode polarization of ventricular epicardium during bipolar stimulation. J Cardiovasc Electrophysiol. 2000;11:605. doi: 10.1111/j.1540-8167.2000.tb00018.x. [DOI] [PubMed] [Google Scholar]
- 47.Nikolski VP, Sambelashvili AT, Efimov IR. Mechanisms of make and break excitation revisited: paradoxical break excitation during diastolic stimulation. Am J Physiol Heart Circ Physiol. 2002;282:H565–H575. doi: 10.1152/ajpheart.00544.2001. [DOI] [PubMed] [Google Scholar]
- 48.Dekker E. Direct current make and break thresholds for pacemaker electrodes on the canine ventricle. Circulation Research. 1970;27:811–823. doi: 10.1161/01.res.27.5.811. [DOI] [PubMed] [Google Scholar]
- 49.Chattipakorn N, KenKnight BH, Rogers JM, Walker RG, Walcott GP, Rollins DL, et al. Locally propagated activation immediately after internal defibrillation. Circulation. 1998 Apr 14;97:1401–10. doi: 10.1161/01.cir.97.14.1401. [DOI] [PubMed] [Google Scholar]
- 50.Hooker DR, Kouwenhoven WB, Langworthy OR. The effect of alternating electrical currents on the heart. Amer J Physiol. 1933;103:444–454. [Google Scholar]
- 51.Wiggers CJ. The physiological basis for cardiac resuscitation from ventricular fibrillation- method for serial defibrillation. American Heart Journal. 1940;20:413–422. [Google Scholar]
- 52.Zipes DP, Fischer J, King RM, Nicoll Ad, Jolly WW. Termination of ventricular fibrillation in dogs by depolarizing a critical amount of myocardium. Am J Cardiol. 1975 Jul;36:37–44. doi: 10.1016/0002-9149(75)90865-6. [DOI] [PubMed] [Google Scholar]
- 53.Sweeney RJ, Gill RM, Steinberg MI, Reid PR. Ventricular refractory period extension caused by defibrillation shocks. Circulation. 1990 Sep;82:965–72. doi: 10.1161/01.cir.82.3.965. [DOI] [PubMed] [Google Scholar]
- 54.Fabiato A, Coumel P, Gourgon R, Saumont R. The threshold of synchronous response of the myocardial fibers. Application to the experimental comparison of the efficacy of different forms of electroshock defibrillation. Arch Mal Coeur Vaiss. 1967 Apr;60:527–44. [PubMed] [Google Scholar]
- 55.Dillon SM. Optical recordings in the rabbit heart show that defibrillation strength shocks prolong the duration of depolarization and the refractory period. Circ Res. 1991 Sep;69:842–56. doi: 10.1161/01.res.69.3.842. [DOI] [PubMed] [Google Scholar]
- 56.Dillon SM, Kwaku KF. Progressive depolarization: a unified hypothesis for defibrillation and fibrillation induction by shocks. J Cardiovasc Electrophysiol. 1998 May;9:529–52. doi: 10.1111/j.1540-8167.1998.tb01847.x. [DOI] [PubMed] [Google Scholar]
- 57.Knisley SB, Blitchington TF, Hill BC, Grant AO, Smith WM, Pilkington TC, et al. Optical measurements of transmembrane potential changes during electric field stimulation of ventricular cells. Circ Res. 1993 Feb;72:255–70. doi: 10.1161/01.res.72.2.255. [DOI] [PubMed] [Google Scholar]
- 58.Cheng DK, Tung L, Sobie EA. Nonuniform responses of transmembrane potential during electric field stimulation of single cardiac cells. Am J Physiol. 1999 Jul;277:H351–62. doi: 10.1152/ajpheart.1999.277.1.H351. [DOI] [PubMed] [Google Scholar]
- 59.Ripplinger CME, Igor R. The virtual electrode hypothesis of defibrillation. In: IRE, et al., editors. Cardiac Bioelectric Therapy: Mechanisms and Practical Implications. Springer Science+Business Media; 2009. [Google Scholar]
- 60.Sobie EA, Susil RC, Tung L. A generalized activating function for predicting virtual electrodes in cardiac tissue. Biophysical Journal. 1997;73:1410–1423. doi: 10.1016/S0006-3495(97)78173-6. [DOI] [PMC free article] [PubMed] [Google Scholar]
- 61.Gillis AM, Fast VG, Rohr S, Kleber AG. Mechanism of ventricular defibrillation. The role of tissue geometry in the changes in transmembrane potential in patterned myocyte cultures. Circulation. 2000 May 23;101:2438–45. doi: 10.1161/01.cir.101.20.2438. [DOI] [PubMed] [Google Scholar]
- 62.Fast VG, Rohr S, Gillis AM, Kleber AG. Activation of cardiac tissue by extracellular electrical shocks: formation of ‘secondary sources’ at intercellular clefts in monolayers of cultured myocytes. Circ Res. 1998 Feb 23;82:375–85. doi: 10.1161/01.res.82.3.375. [DOI] [PubMed] [Google Scholar]
- 63.White JB, Walcott GP, Pollard AE, Ideker RE. Myocardial discontinuities: a substrate for producing virtual electrodes that directly excite the myocardium by shocks. Circulation. 1998 May 5;97:1738–45. doi: 10.1161/01.cir.97.17.1738. [DOI] [PubMed] [Google Scholar]
- 64.Cheng Y, Nikolski V, Efimov IR. Reversal of repolarization gradient does not reverse the chirality of shock-induced reentry in the rabbit heart. J Cardiovasc Electrophysiol. 2000 Sep;11:998–1007. doi: 10.1111/j.1540-8167.2000.tb00172.x. [DOI] [PubMed] [Google Scholar]
- 65.Yamanouchi YC, Tchou Y, PJ, Efimov IR. The mechanisms of vulnerable window: the role of virtual electrodes and shock polarity. Can J Physiol and Pharmacol. 2001;79:25–33. [PubMed] [Google Scholar]
- 66.Efimov IR, Cheng Y, Van Wagoner DR, Mazgalev T, Tchou PJ. Virtual electrode-induced phase singularity: a basic mechanism of defibrillation failure. Circ Res. 1998 May 4;82:918–25. doi: 10.1161/01.res.82.8.918. [DOI] [PubMed] [Google Scholar]
- 67.Tereshchenko LG, Faddis MN, Fetics BJ, Zelik KE, Efimov IR, Berger RD. Transient local injury current in right ventricular electrogram after implantable cardioverter-defibrillator shock predicts heart failure progression. J Am Coll Cardiol. 2009 Aug 25;54:822–8. doi: 10.1016/j.jacc.2009.06.004. [DOI] [PMC free article] [PubMed] [Google Scholar]
- 68.Fishler MG. The transient far-field response of a discontinuous one-dimensional cardiac fiber to subthreshold stimuli. IEEE Trans Biomed Eng. 1997;44:10–18. doi: 10.1109/10.553709. [DOI] [PubMed] [Google Scholar]
- 69.Ripplinger CM, Krinsky VI, Nikolski VP, Efimov IR. Mechanisms of unpinning and termination of ventricular tachycardia. Am J Physiol Heart Circ Physiol. 2006 doi: 10.1152/ajpheart.01300.2005. [DOI] [PubMed] [Google Scholar]
- 70.Janardhan AH, Gutbrod SR, Li W, Lang D, Schuessler RB, Efimov IR. Multistage electrotherapy delivered through chronically-implanted leads terminates atrial fibrillation with lower energy than a single biphasic shock. J Am Coll Cardiol. 2014 Jan 7–14;63:40–8. doi: 10.1016/j.jacc.2013.07.098. [DOI] [PMC free article] [PubMed] [Google Scholar]
- 71.Janardhan AH, Li W, Fedorov VV, Yeung M, Wallendorf MJ, Schuessler RB, et al. A novel low-energy electrotherapy that terminates ventricular tachycardia with lower energy than a biphasic shock when antitachycardia pacing fails. J Am Coll Cardiol. 2012 Dec 11;60:2393–8. doi: 10.1016/j.jacc.2012.08.1001. [DOI] [PMC free article] [PubMed] [Google Scholar]
- 72.Comtois P, Kneller J, Nattel S. Of circles and spirals: bridging the gap between the leading circle and spiral wave concepts of cardiac reentry. Europace. 2005 Sep;7(Suppl 2):10–20. doi: 10.1016/j.eupc.2005.05.011. [DOI] [PubMed] [Google Scholar]
- 73.Coronel R, Wilms-Schopman FJG, Opthof T, Janse MJ. Dispersion of repolarization and arrhythmogenesis. Heart Rhythm. 2009;6:537–543. doi: 10.1016/j.hrthm.2009.01.013. [DOI] [PubMed] [Google Scholar]
- 74.Efimov IR, Nikolski VP, Salama G. Optical imaging of the heart. Circ Res. 2004 Jul 9;95:21–33. doi: 10.1161/01.RES.0000130529.18016.35. [DOI] [PubMed] [Google Scholar]
- 75.Lou Q, Ripplinger CM, Bayly PV, Efimov IR. Quantitative panoramic imaging of epicardial electrical activity. Ann Biomed Eng. 2008 Oct;36:1649–58. doi: 10.1007/s10439-008-9539-3. [DOI] [PMC free article] [PubMed] [Google Scholar]
- 76.Efimov IR, Gray RA, Roth BJ. Virtual electrodes and deexcitation: new insights into fibrillation induction and defibrillation. J Cardiovasc Electrophysiol. 2000 Mar;11:339–53. doi: 10.1111/j.1540-8167.2000.tb01805.x. [DOI] [PubMed] [Google Scholar]
- 77.Yamanouchi Y, Cheng Y, Tchou PJ, Efimov IR. The mechanisms of the vulnerable window: the role of virtual electrodes and shock polarity. Can J Physiol Pharmacol. 2001 Jan;79:25–33. [PubMed] [Google Scholar]


